
Key Takeaways
-
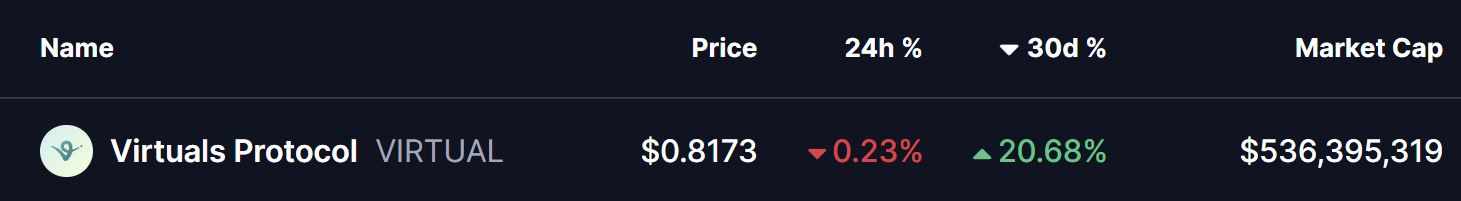
Virtuals Protocol (VIRTUAL) is holding around 20% monthly gains despite short-term market weakness.
-
The 4H chart shows a developing inverse head and shoulders pattern, a classic bullish reversal structure.
-
Price recently faced rejection near the $0.85 neckline, suggesting the right shoulder is still forming.
-
A potential dip toward the $0.78 support zone could complete the pattern and attract buyers.
-
A confirmed breakout above $0.85 may open the door for a stronger upside move, while losing $0.78 could delay the bullish setup.
Virtuals Protocol (VIRTUAL), the native token of the decentralized infrastructure and launchpad powering autonomous AI agents, has been holding up relatively well despite recent market-wide hesitation. The token is still sitting on around 20% monthly gains, although it is trading slightly in the red today in line with broader crypto sentiment.
Source: Coinmarketcap
However, when you zoom into the chart, the price action tells a more interesting story. Beneath the short-term weakness, VIRTUAL appears to be building a classic bullish reversal structure, one that could act as the base for a stronger upside move if confirmed.
Inverse Head and Shoulders Pattern Takes Shape
On the 4-hour timeframe, VIRTUAL has carved out a clear inverse head and shoulders pattern, a formation often associated with trend reversals after a prolonged pullback.
-
The left shoulder developed near the $0.80 zone, where buyers initially stepped in.
-
This was followed by a deeper decline toward $0.75, forming the head of the structure and marking the local low.
-
Price then rebounded toward the descending neckline resistance around $0.85, where it faced rejection once again.
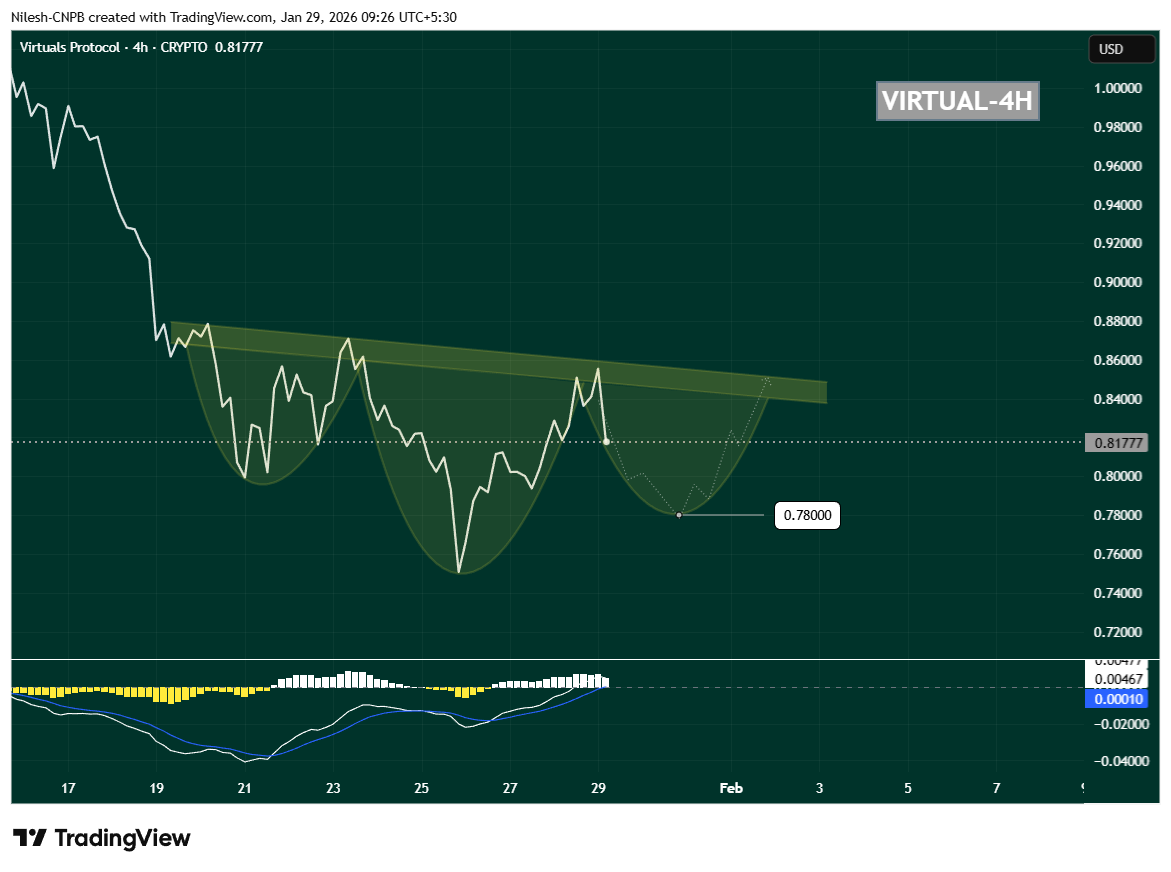
VIRTUAL 4H Chart/Coinsprobe (Source: Tradingview)
Following this rejection, VIRTUAL has started to drift lower and is currently trading near $0.8177, suggesting that the right shoulder may still be forming. This behavior fits well with the textbook structure of the pattern and keeps the bullish setup technically valid for now.
Momentum Signals Support the Setup
Momentum indicators are also worth watching closely. On the same timeframe, the MACD is cooling off and curling downward, reflecting short-term weakness rather than a full trend breakdown. In many cases, this kind of MACD reset during right-shoulder formation actually helps fuel the next impulsive move higher once buyers regain control.
As long as selling pressure remains controlled and price avoids a sharp breakdown, this momentum reset can work in favor of the bulls.
What’s Next for VIRTUAL?
If the pattern continues to play out, VIRTUAL could dip toward the $0.78 region, which aligns well with the projected right-shoulder bottom visible on the chart. This zone may act as a critical demand area where buyers look to step back in.
A strong bounce from this region, followed by renewed buying pressure, would increase the probability of a bullish breakout attempt toward the $0.85 neckline. A clean move above this resistance would confirm the inverse head and shoulders pattern and signal a potential shift back into a short-term uptrend.
On the downside, losing the $0.78 support decisively would weaken the structure and delay the bullish thesis, potentially opening the door for deeper consolidation.
For now, VIRTUAL is at a key technical crossroads. The structure remains constructive, the pattern is intact, and the chart suggests that the next major move—up or down—could arrive once this right shoulder finishes forming. Traders will be watching closely how price reacts around support in the coming sessions.
Disclaimer: The views and analysis presented in this article are for informational purposes only and reflect the author’s perspective, not financial advice. Technical patterns and indicators discussed are subject to market volatility and may or may not yield the anticipated results. Investors are advised to exercise caution, conduct independent research, and make decisions aligned with their individual risk tolerance.
About Author: Nilesh Hembade is the Founder and Lead Author of Coinsprobe, with over 5 years of experience in the cryptocurrency and blockchain industry. Since launching Coinsprobe in 2023, he has been providing daily, research-driven insights through in-depth market analysis, on-chain data, and technical research.
Disclaimer: The information on this page may come from third parties and does not represent the views or opinions of Gate. The content displayed on this page is for reference only and does not constitute any financial, investment, or legal advice. Gate does not guarantee the accuracy or completeness of the information and shall not be liable for any losses arising from the use of this information. Virtual asset investments carry high risks and are subject to significant price volatility. You may lose all of your invested principal. Please fully understand the relevant risks and make prudent decisions based on your own financial situation and risk tolerance. For details, please refer to
Disclaimer.
Related Articles
Will XRP Hold $1.33 or Extend Toward $1.30 Before Rebound?
XRP is currently trading at $1.35, experiencing a 1.3% decline. Key support is at $1.34, while resistance is at $1.40. The price is testing around the Fibonacci levels of $1.33 and $1.30, crucial for potential upward movement or deeper decline.
CryptoNewsLand1h ago
Dogecoin Monthly Breakdown Pattern Reappears as Price Tests $0.0918
Dogecoin is currently trading at $0.09205 at a gain of 2.3, with support of above $0.08878.
As can be seen in the monthly chart, there are recurring breakdown areas that have been followed by significant expansions in price.
The short-term trading range is narrow and the immediate point o
CryptoNewsLand2h ago
Solana Nears $95 Resistance With $17B Volume Surge
Solana approaches a key resistance level near $95, with increased trading volume and open interest signaling active trader interest. The token is currently at $90.20, facing potential upward movement if it surpasses $95, but may test $85 if rejected.
CryptoFrontNews2h ago
Bitcoin Slips to $68,000 as Middle East Conflict and US Jobs Data Trigger Sell-Off
Bitcoin surrendered its $70,000 support level, triggering a broader crypto market retreat that wiped out $329 million in leveraged positions. This downturn was fueled by a perfect storm of geopolitical and macroeconomic pressures.
Wiping out the ‘War Gains’
Bitcoin’s midweek resilience
Coinpedia2h ago
PEPE Hovers at Critical $0.053414 Support as $432M Volume Surge Tightens Breakout Watch
PEPE is trading at $0.053416, just above support at $0.053414, with significant trading volume up 22.14%. Resistance is at $0.053676. Despite a slight decrease in price, there’s increased market activity, suggesting potential volatility.
CryptoNewsLand2h ago
DXY Retest at 99.183: Will 100–101 Break as US Degen Index Stabilizes?
DXY trades at 99.183 while retesting the 100–101 monthly resistance zone.
US Degen Index 6900 sits at $0.0001197 with support at $0.0001175 and resistance at $0.0001214.
A break above 101 on DXY would shift structure higher, while rejection keeps price below key resistance.
The U.
CryptoNewsLand3h ago