
Key Takeaways
-
Virtuals Protocol (VIRTUAL) is holding around 20% monthly gains despite short-term market weakness.
-
The 4H chart shows a developing inverse head and shoulders pattern, a classic bullish reversal structure.
-
Price recently faced rejection near the $0.85 neckline, suggesting the right shoulder is still forming.
-
A potential dip toward the $0.78 support zone could complete the pattern and attract buyers.
-
A confirmed breakout above $0.85 may open the door for a stronger upside move, while losing $0.78 could delay the bullish setup.
Virtuals Protocol (VIRTUAL), the native token of the decentralized infrastructure and launchpad powering autonomous AI agents, has been holding up relatively well despite recent market-wide hesitation. The token is still sitting on around 20% monthly gains, although it is trading slightly in the red today in line with broader crypto sentiment.
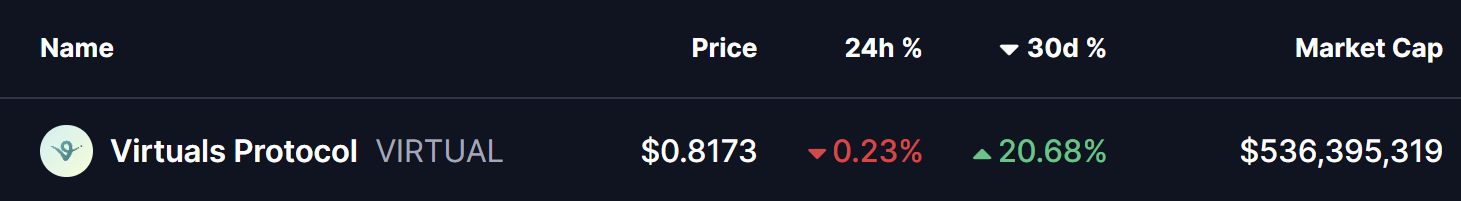
Source: Coinmarketcap
However, when you zoom into the chart, the price action tells a more interesting story. Beneath the short-term weakness, VIRTUAL appears to be building a classic bullish reversal structure, one that could act as the base for a stronger upside move if confirmed.
Inverse Head and Shoulders Pattern Takes Shape
On the 4-hour timeframe, VIRTUAL has carved out a clear inverse head and shoulders pattern, a formation often associated with trend reversals after a prolonged pullback.
-
The left shoulder developed near the $0.80 zone, where buyers initially stepped in.
-
This was followed by a deeper decline toward $0.75, forming the head of the structure and marking the local low.
-
Price then rebounded toward the descending neckline resistance around $0.85, where it faced rejection once again.
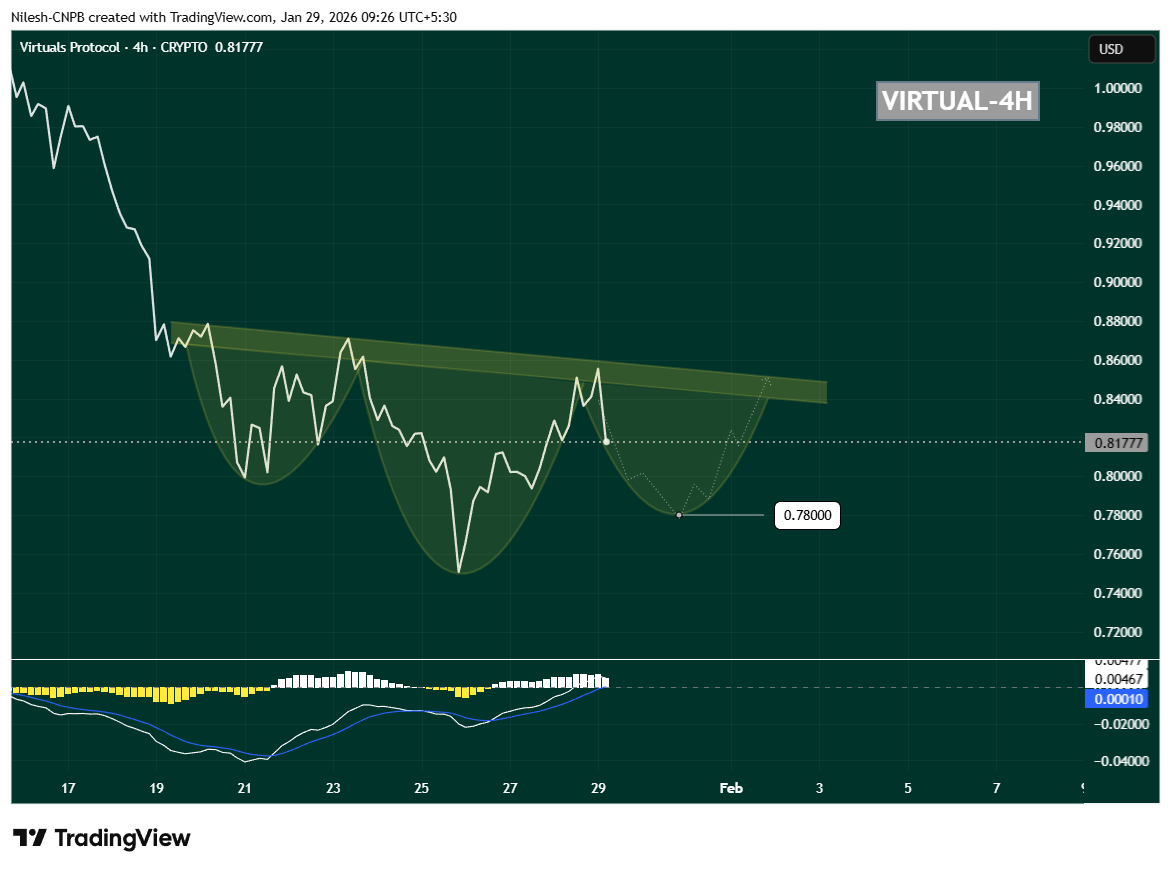
VIRTUAL 4H Chart/Coinsprobe (Source: Tradingview)
Following this rejection, VIRTUAL has started to drift lower and is currently trading near $0.8177, suggesting that the right shoulder may still be forming. This behavior fits well with the textbook structure of the pattern and keeps the bullish setup technically valid for now.
Momentum Signals Support the Setup
Momentum indicators are also worth watching closely. On the same timeframe, the MACD is cooling off and curling downward, reflecting short-term weakness rather than a full trend breakdown. In many cases, this kind of MACD reset during right-shoulder formation actually helps fuel the next impulsive move higher once buyers regain control.
As long as selling pressure remains controlled and price avoids a sharp breakdown, this momentum reset can work in favor of the bulls.
What’s Next for VIRTUAL?
If the pattern continues to play out, VIRTUAL could dip toward the $0.78 region, which aligns well with the projected right-shoulder bottom visible on the chart. This zone may act as a critical demand area where buyers look to step back in.
A strong bounce from this region, followed by renewed buying pressure, would increase the probability of a bullish breakout attempt toward the $0.85 neckline. A clean move above this resistance would confirm the inverse head and shoulders pattern and signal a potential shift back into a short-term uptrend.
On the downside, losing the $0.78 support decisively would weaken the structure and delay the bullish thesis, potentially opening the door for deeper consolidation.
For now, VIRTUAL is at a key technical crossroads. The structure remains constructive, the pattern is intact, and the chart suggests that the next major move—up or down—could arrive once this right shoulder finishes forming. Traders will be watching closely how price reacts around support in the coming sessions.
Disclaimer: The views and analysis presented in this article are for informational purposes only and reflect the author’s perspective, not financial advice. Technical patterns and indicators discussed are subject to market volatility and may or may not yield the anticipated results. Investors are advised to exercise caution, conduct independent research, and make decisions aligned with their individual risk tolerance.
About Author: Nilesh Hembade is the Founder and Lead Author of Coinsprobe, with over 5 years of experience in the cryptocurrency and blockchain industry. Since launching Coinsprobe in 2023, he has been providing daily, research-driven insights through in-depth market analysis, on-chain data, and technical research.
Disclaimer: The information on this page may come from third parties and does not represent the views or opinions of Gate. The content displayed on this page is for reference only and does not constitute any financial, investment, or legal advice. Gate does not guarantee the accuracy or completeness of the information and shall not be liable for any losses arising from the use of this information. Virtual asset investments carry high risks and are subject to significant price volatility. You may lose all of your invested principal. Please fully understand the relevant risks and make prudent decisions based on your own financial situation and risk tolerance. For details, please refer to
Disclaimer.
Related Articles
Pi Coin Gains Momentum Ahead of Pi Day as Traders Watch Price
The surrounding activity in the market in terms of Pi Coin Pi Day momentum is revolutionizing as the community gets ready to celebrate one of the most anticipated days in the ecosystem. Traders and advocates of the network are also placing themselves before March 14 which is commonly recognized as P
Coinfomania53m ago
Aptos Shows Momentum: Could APT Break Resistance Soon?
APT tests $1 resistance, forming higher lows and showing steady buyer conviction.
Rising triangle, A/D, and MFI indicators suggest building bullish momentum.
Confirmation above $1 could trigger breakout, but BTC stability and caution remain important.
Aptos — APT, has been gaining
CryptoNewsLand1h ago
Bitcoin Gold Price Soars 12.83%: Institutional Interest Grows
Bitcoin Gold's price surged by 12.83% to $0.554349, reflecting increased market interest, particularly from institutional investors. Active trading indicates growing retail participation. Traders are monitoring key price levels for potential future trends.
Coinfomania1h ago
Bitcoin shows resilience, options market indicates easing of downside concerns
Despite international oil prices rising to $115 and the market shifting to a defensive stance, Bitcoin has shown resilience, with options flow indicating reduced downside concerns. Market optimism towards Bitcoin is returning, with focus on this week's economic data.
GateNews2h ago
'Bull Trap Forming' – Willy Woo Says Bottom Not In for Bitcoin
Willy Woo, an on-chain analyst, warns that Bitcoin's recent rally may be a "bull trap," suggesting the market remains in a downward trend and that the true bottom has not yet been reached. Traders should remain cautious and watch for potential lower prices.
Coinpedia2h ago
Trump says oil prices will quickly fall back, but Bitcoin and the stock market have already been hit
On March 9th, as the "Epic Rage Action" escalated, the global energy markets experienced intense volatility, with oil prices soaring to $116 at one point, raising concerns about supply disruptions through the Strait of Hormuz. Trump predicted that oil prices would fall back, but gasoline prices have already risen to $3.45. The stock and cryptocurrency markets declined sharply, and investors should pay attention to the impact of geopolitical events on the markets and future monetary policies.
GateNews2h ago