
Key Takeaways
-
Pump.fun (PUMP) has surged over 18% recently, extending its monthly gains to nearly 60%.
-
The daily chart shows a clear inverse head and shoulders pattern, a classic bullish reversal setup.
-
PUMP has reclaimed the 50-day moving average, which is now acting as key short-term support.
-
The $0.003025 neckline resistance is the critical breakout level to watch.
-
A confirmed breakout could target $0.004612, implying a potential 53% upside.
Pump.fun (PUMP), the native token of the popular Solana-based launchpad protocol, is quietly gaining traction in the crypto market. After posting a sharp 18%+ rally, PUMP has now extended its monthly gains to nearly 60%. While the price surge has caught traders’ attention, a closer look at the daily chart structure suggests this move could be part of a larger bullish setup — provided a key resistance level is cleared.
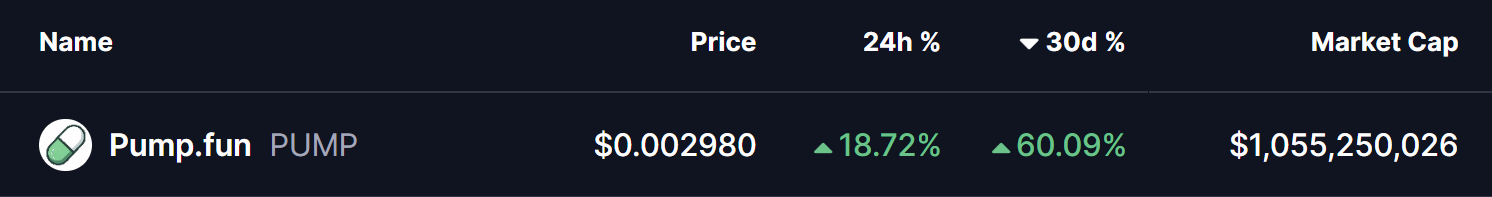
Source: Coinmarketcap
Inverse Head and Shoulders Pattern Takes Shape
On the daily timeframe, PUMP has carved out a well-defined inverse head and shoulders pattern, one of the most widely followed bullish reversal formations in technical analysis.
-
The left shoulder formed in early December near the $0.00247 region.
-
This was followed by a deeper pullback toward $0.00167, creating the head of the structure.
-
Price then recovered and found support again near $0.00225, completing the right shoulder.
Following the formation of this structure, PUMP rebounded steadily and has successfully reclaimed the 50-day moving average, which is now acting as dynamic support. The token is currently consolidating just below the neckline resistance around $0.003025, a level clearly highlighted on the chart.
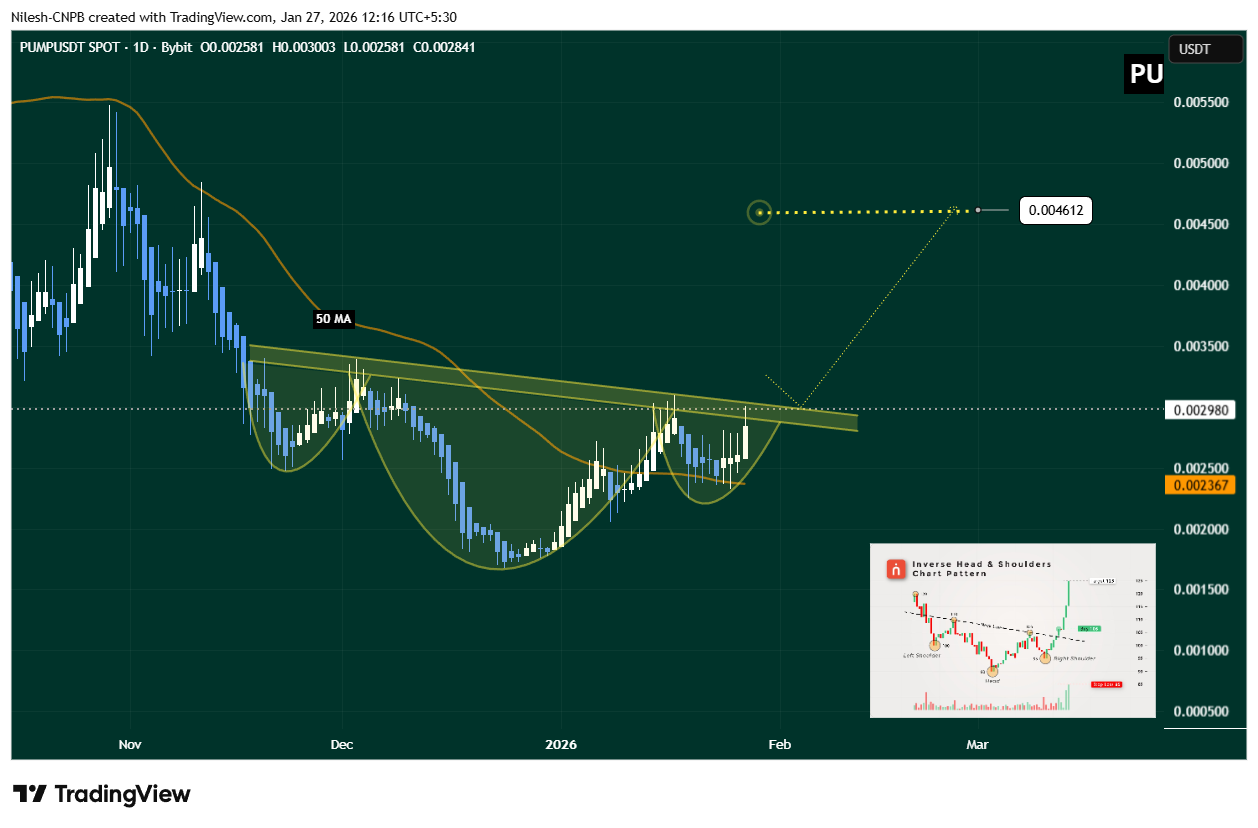
Pump.fun (PUMP) Daily Chart/Coinsprobe (Source: Tradingview)
This tightening price action near resistance often precedes a volatility expansion, suggesting a decisive move could be approaching.
What’s Next for PUMP?
For bullish momentum to gain confirmation, PUMP needs a strong daily close above the $0.003025 neckline, ideally followed by a successful retest of this zone as support. Such a move would validate the inverse head and shoulders breakout and signal a shift in short-term market structure.
Based on the measured move from the inverse head and shoulders pattern, a confirmed breakout could open the door for a price target near $0.004612 — representing a potential 53% upside from the breakout zone.
On the downside, failure to clear the neckline could lead to further consolidation. In that scenario, holding above the 50-day moving average and the $0.002367 support zone will be critical to keep the broader bullish setup intact.
Bottom Line
PUMP’s recent rally appears to be supported by a constructive chart pattern and improving momentum. As long as price continues to coil beneath neckline resistance while holding key support levels, the probability of a breakout remains elevated.
A decisive move above $0.003025 could mark the start of a fresh upside leg, while rejection would likely extend the current consolidation.
Disclaimer: The views and analysis presented in this article are for informational purposes only and reflect the author’s perspective, not financial advice. Technical patterns and indicators discussed are subject to market volatility and may or may not yield the anticipated results. Investors are advised to exercise caution, conduct independent research, and make decisions aligned with their individual risk tolerance.
About Author: Nilesh Hembade is the Founder and Lead Author of Coinsprobe, with over 5 years of experience in the cryptocurrency and blockchain industry. Since launching Coinsprobe in 2023, he has been providing daily, research-driven insights through in-depth market analysis, on-chain data, and technical research.
Disclaimer: The information on this page may come from third parties and does not represent the views or opinions of Gate. The content displayed on this page is for reference only and does not constitute any financial, investment, or legal advice. Gate does not guarantee the accuracy or completeness of the information and shall not be liable for any losses arising from the use of this information. Virtual asset investments carry high risks and are subject to significant price volatility. You may lose all of your invested principal. Please fully understand the relevant risks and make prudent decisions based on your own financial situation and risk tolerance. For details, please refer to
Disclaimer.
Related Articles
Bitcoin Death Cross Appears on Three-Day Chart, What Could Follow? - U.Today
Bitcoin recently formed a death cross on the three-day chart, which historically precedes significant bear market declines. This pattern suggests the potential for further downward movement in the current cycle, echoing past trends since 2014.
UToday1m ago
Short-selling firm Culper releases bearish report on Ethereum: Fusaka upgrade disrupts ETH token economics
Aggressive short-selling firm Culper Research has released a report bearish on Ethereum (ETH), believing that the Fusaka upgrade in 2025 will cause structural damage to ETH's token economy. The report points out that a significant decrease in Gas fees has led to increased address pollution attacks and reduced validator rewards, and emphasizes that Ethereum is facing competitive pressure from Solana and L2 solutions. Culper believes that ETH's value capture ability is declining and has started shorting ETH.
ChainNewsAbmedia1h ago
Geopolitical Turmoil! Dalio Declares "Gold is the Only True God," but Its Safe-Haven Performance Trails Bitcoin
As geopolitical tensions in the Middle East escalate, Bridgewater founder Ray Dalio questions Bitcoin and reaffirms gold as the preferred safe haven. Nevertheless, gold prices fell accordingly, while Bitcoin only experienced a slight correction, indicating that the correlation between the two is weakening. Dalio doubts Bitcoin's transparency and future risks, but he still maintains a small allocation of Bitcoin for diversification.
区块客2h ago
Zcash (ZEC) at the important crossroads: What could happen in the next few weeks?
Zcash (ZEC) shows signs of stabilization after declining from over 700 USD, with price nearing critical support around 200 USD. Recent recovery indicates buyer strength, but momentum indicators suggest caution. A breakout above 250 USD could initiate further recovery.
TapChiBitcoin2h ago
ETH 15-minute sharp decline of 1.53%: Large investors' short-term profit-taking and ETF capital outflows resonate, triggering a significant drop
From 13:45 to 14:00 on March 6, 2026 (UTC), ETH experienced a significant fluctuation, with a short-term decline of 1.53%. The price fluctuated sharply between 2019.21 and 2051.26 USDT, with an amplitude of 1.56%. High-frequency sell orders surged, market attention spiked, trading volume increased, and the divergence between bulls and bears intensified. Market sentiment became more cautious.
The main driving force behind this fluctuation was large investors and whale accounts reducing their positions after a short-term rebound, leading to a rapid release of large sell orders and triggering short-term selling pressure in the market. On the ETF front, holdings
GateNews2h ago
BTC short-term decline of 1.23%: whale fund outflows and leveraged long liquidations trigger concentrated selling
On 2026-03-06 from 13:45 to 14:00 (UTC), the price of Bitcoin (BTC) experienced a -1.23% return over 15 minutes, with a price range of 69,219.0 to 70,086.3 USDT, and an amplitude of 1.24%. Trading activity significantly increased in a short period, with the market focusing on intense volatility and a resurgence of risk sentiment.
The main drivers of this anomaly are continuous outflows of on-chain whale funds and large-scale leveraged long liquidations in the derivatives market. According to on-chain data, whale withdrawals reached as high as 16,972 BTC in a single day, Whales O
GateNews2h ago