Author: @WazzCrypto, Legion
Translation: Frank, PANews
Observations on Prediction Markets in the Token World
Polymarket’s TokenSale market has handled nearly $250 million in trading volume. The platform’s claimed accuracy metrics are impressive: subscription amount prediction accuracy reaches 100%, and FDV (Fully Diluted Valuation) exceeds 90%. However, deeper analysis reveals these numbers can be misleading. The real signal isn’t about what the crowd predicted, but how far off their predictions were.
By analyzing 231 predictions across 29 token sale events and cross-referencing Polymarket’s historical probability data with actual token performance on CoinGecko, we find that “prediction markets are not reliable forecasting tools.” Instead, they serve as sentiment indicators, often providing reverse signals.
Key Finding: One week before market close, the actual prediction accuracy drops to only 66.7%. At critical moments, there’s a one-in-three chance the crowd is wrong, and incorrect predictions tend to show systematic over-optimism.
24-hour Volatility Issue: Using hourly data from CoinGecko, we find that Polymarket’s “FDV higher than X one day after release” market is essentially betting on extreme volatility. The average 24-hour price change is ±23% (best performer: Monad +54.8%; worst: Trove -38.7%). 75% of tokens experience sell-offs within 24 hours of opening. Under these conditions, Polymarket’s accuracy in 24-hour FDV predictions is only 62.5%.
The Fallacy of Accuracy: One-third of the time, the market is wrong
When we track market probabilities that change over time, rather than static data at settlement, a very different picture emerges. The seeming “100% accuracy” of subscription markets is because, as sales progress, the final numbers inevitably leak out. Insiders and observers update prices accordingly, which is just post hoc price discovery.
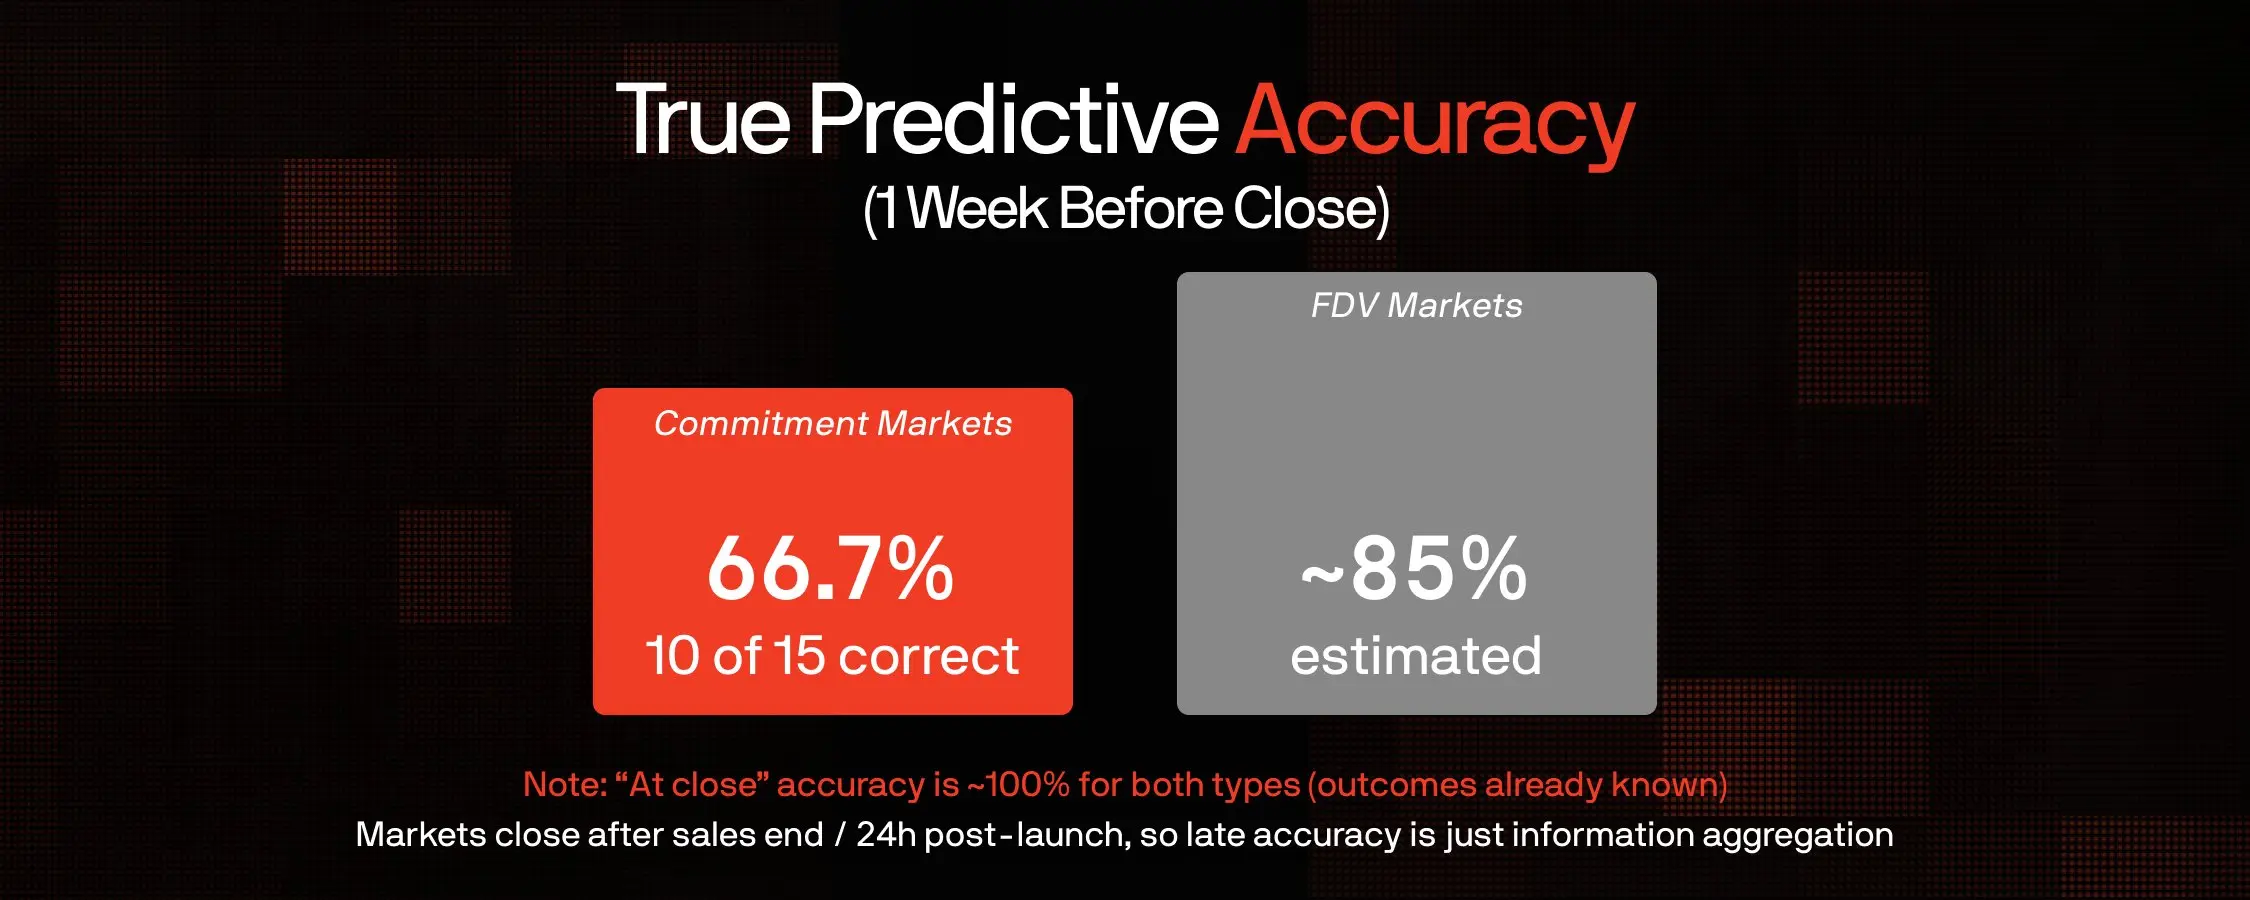
Critical Insight: The reason subscription markets and FDV markets approach 100% accuracy at close is because they settle after the outcome is essentially known. Subscription markets close after sales end; FDV markets close 24 hours after release. The only meaningful prediction window is the one week before close, when uncertainty still exists. A 66.7% accuracy rate indicates that, at critical moments, the market is wrong one-third of the time.
The crowd’s over-optimism leads to prediction errors
We reviewed every prediction market where “public confidence exceeded 60% but ultimately was not realized.” In each case, the error was consistently in the same direction: excessive optimism. The crowd always overestimates fundraising amounts and valuation.
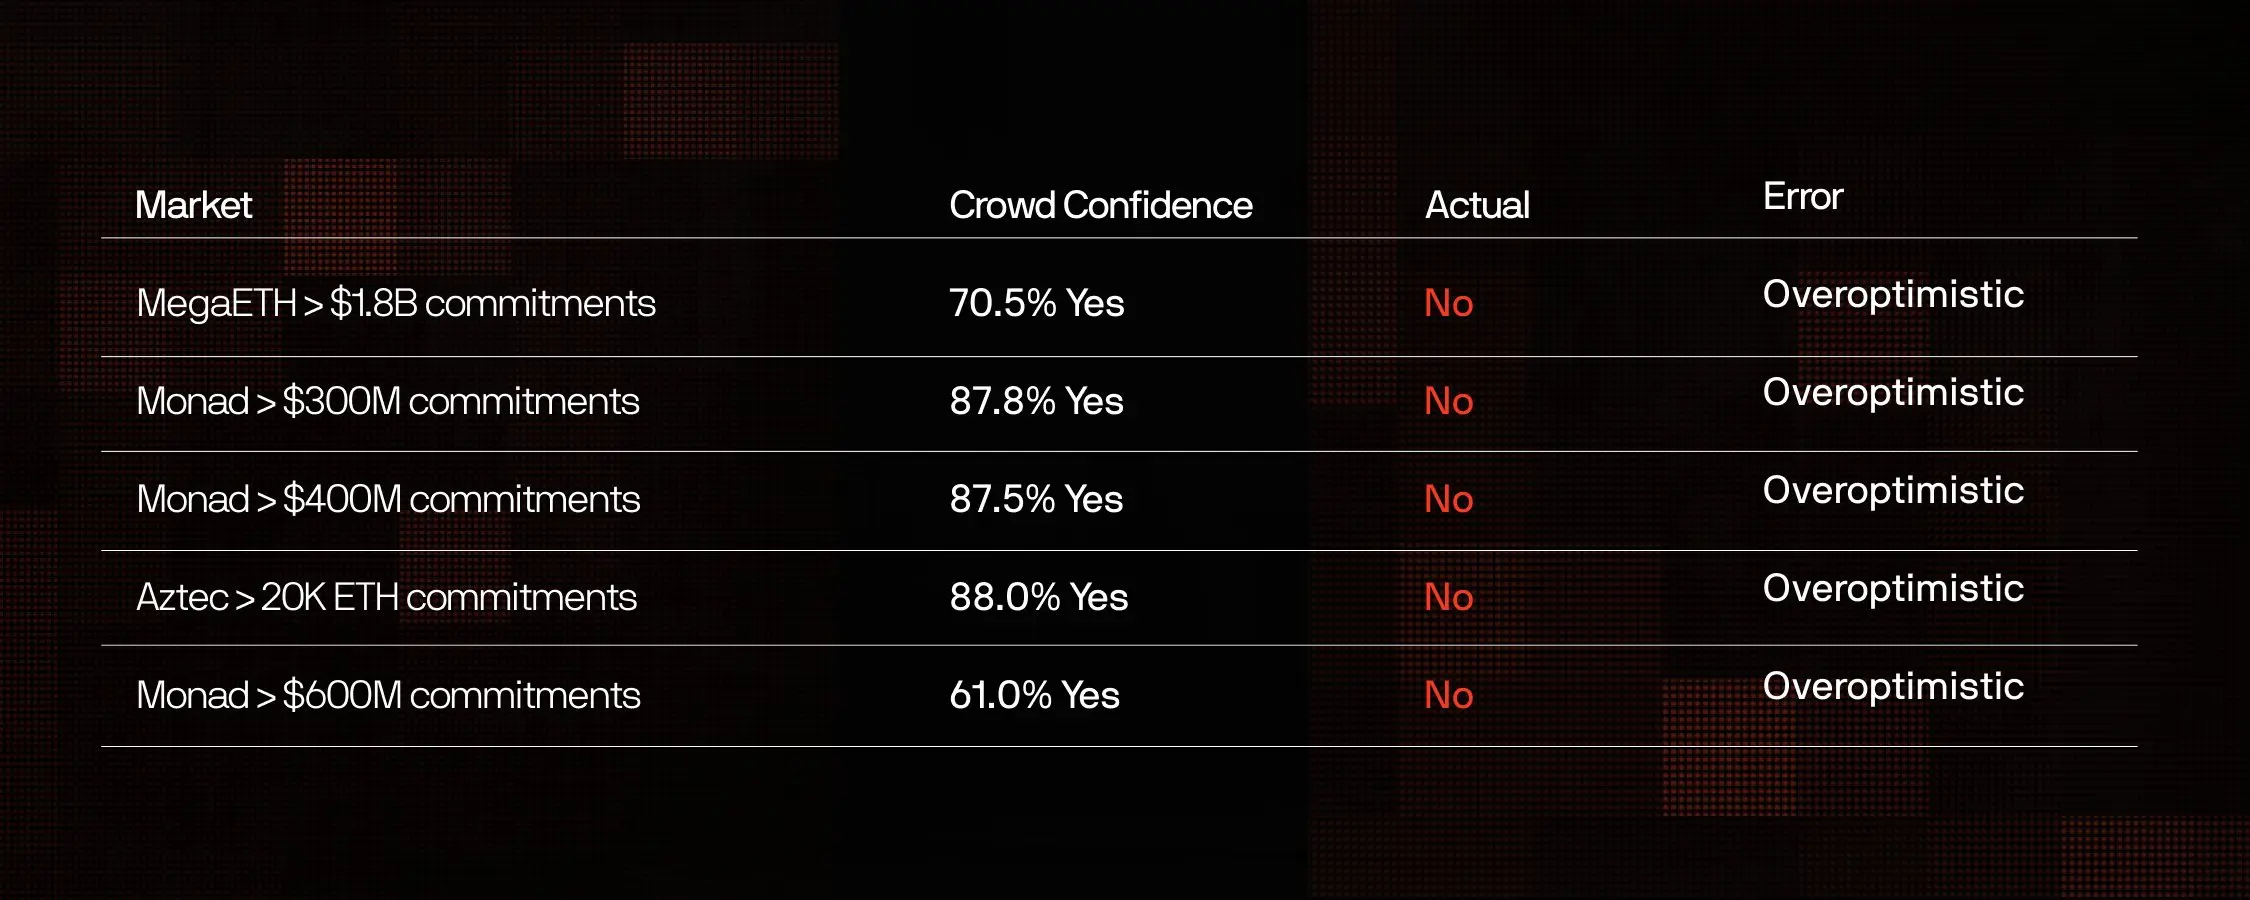
This systematic bias suggests that market participants are optimistic speculators, attracted by the bullish narrative and the allure of token sales.
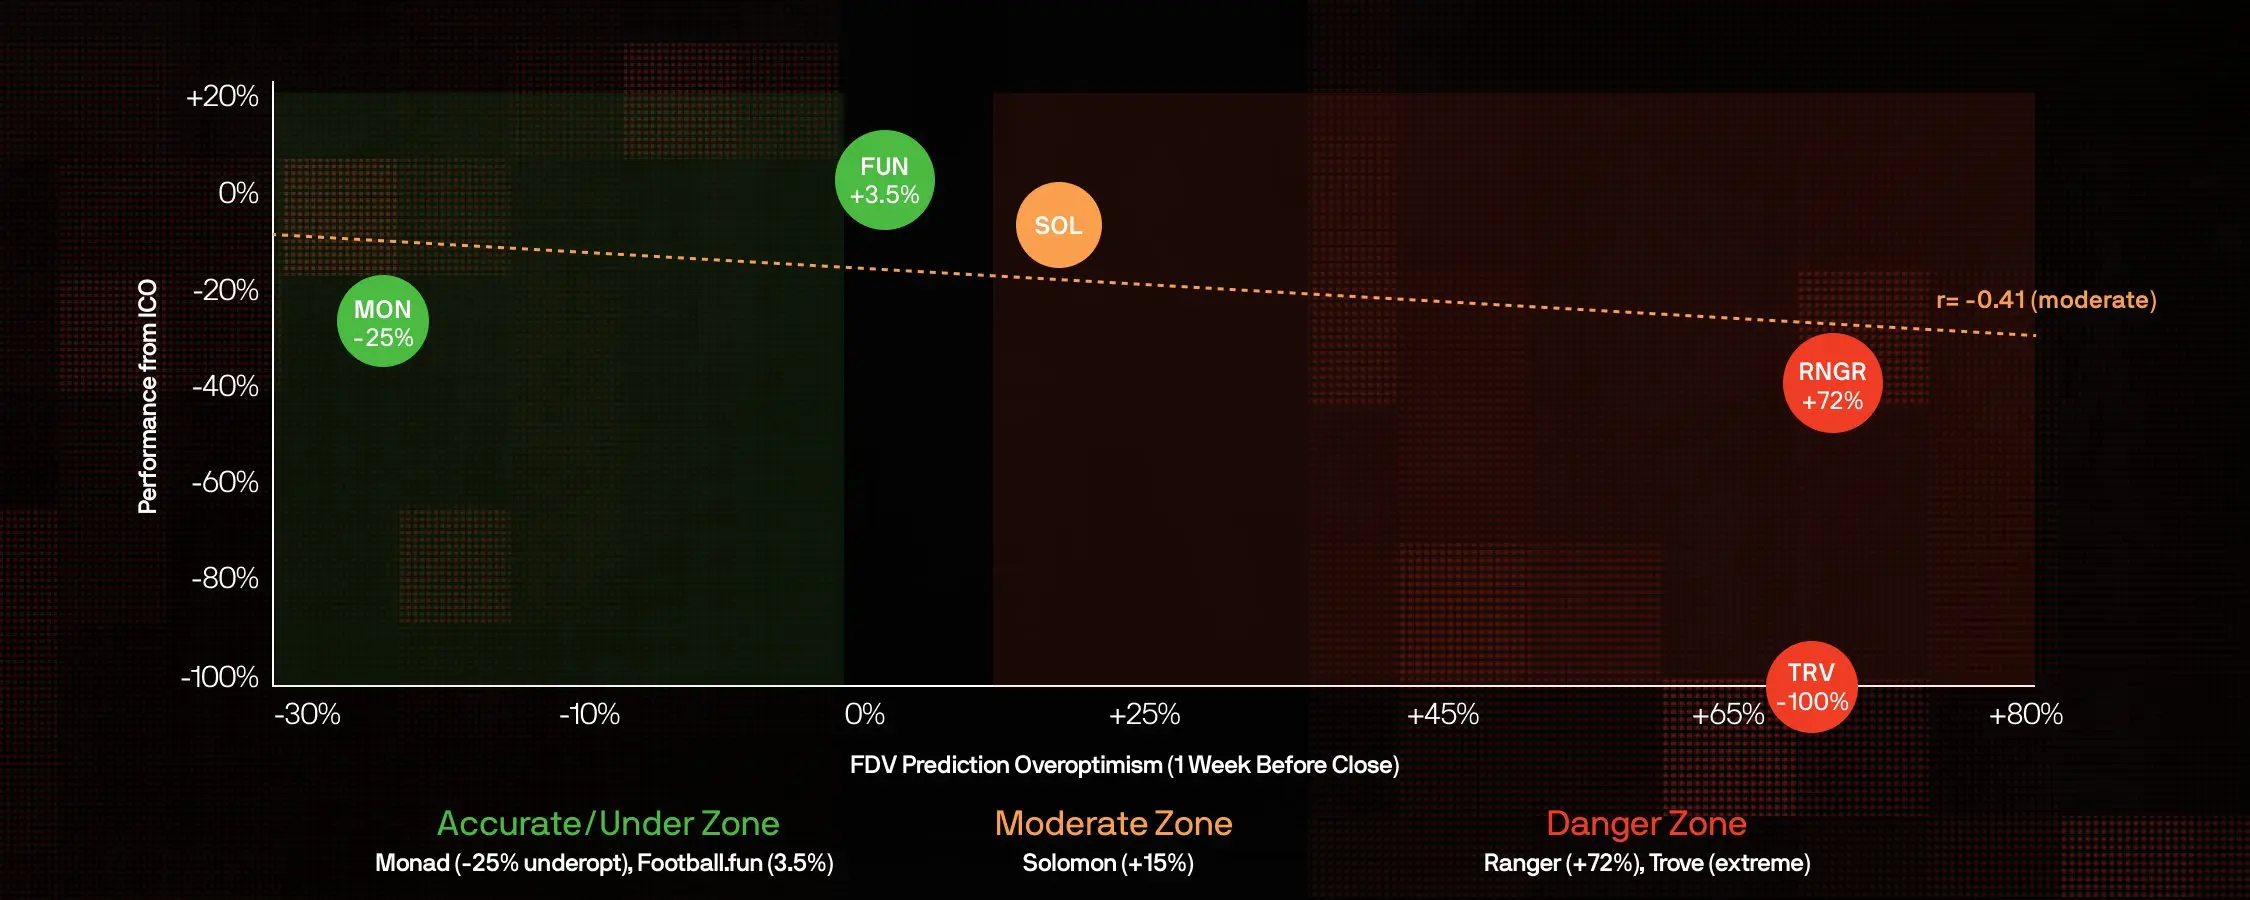
Over-optimism vs. Token Performance (based on ICO data)
Methodology: This analysis only includes markets for tokens with publicly available ICO data and issued tokens, using Polymarket odds from one week before closing.
Over-optimism degree = (Polymarket predicted FDV - actual 24h FDV) / actual 24h FDV.
Y-axis shows price performance from ICO to present.
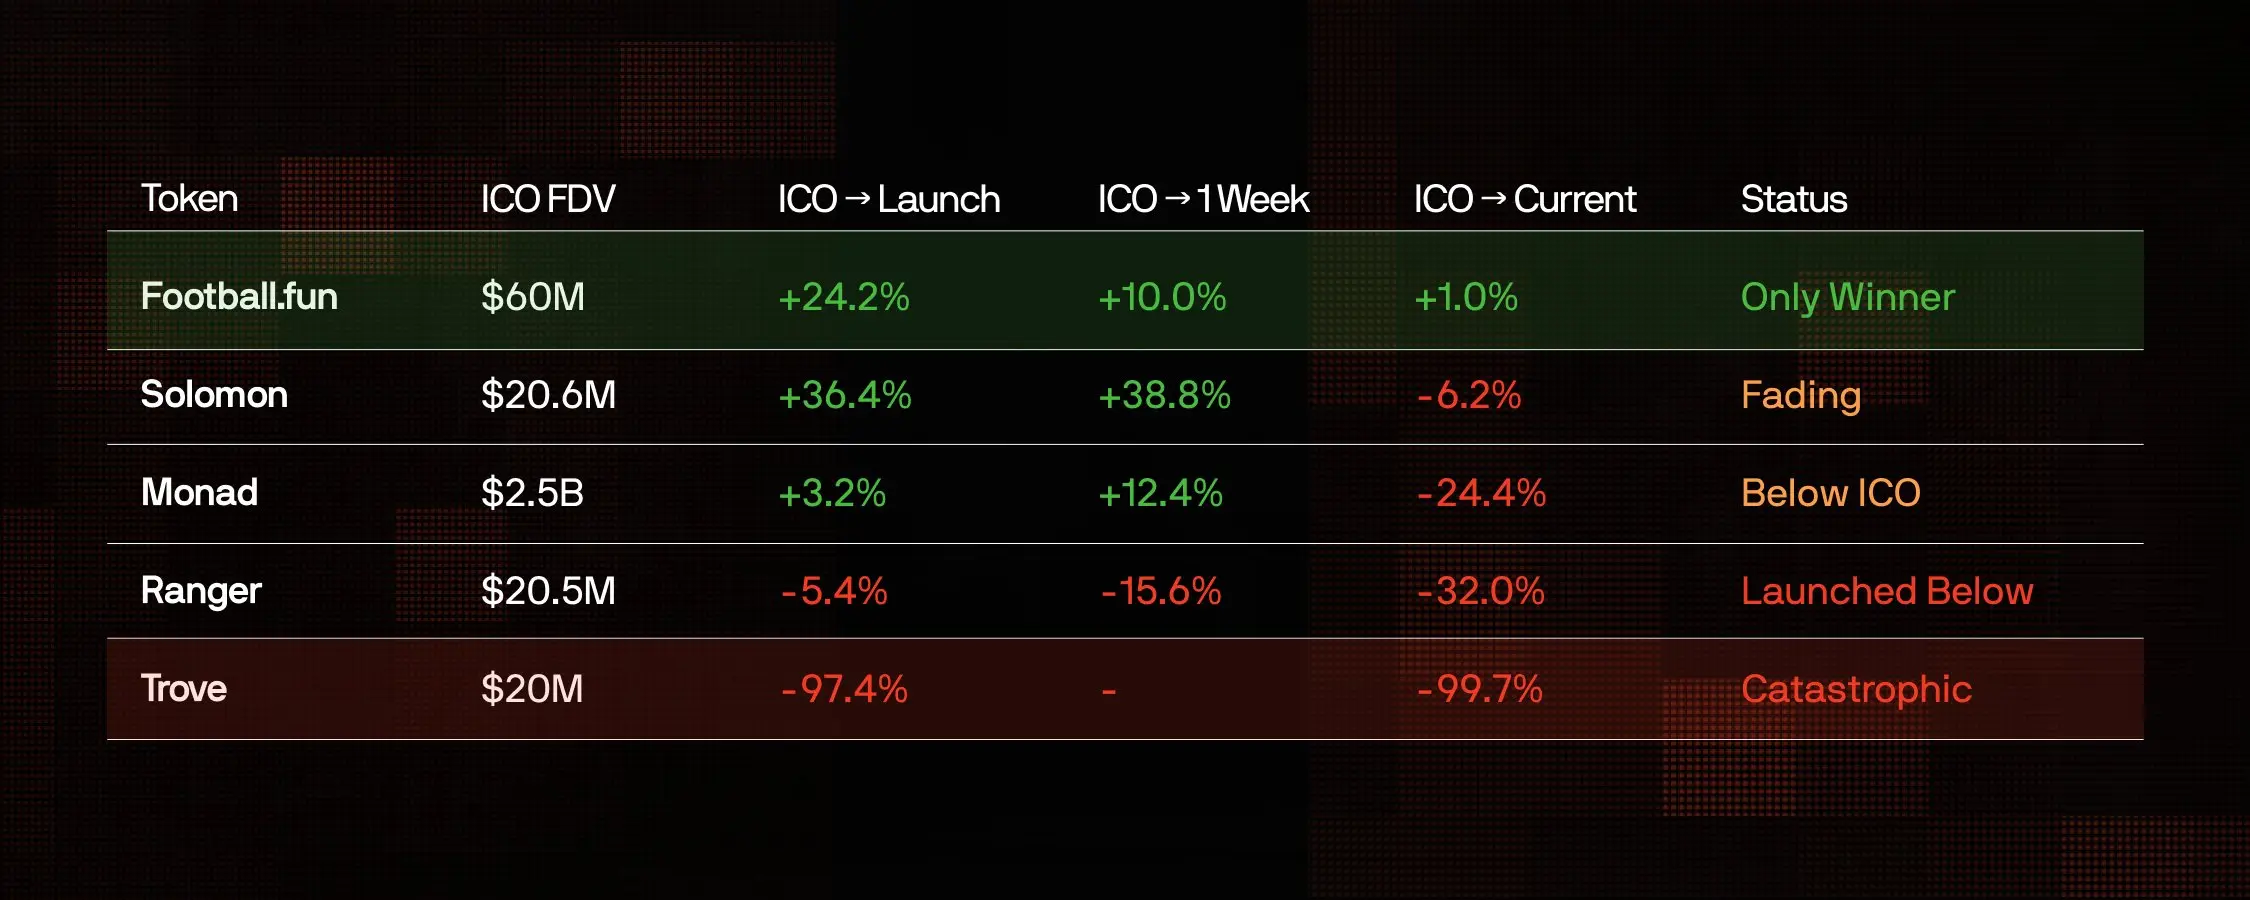
Data shows a moderate negative correlation between over-optimism and ICO returns (r = -0.41). Monad was “undervalued/pessimistic” by -25%, yet its price still fell 24% from ICO. Ranger was “most overly optimistic” (+72%), but its current price is down 32% from ICO. Only Football.fun remains above ICO price (+1%).
Token Performance Ranking: 40% of tokens debut below valuation
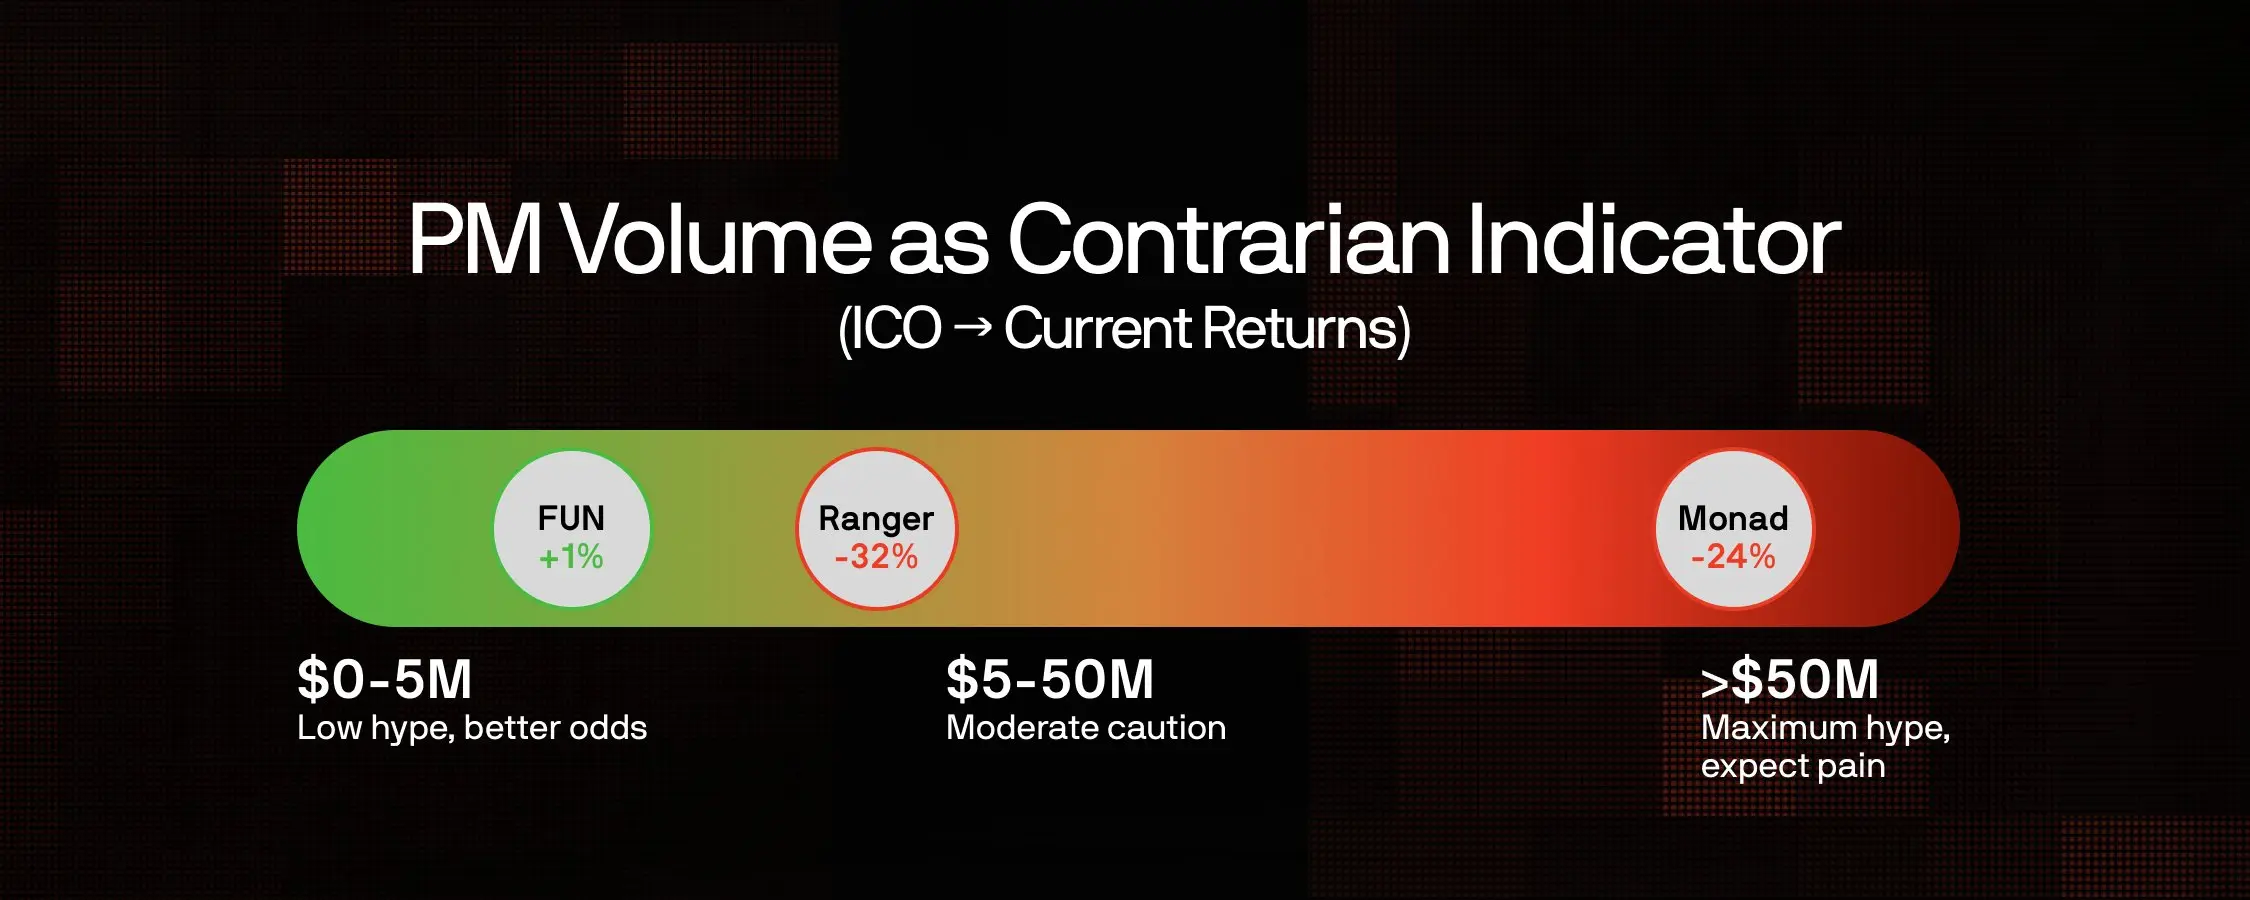
The table below uses Polymarket odds from one week before close to reveal actual prediction accuracy. The pattern is clear: extreme over-optimism predicts disaster, and high trading volume on Polymarket—even when predictions are accurate—often signals the opposite.
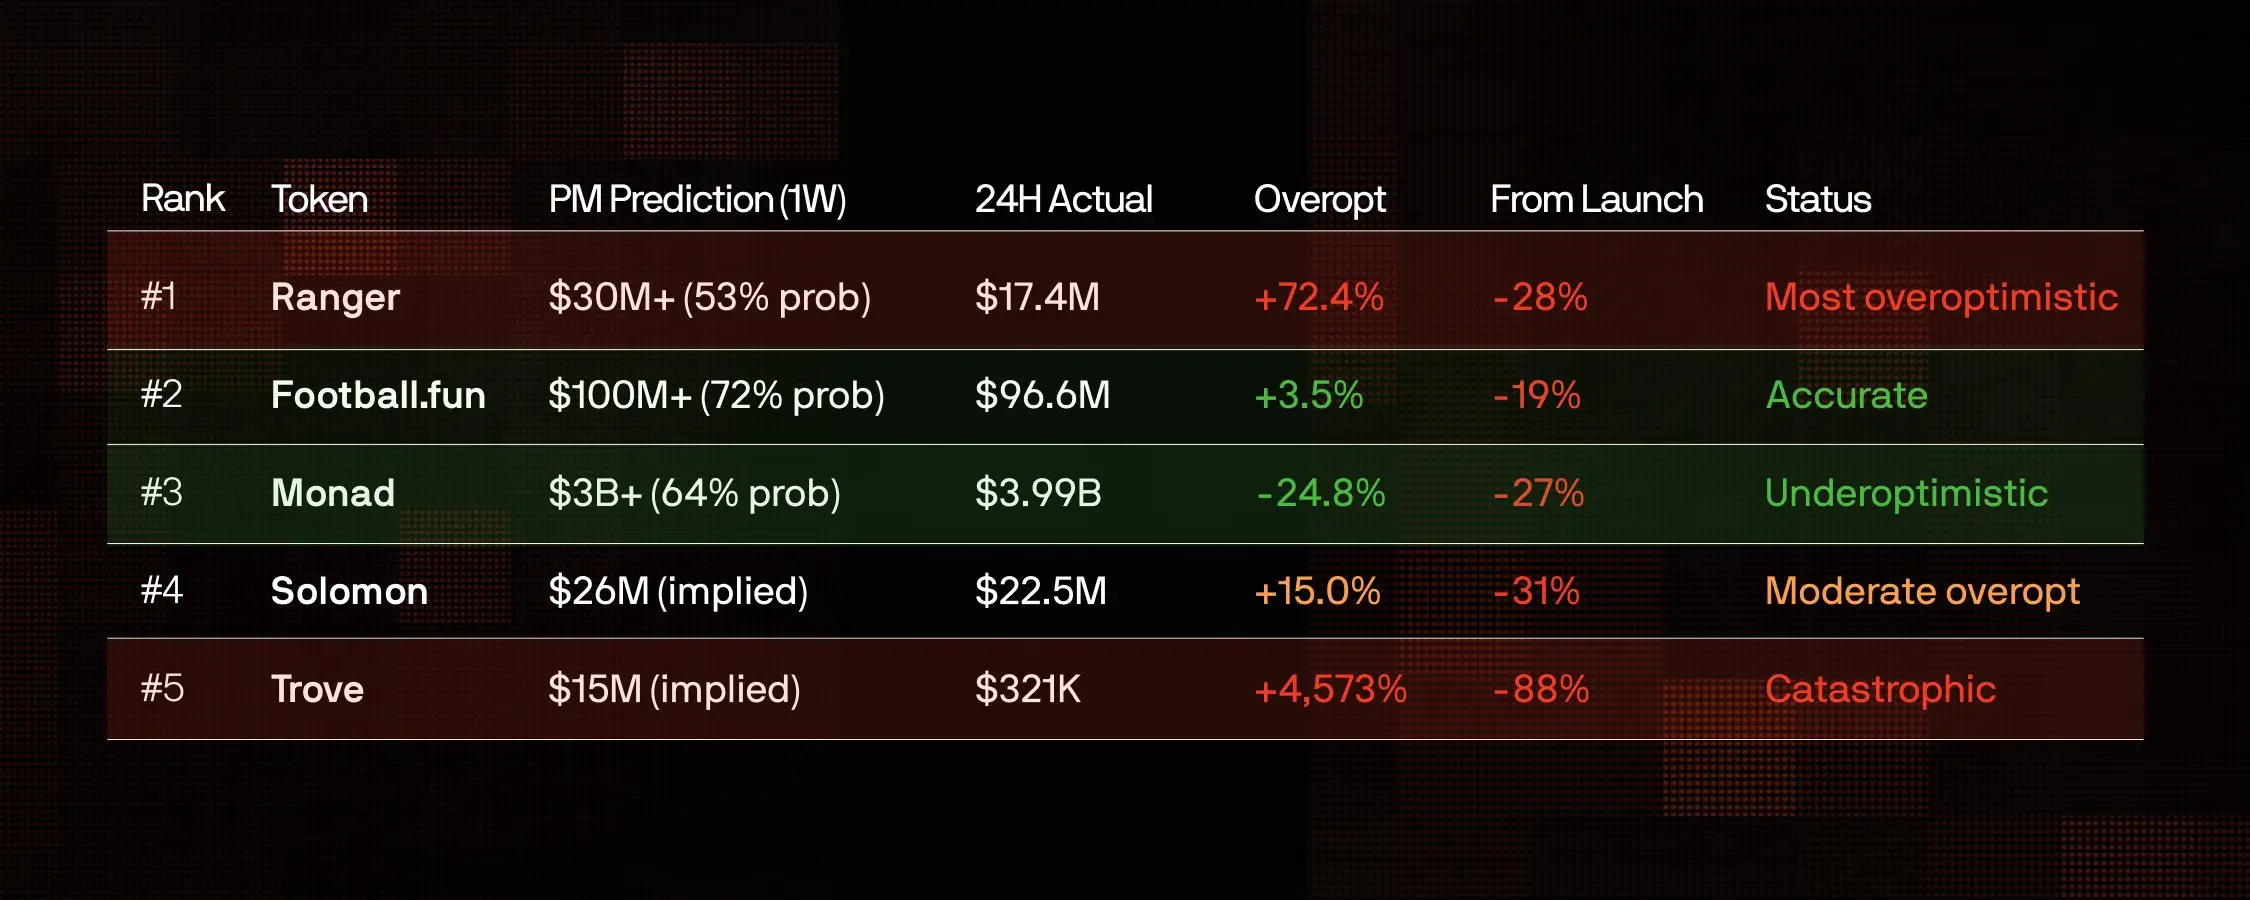
Key Finding: Among tokens with ICO data, 40% debuted below their ICO valuation. The average return from ICO to now is -32.2%. Only Football.fun traded above its ICO price.
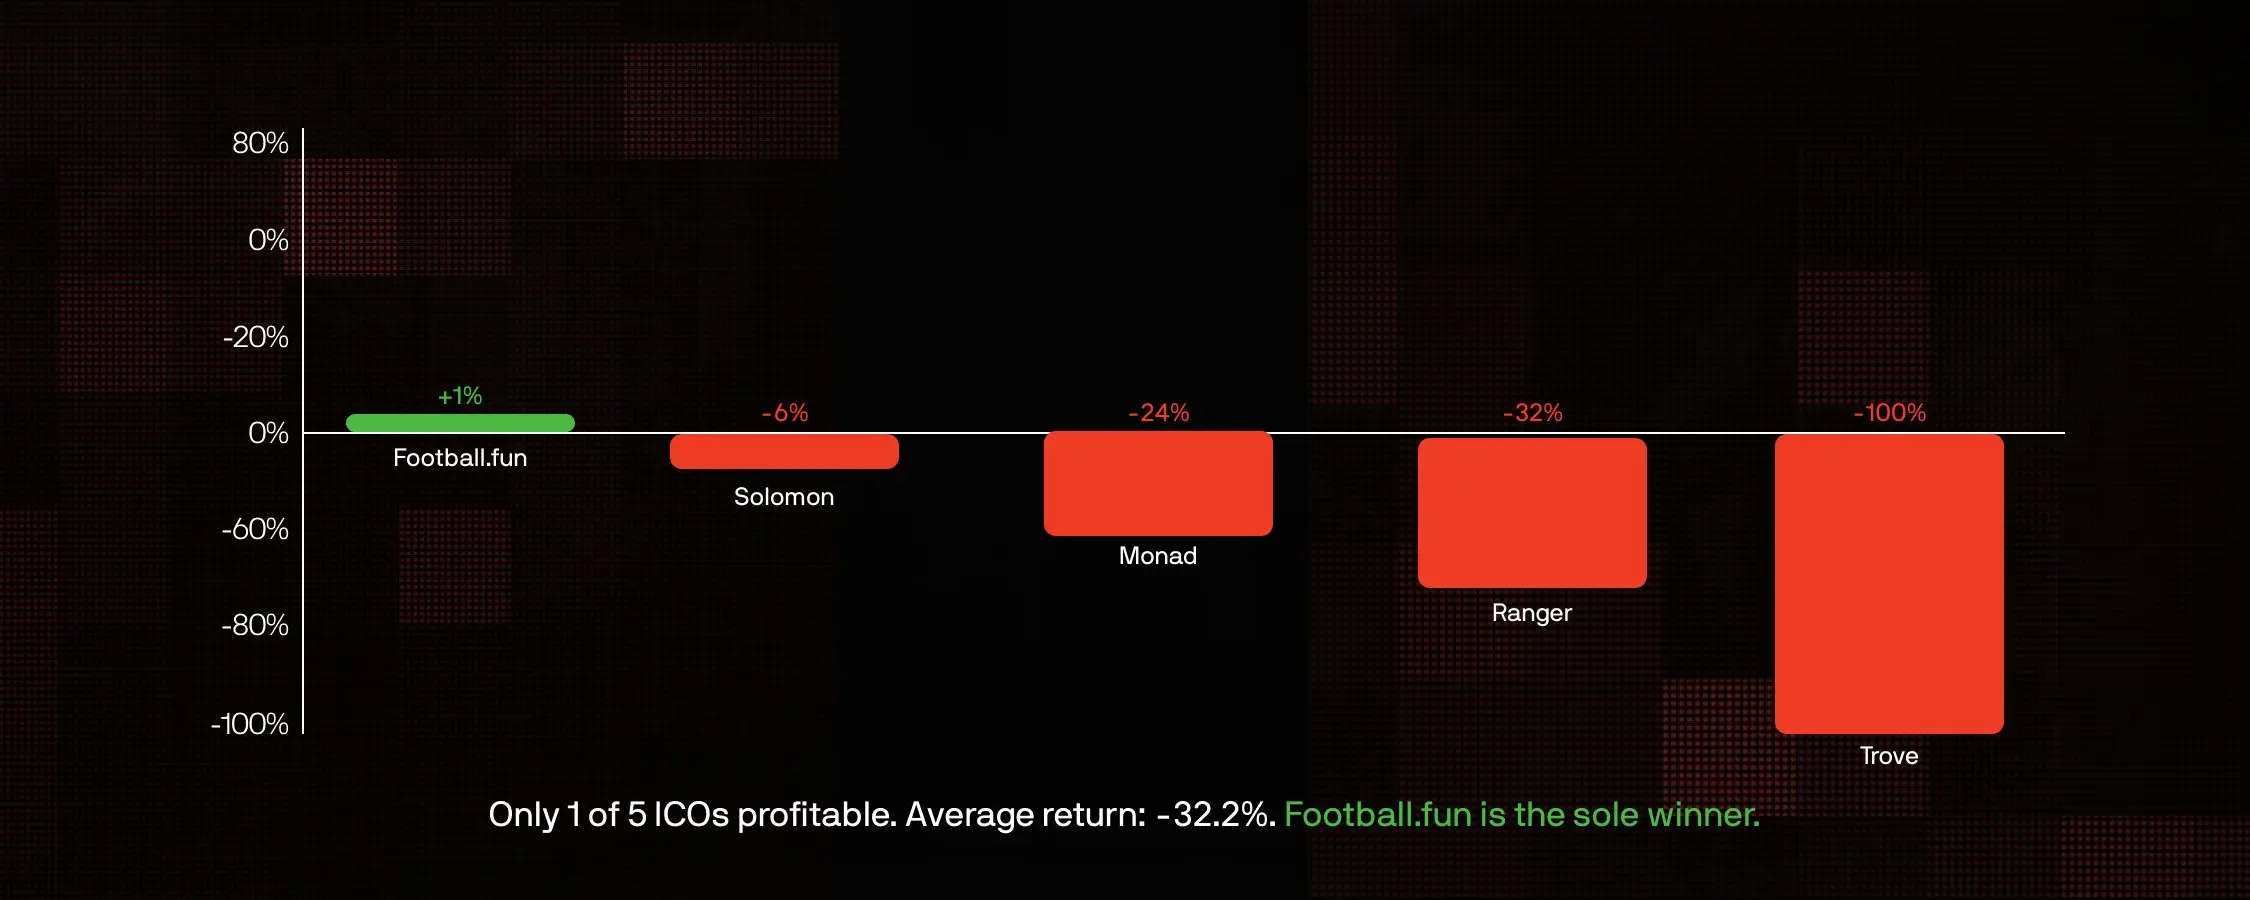
This pattern is brutal: even tokens that launched above ICO valuation (like Monad, Solomon) ultimately fell below issuance price. Football.fun is the only winner among the five ICO tokens in this dataset, currently just 1% above ICO.
Core Conclusions:
After analyzing 231 markets, $241.5 million in trading volume, and 8 verified 24-hour FDV data points, several clear points emerge:
- “100% accuracy” is meaningless. Markets settle after the outcome is known (subscription markets after sales, FDV markets after 24 hours), so their post hoc accuracy approaches 100%. But the true prediction accuracy one week before close is only 66.7%. At critical moments, the crowd is wrong one-third of the time.
- Systematic over-optimism. Among the top 15 markets, 5 show over 60% confidence in thresholds that were never reached. FDV is on average overestimated by +35%.
- High trading volume on prediction markets is a reverse signal. Monad ($89 million) and MegaETH ($67 million) show the highest over-optimism. The more capital the crowd bets, the more confident they are, and the more likely they are to be wildly wrong.
- Conservative predictions lead to better outcomes. Tokens with relatively accurate forecasts (Monad, Football.fun) experienced smaller declines. Low hype and accurate predictions seem to be bullish signals.
Trading signals:
Based on this analysis, we can distill actionable signals for evaluating future token sales. While not guaranteed, these reflect consistent patterns in the data.
Bearish signals:
- Polymarket trading volume > $50 million
- FDV over-optimism > 50%
- All FDV prediction thresholds likely to fail
- Subscription over-optimism > 30%
Bullish signals (relatively):
- Polymarket trading volume < $5 million
- FDV prediction deviation within 20%
- Multiple FDV thresholds achieved
- Crowd expectations are more conservative
This asymmetry is important. Bearish signals are strong indicators of poor outcomes, while bullish signals are weaker, merely suggesting the token may perform “not as badly” as overhyped alternatives. In a market where all tokens have fallen from ATH, “falling less” is already the best-case scenario.
Summary
Polymarket’s token sale sector is essentially a hype meter. The signal isn’t in the predictions themselves but in how much they deviate from reality. When the crowd floods in with capital betting on higher valuations, caution is wise. Historically, “extreme confidence” from the crowd often signals investors’ “greatest pain.”
Disclaimer: The information on this page may come from third parties and does not represent the views or opinions of Gate. The content displayed on this page is for reference only and does not constitute any financial, investment, or legal advice. Gate does not guarantee the accuracy or completeness of the information and shall not be liable for any losses arising from the use of this information. Virtual asset investments carry high risks and are subject to significant price volatility. You may lose all of your invested principal. Please fully understand the relevant risks and make prudent decisions based on your own financial situation and risk tolerance. For details, please refer to
Disclaimer.
Related Articles
Aster Price Nears $0.79 Breakout as Reversal Pattern Strengthens
Key Insights
Aster price structure shows an inverse head and shoulders pattern forming beneath $0.79 resistance, signaling growing buying pressure and possible trend reversal ahead.
Repeated tests of the $0.79 neckline suggest weakening selling pressure as buyers steadily absorb supply
CryptoFrontNews2h ago
The HYPE price could surge despite the upcoming $2.8 million short squeeze.
The recent price movements of Hyperliquid (HYPE) are characterized by stagnation around 30 USD. A symmetrical triangle pattern indicates potential for a breakout in either direction, but market sentiment is cautious. Short squeeze risks may boost prices, while weak market flow and deteriorating demand pose challenges. The token could face significant support levels if it dips below 30 USD. An improved market sentiment could lead to a breakout above 33 USD, sparking recovery momentum.
TapChiBitcoin2h ago
Ethereum Price Holds Key Support: Is $2,200 the Next Test for ETH?
March 6, 2026 7:15 pm EST
TheCoinRepublic4h ago
Cardano Price Trends: Bulls Eye Opportunity as Indicator Flashes Green
ADA: Trading near $0.27, facing resistance at $0.28 and support at $0.26.
Technical Indicators: RSI and MACD show weak momentum, signaling short-term consolidation and cautious trading.
Macro Outlook: Rising PMI and historical patterns suggest potential bullish rebound if resistance
CryptoNewsLand5h ago
CryptoQuant: Bitcoin NUPL--MVRV indicator reaches 0.33, or has entered the mid-stage of a bear market
Gate News Announcement, March 7th, CryptoQuant analyst Axel pointed out on the X platform that the Bitcoin NUPL--MVRV harmonic composite indicator has reached 0.33, while historical cycle bottoms typically occur around the 0.5 range. The chart shows that the bear market cycle is beginning to shift upward, indicating that Bitcoin may have entered the mid-stage of this bear market cycle, suggesting that extreme selling conditions are easing. However, this indicator is still well above historical bottom levels, implying that a market-wide bottom has not yet been confirmed.
GateNews5h ago
ZEC Price Analysis: Upcoming Trends and Targets for the Next Few Weeks
ZEC: Stabilized near $200 support, rebounding toward $250 resistance after prolonged bearish pressure.
Technical Indicators: RSI and MACD show gradual improvement, signaling moderate bullish momentum returning.
Market Outlook: Sustained above $240 could push ZEC toward $268, while
CryptoNewsLand6h ago