
Aster price is sitting at a moment that feels uncomfortable for short-term traders and cautious observers alike. The charts show a market that tried to lift, failed to hold key levels, and now sits back at a zone that has already been tested before. Price action looks heavy again, and the latest candles offer little relief for anyone hoping the downside pressure is finished.
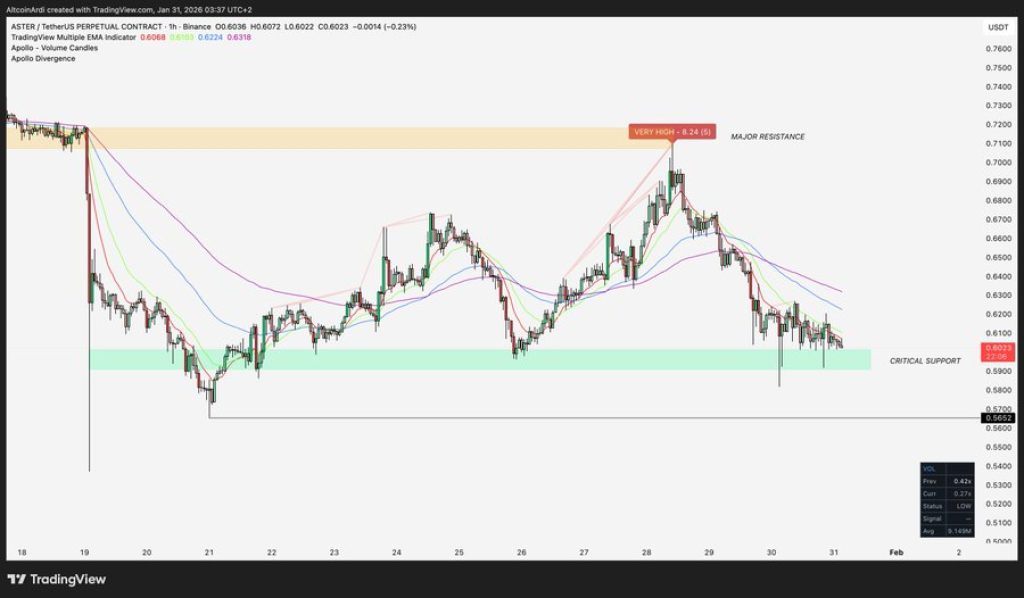
Aster price has drifted back into the $0.60 support area, a zone that already proved important earlier in the month. Analyst Ardi points out that this level acted as a temporary floor before, yet the structure now looks weaker. Price previously attempted to recover toward $0.72, which became the main resistance area and slowed further downside. That rejection mattered more than it first appeared.
Ardi explains that the push into $0.72 showed clear signs of exhaustion. The divergence indicator on the chart highlighted that momentum near the highs was stretched. Buyers were present, yet strength faded fast. That setup often leaves price vulnerable once momentum cools. The current return to $0.60 confirms that the bounce lacked durability.
@ArdiNSC / X
Ardi also notes that losing this support could open the door toward the $0.55 wick area. That level lines up with prior downside probes on the chart and represents the next visible zone where buyers may try to step in. He stresses that the broader ASTER price trend still leans lower, and the market does not look prepared for sideways movement yet. Pressure remains pointed downward, and the structure suggests more work is needed before stability appears.
Aster Price Structure Shows Weak Bounces And Limited Buyer Control
Aster price action over recent days shows a pattern of lower highs and shallow rebounds. Each attempt to lift has faced selling pressure quickly, which keeps the structure tilted in favor of sellers. Support at $0.60 matters because repeated tests weaken confidence, especially when rebounds struggle to travel far.
The broader chart shows that previous rallies failed to establish higher ground. That behavior often signals that buyers are defensive rather than aggressive. Price holding this zone may delay further losses, yet the lack of strong follow through keeps downside risks active. Aster price still trades within a declining channel, and that context shapes expectations over the short term.
ASTER Price Trades Below 50 Day SMA As RSI Leaves Room Lower
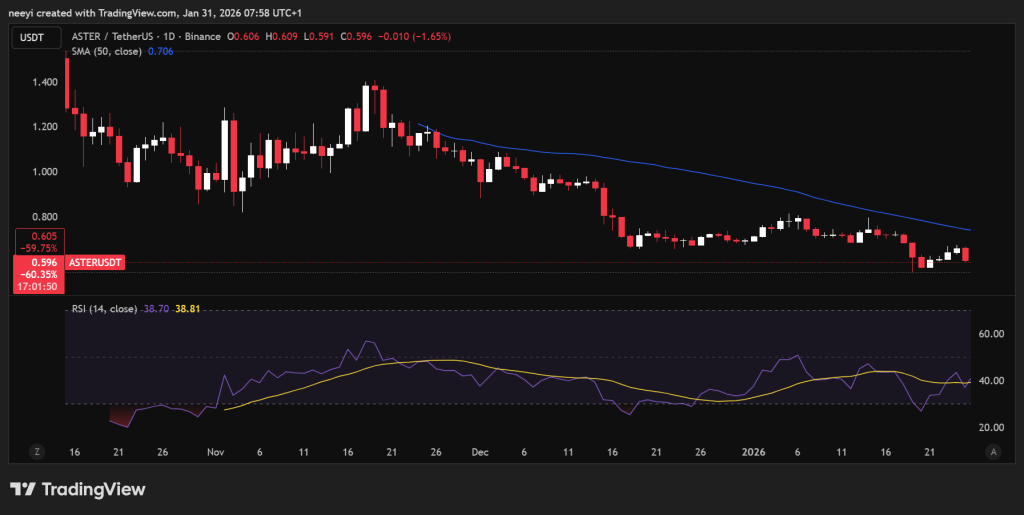
ASTER price also remains below the 50 day simple moving average on the daily chart. That moving average slopes downward and acts as a short term trend guide. Trading below it usually signals that price has not regained control from sellers. A reversal attempt typically needs price to reclaim this level with conviction, which has not happened yet.
ASTER Price Chart
Momentum indicators echo the same message. The RSI sits near 38, which places it below the neutral zone. That reading shows weakness without reaching deeply oversold conditions. Space still exists for the indicator to move lower if selling pressure increases. The chart suggests that momentum has not fully reset, which reduces the odds of an immediate recovery.
Zcash (ZEC) Price Prediction: More Downside Coming_**
Aster price now faces a clear test. Holding $0.60 could slow the decline, yet failure may invite another push lower before any meaningful consolidation appears.
Disclaimer: The information on this page may come from third parties and does not represent the views or opinions of Gate. The content displayed on this page is for reference only and does not constitute any financial, investment, or legal advice. Gate does not guarantee the accuracy or completeness of the information and shall not be liable for any losses arising from the use of this information. Virtual asset investments carry high risks and are subject to significant price volatility. You may lose all of your invested principal. Please fully understand the relevant risks and make prudent decisions based on your own financial situation and risk tolerance. For details, please refer to
Disclaimer.
Related Articles
Geopolitical Turmoil! Dalio Declares "Gold is the Only True God," but Its Safe-Haven Performance Trails Bitcoin
As geopolitical tensions in the Middle East escalate, Bridgewater founder Ray Dalio questions Bitcoin and reaffirms gold as the preferred safe haven. Nevertheless, gold prices fell accordingly, while Bitcoin only experienced a slight correction, indicating that the correlation between the two is weakening. Dalio doubts Bitcoin's transparency and future risks, but he still maintains a small allocation of Bitcoin for diversification.
区块客12m ago
Interest in altcoins cools down: Can Ethereum trigger a new altcoin season?
The market is forcing investors to bring risk management back to the center.
From a technical perspective, the inflow of funds over the past week has driven
TapChiBitcoin14m ago
Aster Price Nears $0.79 Breakout as Reversal Pattern Strengthens
Key Insights
Aster price structure shows an inverse head and shoulders pattern forming beneath $0.79 resistance, signaling growing buying pressure and possible trend reversal ahead.
Repeated tests of the $0.79 neckline suggest weakening selling pressure as buyers steadily absorb supply
CryptoFrontNews2h ago
The HYPE price could surge despite the upcoming $2.8 million short squeeze.
The recent price movements of Hyperliquid (HYPE) are characterized by stagnation around 30 USD. A symmetrical triangle pattern indicates potential for a breakout in either direction, but market sentiment is cautious. Short squeeze risks may boost prices, while weak market flow and deteriorating demand pose challenges. The token could face significant support levels if it dips below 30 USD. An improved market sentiment could lead to a breakout above 33 USD, sparking recovery momentum.
TapChiBitcoin3h ago
Ethereum Price Holds Key Support: Is $2,200 the Next Test for ETH?
March 6, 2026 7:15 pm EST
TheCoinRepublic5h ago
Cardano Price Trends: Bulls Eye Opportunity as Indicator Flashes Green
ADA: Trading near $0.27, facing resistance at $0.28 and support at $0.26.
Technical Indicators: RSI and MACD show weak momentum, signaling short-term consolidation and cautious trading.
Macro Outlook: Rising PMI and historical patterns suggest potential bullish rebound if resistance
CryptoNewsLand5h ago