
Key Takeaways
-
Hyperliquid (HYPE) surged over 8%, reclaiming the $23.30 level amid rising market interest.
-
DefiLlama data shows Hyperliquid leading perpetual futures volume over the last 30 days, topping $160 billion.
-
Strong derivatives activity suggests sustained trader demand and growing ecosystem traction.
-
The daily chart highlights a Bearish Shark harmonic pattern, allowing room for short-term upside.
Hyperliquid’s native token, HYPE, is back in the spotlight today after posting a 8%+ price jump, pushing above the $23.30 level. While the price move itself has caught traders’ attention, a deeper look at on-chain metrics and the daily chart suggests there may be more developing beneath the surface.
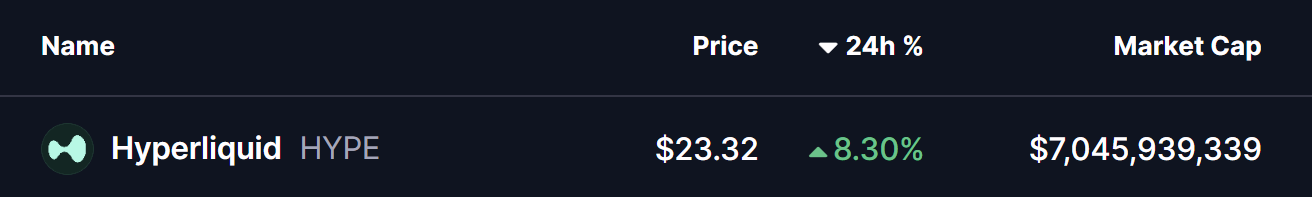
Source: Coinmarketcap
Hyperliquid (HYPE) Leads Perp Volume
According to DefiLlama data, **Hyperliquid **has emerged as the **top perpetual futures **platform by trading volume over the last 30 days, significantly outperforming its closest competitors. The protocol recorded approximately $160.4 billion in perpetual volume, comfortably ahead of Aster and Lighter, which logged around $124.7 billion and $112.5 billion, respectively.
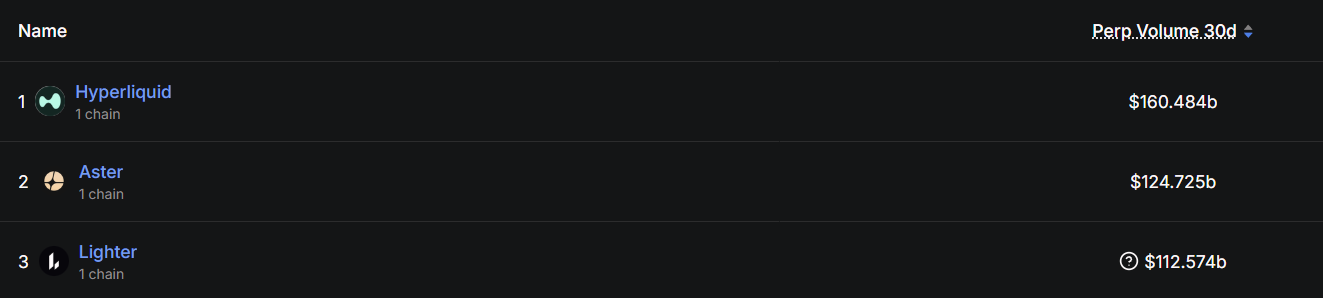
Source: Defillama
This surge in activity highlights growing trader preference for Hyperliquid’s ecosystem, signaling strong demand, deep liquidity, and sustained engagement. Historically, rising derivatives volume often acts as a leading indicator for increased interest in a project’s native token — something that appears to be playing out in HYPE’s recent price action.
Is More Upside Ahead?
From a technical perspective, HYPE’s daily chart reveals the development of a Bearish Shark harmonic pattern, a well-known formation in technical analysis. While this pattern ultimately suggests a potential reversal once fully completed, it often allows for short-term bullish continuation as price moves toward the “C” point.
Following the completion of the O-X-A-B structure, HYPE is currently trading around $23.26, holding above its recent lows. The next key challenge for bulls lies at the 50-day moving average near $25.72, which has acted as a dynamic resistance zone.
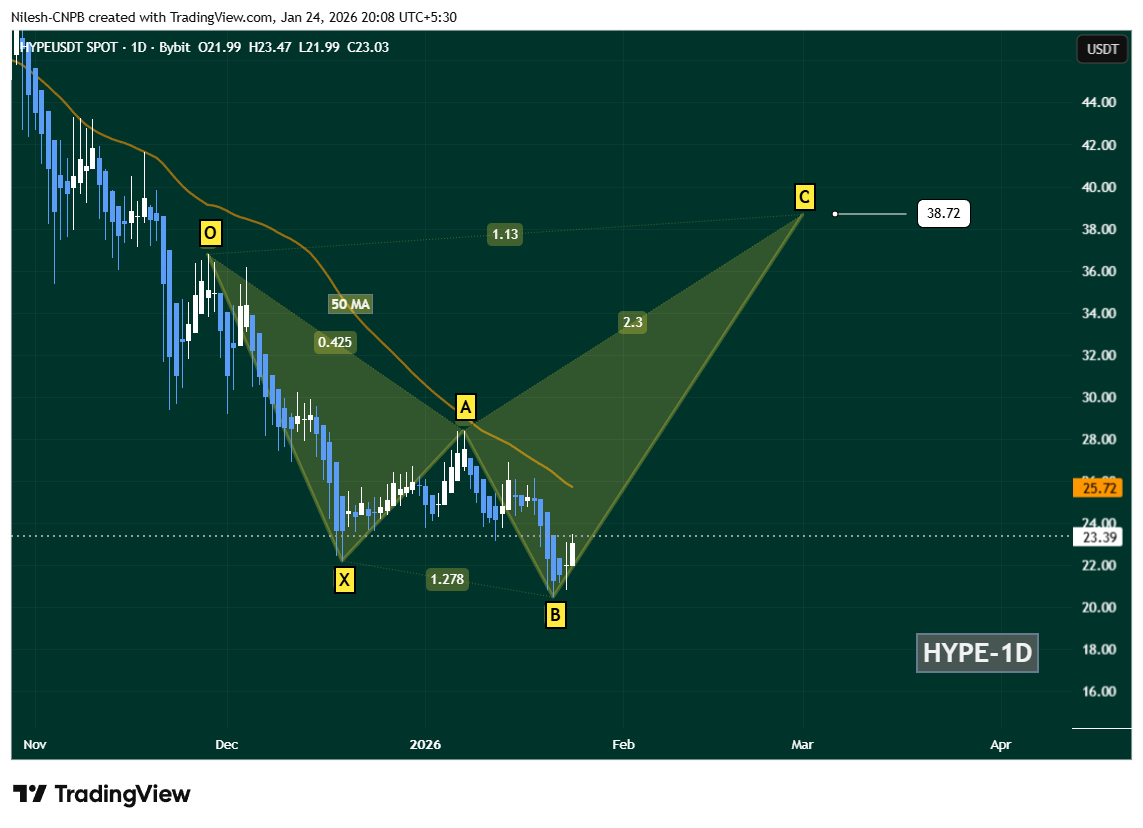
Hyperliquid (HYPE) Daily Chart/Coinsprobe (Source: Tradingview)
A decisive daily close above the 50-day MA ($25.72) would strengthen the recovery narrative and could open the door for a broader upside move. If momentum continues to build, the chart projects a potential advance toward the C-point near $38.72, aligning with the Shark pattern’s 1.13 Fibonacci extension.
However, downside risks remain. A failure to hold the B-point support zone would invalidate the bullish continuation setup and could expose HYPE to extended consolidation or further downside pressure in the near term.
Bottom Line
HYPE’s price rebound is being backed by strong on-chain fundamentals, with Hyperliquid clearly dominating the perpetual trading landscape. While the broader harmonic structure suggests caution in the longer term, short-term technicals still favor a recovery move as long as key support levels remain intact. All eyes now remain on the $25.72 reclaim, which could act as the trigger for the next leg higher.
Disclaimer: The views and analysis presented in this article are for informational purposes only and reflect the author’s perspective, not financial advice. Technical patterns and indicators discussed are subject to market volatility and may or may not yield the anticipated results. Investors are advised to exercise caution, conduct independent research, and make decisions aligned with their individual risk tolerance.
About Author: Nilesh Hembade is the Founder and Lead Author of Coinsprobe, with over 5 years of experience in the cryptocurrency and blockchain industry. Since launching Coinsprobe in 2023, he has been providing daily, research-driven insights through in-depth market analysis, on-chain data, and technical research.
Disclaimer: The information on this page may come from third parties and does not represent the views or opinions of Gate. The content displayed on this page is for reference only and does not constitute any financial, investment, or legal advice. Gate does not guarantee the accuracy or completeness of the information and shall not be liable for any losses arising from the use of this information. Virtual asset investments carry high risks and are subject to significant price volatility. You may lose all of your invested principal. Please fully understand the relevant risks and make prudent decisions based on your own financial situation and risk tolerance. For details, please refer to
Disclaimer.
Related Articles
HBAR at a Crossroads: Will $0.095 Support Trigger a Break Toward $0.106?
HBAR is trading at $0.09739 and above the S/R flip of $0.094-$0.096 in the 12H chart.
The nearest resistance will be at $0.10 with a falling trendline pressure at around $0.104-$0.106.
The support is at $0.095835 and a breakdown at the
CryptoNewsLand24m ago
PEPE Hovers at Critical $0.053414 Support as $432M Volume Surge Tightens Breakout Watch
PEPE is trading at $0.053416, just above support at $0.053414, with significant trading volume up 22.14%. Resistance is at $0.053676. Despite a slight decrease in price, there’s increased market activity, suggesting potential volatility.
CryptoNewsLand29m ago
Builders Are Walking Away From Aave – What Does It Mean for AAVE Price?
Aave (AAVE) is dealing with two very different headlines at the same time. On one side, the protocol faced a $24 million exploit linked to address poisoning, once again reminding users that security risks still exist across DeFi.
Despite that incident, the market reaction has been somewhat
CaptainAltcoin1h ago
AVAX Tests $9.38 Resistance After 8.3% Surge — Breakout or Pullback Ahead?
AVAX is also trading at $9.16 with a daily gain of 8.3 per cent, but still below $9.38 resistance.
Strong buyer activity near $8.46 continues to prevent deeper downside extensions.
A daily close above $9.38 could open room toward $9.50, while rejection risks $8.30.
Avalanche’s
CryptoNewsLand1h ago
Dogecoin Prints Monthly Morning Doji Star — Will $0.097 Break Next?
Dogecoin is forming a "Morning Doji Star" pattern on the monthly chart around $0.09, indicating a potential bullish reversal despite a recent 1.9% daily decline. Key support is at $0.09036 and resistance at $0.09707, with current trading at $0.09010.
CryptoNewsLand1h ago
Here’s the XRP Price If Banks Start Treating Ripple as the Ultimate “Integration Play”
Ripple’s XRP price moved up a bit today, but the overall picture still feels uncertain. The token dropped heavily over the past few months, and many traders are still careful.
Online discussions show mixed feelings. Some think the recent drop may have formed a short-term bottom. However, many
CaptainAltcoin1h ago

