
Key Takeaways
-
Monad (MON) has dropped nearly 41% over the past two months but is showing early signs of stabilization.
-
Price action suggests a potential double bottom pattern forming near the $0.018 support zone.
-
Buyers have repeatedly defended the same support level, hinting at fading selling pressure.
-
A move above the 50-day moving average could strengthen the short-term bullish outlook.
-
A confirmed breakout above the $0.02970 neckline may open the door for a stronger recovery rally.
Monad (MON), the native token of the Monad Layer-1 blockchain, has been under pressure in recent weeks. The token is down roughly 41% over the past 60 days, driven by a slowdown in TVL growth and a decline in application-level revenue across the ecosystem.
However, sentiment may be starting to shift. MON posted a 12% bounce today, and more importantly, its price structure on the daily chart is beginning to show early signs of a bullish reversal — suggesting the downside momentum could be losing steam.
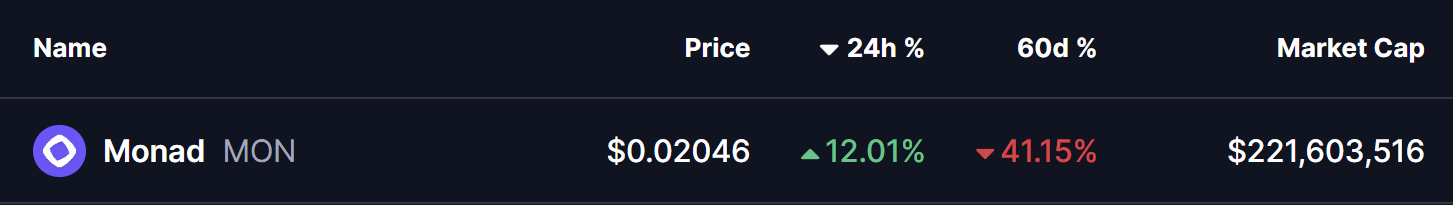
Source: Coinmarketcap
Double Bottom Pattern in Play
On the daily timeframe, MON appears to be forming a potential double bottom pattern, a classic bullish reversal structure that often develops near the end of extended downtrends.
The first bottom was formed when MON dropped toward the $0.018 support zone, followed by a rebound that carried price back toward the neckline resistance near $0.02970. That recovery attempt was rejected, sending MON back down to retest the same support level.
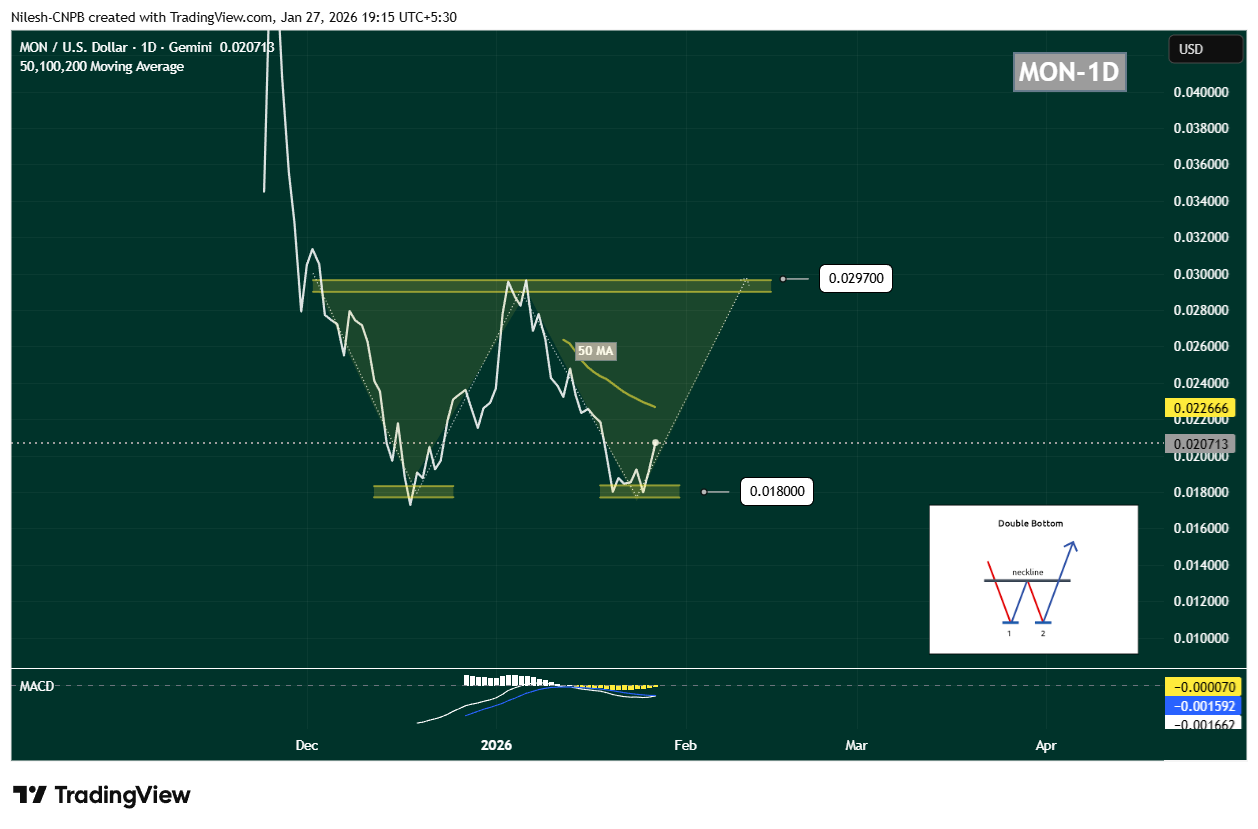
Monad (MON) Daily Chart/Coinsprobe (Source: Tradingview)
What’s notable this time is buyer behavior. Once again, demand emerged around $0.018, preventing a breakdown and forming the second bottom of the structure. MON is currently trading near $0.02071, indicating that selling pressure may be fading.
Momentum indicators are starting to support this view. The MACD is showing early signs of a potential bullish crossover, often seen as an initial signal that downside momentum is weakening and buyers may be preparing to step back in.
What’s Next for Monad (MON)?
For this bullish setup to gain credibility, MON needs to reclaim the 50-day moving average, which is currently positioned near $0.02266. A sustained move above this level would signal a shift in short-term momentum and improve the probability of a recovery rally.
If buyers manage to push price back toward the $0.02970 neckline, the market will be watching closely. A decisive breakout above this resistance, ideally followed by a successful retest, would confirm the double bottom pattern and open the door for a stronger upside move.
On the downside, the $0.018 support zone remains the most critical level to defend. A breakdown below this area would invalidate the bullish structure and likely expose MON to another leg of downside or extended consolidation.
Bottom Line
Despite recent weakness, MON’s technical structure is starting to look constructive. The repeated defense of identical lows, the emergence of a double bottom pattern, and improving momentum signals suggest that Monad could be approaching a potential turning point.
If key support continues to hold and the token reclaims its short-term moving averages, MON may be setting the stage for a recovery phase — especially if broader market conditions stabilize in the days ahead.
Disclaimer: The views and analysis presented in this article are for informational purposes only and reflect the author’s perspective, not financial advice. Technical patterns and indicators discussed are subject to market volatility and may or may not yield the anticipated results. Investors are advised to exercise caution, conduct independent research, and make decisions aligned with their individual risk tolerance.
About Author: Nilesh Hembade is the Founder and Lead Author of Coinsprobe, with over 5 years of experience in the cryptocurrency and blockchain industry. Since launching Coinsprobe in 2023, he has been providing daily, research-driven insights through in-depth market analysis, on-chain data, and technical research.
Disclaimer: The information on this page may come from third parties and does not represent the views or opinions of Gate. The content displayed on this page is for reference only and does not constitute any financial, investment, or legal advice. Gate does not guarantee the accuracy or completeness of the information and shall not be liable for any losses arising from the use of this information. Virtual asset investments carry high risks and are subject to significant price volatility. You may lose all of your invested principal. Please fully understand the relevant risks and make prudent decisions based on your own financial situation and risk tolerance. For details, please refer to
Disclaimer.
Related Articles
Global Conflict Sparks $2B Crypto Market Sell-off
Around a week has passed since the war between the United States and Israel against Iran, and this man-made disaster has made severe dents in the markets worldwide
Following this international tension, the oil, natural gas, currency, and cryptocurrency markets faced major losses, with some
TodayqNews3m ago
Bitcoin Hits Most Oversold Level in 11 Years, Sentiments Shift Drastically as BTC Price Swings
Bitcoin hits most oversold level in 11 years.
Sentiments shift drastically as BTC price swings.
Bitcoin value surged to above $70,000 and then below in a matter of days.
Sentiments for the crypto market to recover and see BTC surge to higher targets were high yesterday as BTC
CryptoNewsLand26m ago
Raoul Pal: Global liquidity and BTC correlation reach 90%, and the market is in a historically oversold state
Raoul Pal stated on March 8th that global liquidity is a key macro factor, highly correlated with BTC and NDX since 2012, with an annual growth of about 10%. He pointed out that liquidity remains loose and predicted that the US will further cut interest rates to stimulate disposable income. The crypto market is currently oversold, and the next two weeks will be a critical period to watch.
GateNews1h ago
Woo on BTC Price: 'Bull Trap Incoming' - U.Today
Willy Woo warns investors against short-term optimism in Bitcoin's price, indicating a potential bear trap despite possible relief rallies. He emphasizes that the market remains in a bearish phase and that the current conditions do not signify a market bottom.
UToday2h ago
After a 15% drop from the weekly high, is Ethena facing the risk of a deeper decline?
Ethena (ENA) experienced a brief surge to $0.12, driven by optimistic sentiment and increased trading volume. However, it has since dropped about 15%, revealing long-term bearish trends. Resistance levels suggest potential further declines towards $0.085.
TapChiBitcoin2h ago
Dogecoin Price Jumps as Derivatives Demand Signals Breakout
Key Insights
Dogecoin surged to a weekly high of $0.103 as improving market sentiment and strong derivatives demand encouraged traders to position for further gains.
Futures data from CoinGlass showed a positive funding rate, indicating long traders are paying premiums while positioning for
CryptoFrontNews3h ago