
Kaspa has been under heavy pressure, and price action over the past few days has pushed sentiment into extreme fear. That’s the backdrop for a bold statement from Travladd Crypto, who said that if KAS drops below $0.03, he plans to deploy $100,000 in one shot. His message was simple and emotional, but it carried a deeper point: if Kaspa fails at that level, then fundamentals may no longer matter in crypto at all.
The tweet landed at a moment when confidence across the market is thin. Kaspa has already sold off hard from the mid-$0.04 range, and price briefly dipped close to the level Travladd highlighted. This is no longer a calm pullback. It is a stress test.
Travladd’s comment is about conviction under pressure. He framed $0.03 as a line in the sand where fear peaks and patience disappears. His view is that Kaspa’s technology and network design should be enough to survive this phase. If price breaks down anyway, then the market may be proving that narratives and leverage matter more than substance.
That is why the tweet resonated. It reflects a wider frustration across crypto. Strong projects are getting dragged lower alongside everything else. For some traders, that creates hesitation. For others, it creates a moment to act.
- Kaspa Chart Breakdown: Where Price Stands Now
- Momentum Indicators: Early Signs of Relief
- Kaspa Price Outlook
Kaspa Chart Breakdown: Where Price Stands Now
The Kaspa price is trading just above $0.033, bouncing after a sharp selloff that briefly pushed price close to $0.03. This area now stands out as the most important support on the chart.
Support zones
- $0.030–$0.031: Major psychological and structural support. A clean break below this area would likely trigger another wave of stops.
- $0.026–$0.028: Next downside zone if $0.03 fails. This area lines up with the long wick from the recent flush.
Resistance zones
- $0.036–$0.037: First resistance where price was rejected during the breakdown.
- $0.040–$0.042: Strong supply zone. A reclaim would signal that sellers are losing control.
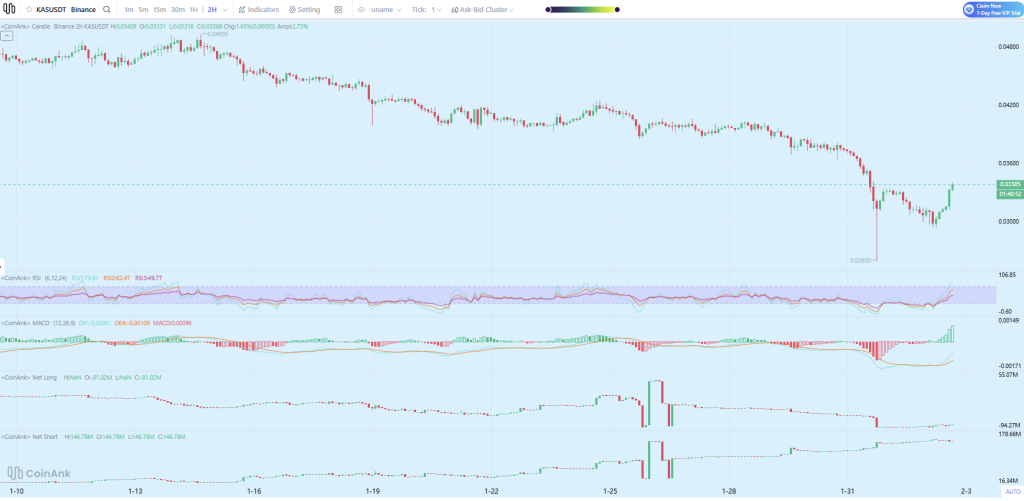
Source: CoinAnk
Right now, price is in recovery mode, but still well below prior structure.
Momentum Indicators: Early Signs of Relief
The RSI dipped into oversold territory during the selloff and has started to turn up. That points to short-term exhaustion from sellers, not a confirmed trend change. RSI still has room to move before hitting overheated levels.
The MACD shows a bullish curl forming after deep negative momentum. Histogram bars are shrinking, which hints that downside pressure is slowing. This often shows up during relief bounces, though confirmation needs follow-through.
Net positioning data shows short exposure dominating. Shorts increased aggressively during the breakdown, which helped push price lower. Over the last sessions, that pressure has stopped accelerating. This matters.
If price holds above $0.03 and pushes into resistance, short covering could fuel a sharp bounce. If support fails, those same shorts stay comfortable and downside opens fast.
Read also: Kaspa (KAS) vs BNB: This Comparison Makes BNB Look Uncomfortable
Kaspa Price Outlook
Kaspa is sitting at a crossroads.
If $0.03 holds, a rebound toward $0.036–$0.040 becomes likely. That move would fit a classic relief rally after forced selling.
If $0.03 breaks, downside could extend toward $0.028 and possibly $0.026 before buyers step in again. That scenario would fully test the conviction Travladd talked about.
For now, the market has paused just above the level that matters most. The next few sessions will decide whether this bounce grows into something larger or fades into another leg down.
Kaspa is no longer trading in a comfortable zone. It is trading where beliefs get tested.
Disclaimer: The information on this page may come from third parties and does not represent the views or opinions of Gate. The content displayed on this page is for reference only and does not constitute any financial, investment, or legal advice. Gate does not guarantee the accuracy or completeness of the information and shall not be liable for any losses arising from the use of this information. Virtual asset investments carry high risks and are subject to significant price volatility. You may lose all of your invested principal. Please fully understand the relevant risks and make prudent decisions based on your own financial situation and risk tolerance. For details, please refer to
Disclaimer.
Related Articles
Why did Bitcoin drop today? The US warns of a ground invasion in Iran, and Trump demands to lead the next Supreme Leader.
Bitcoin prices fluctuate due to escalating geopolitical tensions, dropping from $72,000 to $70,000 on March 6. Trump's tough rhetoric on the Iran situation, Iran's refusal to cease fire, and the U.S. military announcing increased strikes have heightened risk aversion. Market sentiment is divided, with some predicting Bitcoin will reach $80,000, but some analysts remain skeptical about a rebound. $72,000 is a key technical level; failure to break above it could lead to a drop toward $64,000.
MarketWhisper2m ago
Today, the Fear and Greed Index dropped to 18, indicating the market is in a "Extreme Fear" state.
Foresight News reports that, according to Alternative.me data, the cryptocurrency Fear and Greed Index dropped to 18 today (yesterday the index was 22, indicating "Extreme Fear"), indicating that the market is in a "Extreme Fear" state.
GateNews24m ago
XRP Price Consolidates Under $1.5 — What Could Drive the Next Move to $2? - BTC Hunts
XRP is struggling to maintain its price above $1.40 amidst selling pressure and a bearish market. Key resistance at $1.48 and support at $1.33 will determine its next movement, with potential for upswing to $1.60 or a drop towards $1.20.
BTCHUNTS46m ago
Stock and bond sell-off, BTC holds the 70,000 level, Bitcoin outperformed gold this week
The ongoing military actions by the US and Israel against Iran continue to impact the market. Oil prices surged, causing US stocks and Bitcoin to decline, but Bitcoin's decline was smaller, and it outperformed gold this week. Disrupted energy supplies have sparked inflation concerns, leading to simultaneous declines in stocks and bonds. Investors remain optimistic about cryptocurrencies, with significant capital inflows.
ChainNewsAbmedia1h ago
Did Kaspa (KAS) Price Just Hit Its Cycle Low? Analyst Breaks Down What Could Happen Next
Kaspa (KAS) may be nearing a price bottom as it approaches key technical indicators like Fibonacci levels and a long-term trendline. Analysts suggest the cryptocurrency could stabilize around $0.24, potentially paving the way for a future upward move towards $1, contingent on market conditions.
CaptainAltcoin3h ago
Polkadot to Reset Tokenomics on March 12 With Major DOT Supply and Staking Changes
Polkadot will introduce a new monetary framework on March 12 that sets DOT’s supply cap at 2.1 billion and lowers emissions by 53.6%.
The overhaul will also create a Dynamic Allocation Pool and shorten the DOT unbonding period from 28 days to 24–48 hours.
On March 12, Polkadot will reset
CryptoNewsFlash4h ago

