
Key Takeaways
-
ASTER rebounds strongly, gaining nearly 10% as the broader crypto market recovers, with price holding above key support near $0.55.
-
Harmonic structure remains bullish in the short term, with the Bearish Shark pattern allowing upside continuation toward resistance.
-
A breakout above $0.687 (50-day MA) could open the path toward the $0.828 target, while failure to hold support may invalidate the setup.
The broader cryptocurrency market is showing signs of relief today after a sharp sell-off earlier this week. Bitcoin (BTC) briefly dipped to the $74,000 region before staging a rebound above $78,000, gaining nearly 3% on the day. Ethereum (ETH) has also followed suit, climbing around 4.4% in the past 24 hours.
Amid this recovery, several altcoins have turned green, including the decentralized exchange (DEX) token Aster (ASTER). The token has surged over 8%, trimming its monthly losses to around 21%. More importantly, ASTER’s price action is now flashing a familiar technical setup that hints at further upside potential.
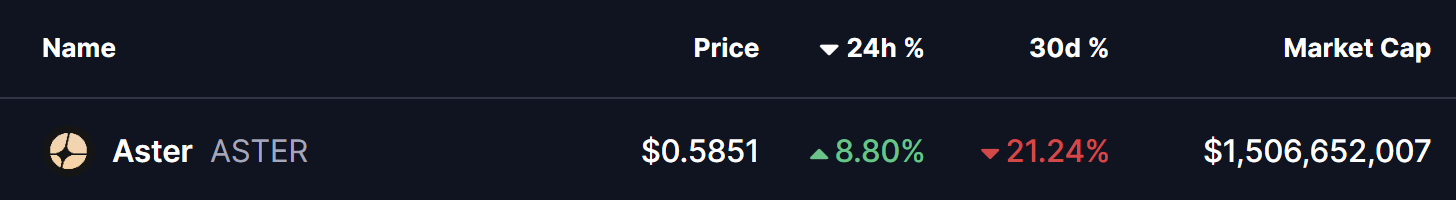
Source: Coinmarketcap
Technical Patterns Hint at Upside Momentum
From a technical perspective, ASTER’s daily chart reveals the formation of a Bearish Shark harmonic pattern, a widely tracked structure in harmonic trading. While the pattern is traditionally associated with a possible reversal once fully completed, it often allows for short-term bullish continuation as price advances toward the C-point.
As seen on the chart, the O-X-A-B structure has already been completed, with price finding support near the B-point around the $0.55 region. ASTER is currently trading near $0.584, showing early signs of stabilization after the recent sell-off.
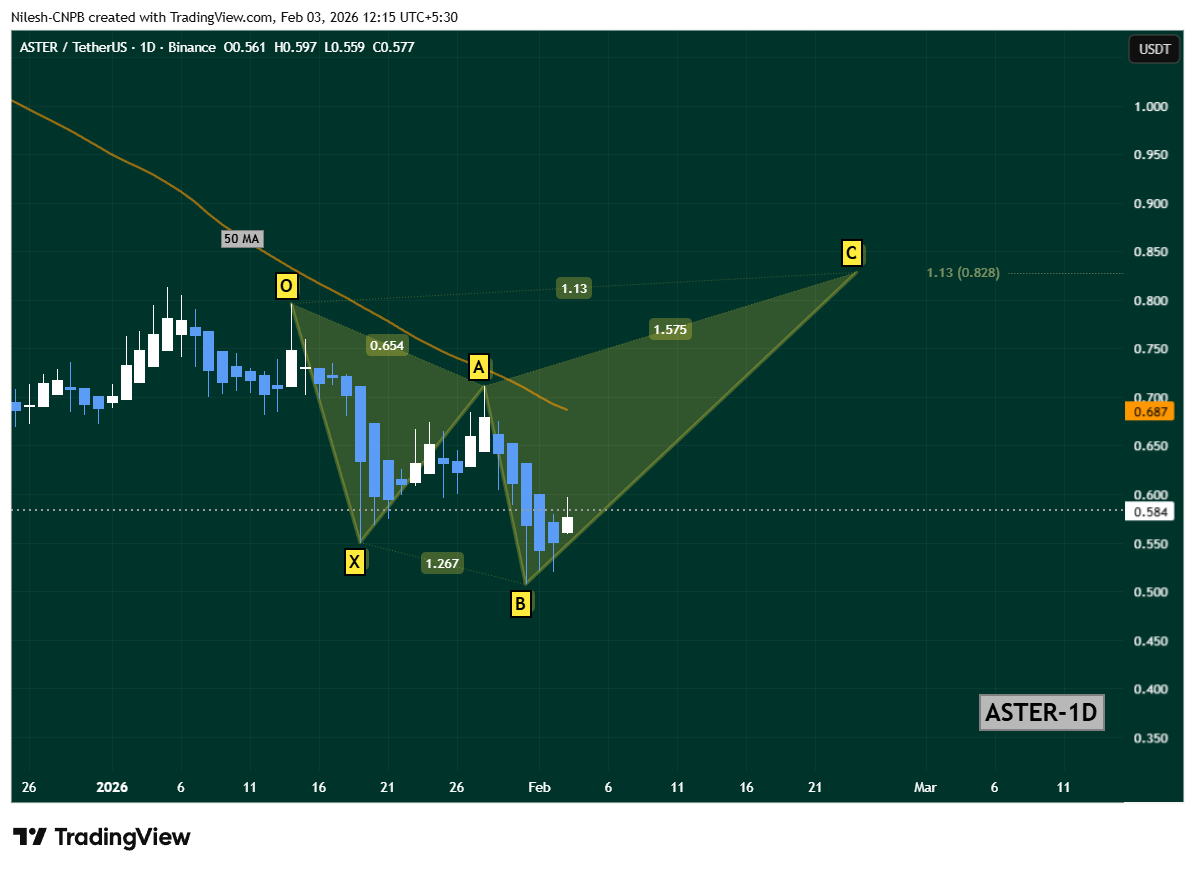
Aster (ASTER) Daily Chart/Coinsprobe (Source: Tradingview
The immediate hurdle for bulls remains the 50-day moving average, positioned around $0.687. This level has acted as a dynamic resistance in recent weeks, capping upside attempts and triggering pullbacks.
What’s Next for ASTER?
A decisive daily close above the 50-day MA ($0.687) would be a key technical signal, strengthening the short-term recovery narrative. Such a breakout could attract fresh momentum buyers and set the stage for a broader upside move.
If bullish momentum sustains, the harmonic projection points toward the C-point near $0.828, which aligns with the 1.13 Fibonacci extension of the Shark pattern. This level represents a potential upside target in the coming sessions, provided overall market sentiment remains supportive.
Despite the improving technical picture, downside risks have not disappeared. A failure to hold the B-point support zone could invalidate the bullish continuation scenario. In that case, ASTER may enter a period of extended consolidation or face renewed downside pressure before any meaningful recovery attempt.
Disclaimer: The views and analysis presented in this article are for informational purposes only and reflect the author’s perspective, not financial advice. Technical patterns and indicators discussed are subject to market volatility and may or may not yield the anticipated results. Investors are advised to exercise caution, conduct independent research, and make decisions aligned with their individual risk tolerance.
About Author: Nilesh Hembade is the Founder and Lead Author of Coinsprobe, with over 5 years of experience in the cryptocurrency and blockchain industry. Since launching Coinsprobe in 2023, he has been providing daily, research-driven insights through in-depth market analysis, on-chain data, and technical research.
Disclaimer: The information on this page may come from third parties and does not represent the views or opinions of Gate. The content displayed on this page is for reference only and does not constitute any financial, investment, or legal advice. Gate does not guarantee the accuracy or completeness of the information and shall not be liable for any losses arising from the use of this information. Virtual asset investments carry high risks and are subject to significant price volatility. You may lose all of your invested principal. Please fully understand the relevant risks and make prudent decisions based on your own financial situation and risk tolerance. For details, please refer to
Disclaimer.
Related Articles
Crypto Market Plunges As Extreme Fear Controls Investor Sentiment
The global crypto market is notably bearish, with a 2.93% drop in market capitalization to $2.32T. Bitcoin and Ethereum saw decreases of 3.07% and 4.01%, respectively. Meanwhile, notable gainers include $XBTC, $TRUMP, and $PEPE. DeFi TVL and NFT sales also declined significantly, while key investments from YZi Labs and Kazakhstan's central bank emerged.
BlockChainReporter1m ago
HBAR at a Crossroads: Will $0.095 Support Trigger a Break Toward $0.106?
HBAR is trading at $0.09739 and above the S/R flip of $0.094-$0.096 in the 12H chart.
The nearest resistance will be at $0.10 with a falling trendline pressure at around $0.104-$0.106.
The support is at $0.095835 and a breakdown at the
CryptoNewsLand22m ago
DXY Retest at 99.183: Will 100–101 Break as US Degen Index Stabilizes?
DXY trades at 99.183 while retesting the 100–101 monthly resistance zone.
US Degen Index 6900 sits at $0.0001197 with support at $0.0001175 and resistance at $0.0001214.
A break above 101 on DXY would shift structure higher, while rejection keeps price below key resistance.
The U.
CryptoNewsLand25m ago
PEPE Hovers at Critical $0.053414 Support as $432M Volume Surge Tightens Breakout Watch
PEPE is trading at $0.053416, just above support at $0.053414, with significant trading volume up 22.14%. Resistance is at $0.053676. Despite a slight decrease in price, there’s increased market activity, suggesting potential volatility.
CryptoNewsLand28m ago
Expert Claims Altcoin Metrics Are Being 'Gamed' to Mislead Investors
Crypto researcher Orbion raises concerns over the possible manipulation of key market indicators, including the Altseason Index and Crypto Fear and Greed Index, suggesting that inflated metrics create false optimism and mislead investors about the onset of altcoin season.
Coinpedia1h ago
XRP Holds $1.34 Support as $1.80–$2.00 Becomes 2025 Make-or-Break Zone
XRP is trading at $1.37 and its trading higher than the support of $1.34 but facing a heavy resistance at $1.38.
The critical structural pivot zone of $1.80-2.00 is the critical 2025 structural pivot.
March structure has the targets of $2.78 and 3.60, with anticipated
CryptoNewsLand1h ago