Key Takeaways
-
AAVE has dropped nearly 23% in 30 days, but price is now holding a major long-term support zone between $113–$129.
-
The weekly chart shows a potential double bottom pattern, signaling a possible trend reversal if support continues to hold.
-
A reclaim of the 100-week moving average near $137.8 could strengthen bullish momentum and open the path toward $378–$400 resistance.
The broader altcoin market has come under heavy selling pressure over the past few days, with sentiment deteriorating rapidly across major assets. Ethereum (ETH) has plunged more than 28%, setting the tone for the wider market. Unsurprisingly, Aave ($AAVE) hasn’t been spared, shedding nearly 23% over the past 30 days.
While short-term sentiment remains fragile, a closer look at AAVE’s weekly chart suggests price has now reached a technically important area — one that could serve as a foundation for a potential bounce if buyers continue to step in.
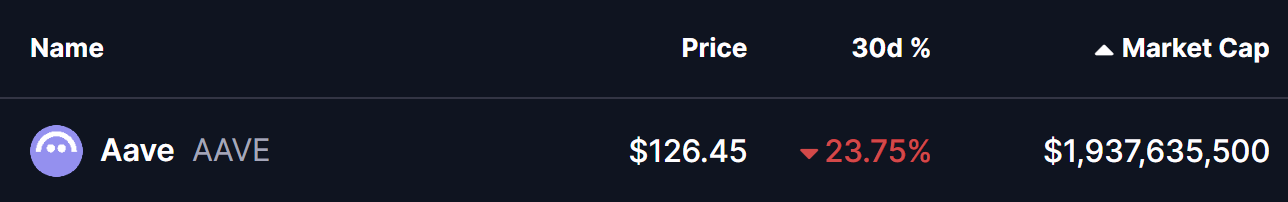
Source: Coinmarketcap
Double Bottom Pattern in Play?
On the weekly timeframe, AAVE appears to be forming a potential double bottom pattern, a classic bullish reversal structure that often develops near the end of prolonged downtrends.
The first bottom formed when AAVE dropped into the $113–$129 support zone, followed by a strong recovery attempt that pushed price toward the neckline resistance between $378 and $400. That rally ultimately faced rejection, but the latest sell-off has brought AAVE right back into the same support region.
What stands out this time is the buyer response. Price has once again stabilized within the $113–$129 zone, suggesting that bulls are actively defending this area and are not yet ready to give up control. The repeated defense of identical lows strengthens the case for this zone acting as a major accumulation region.
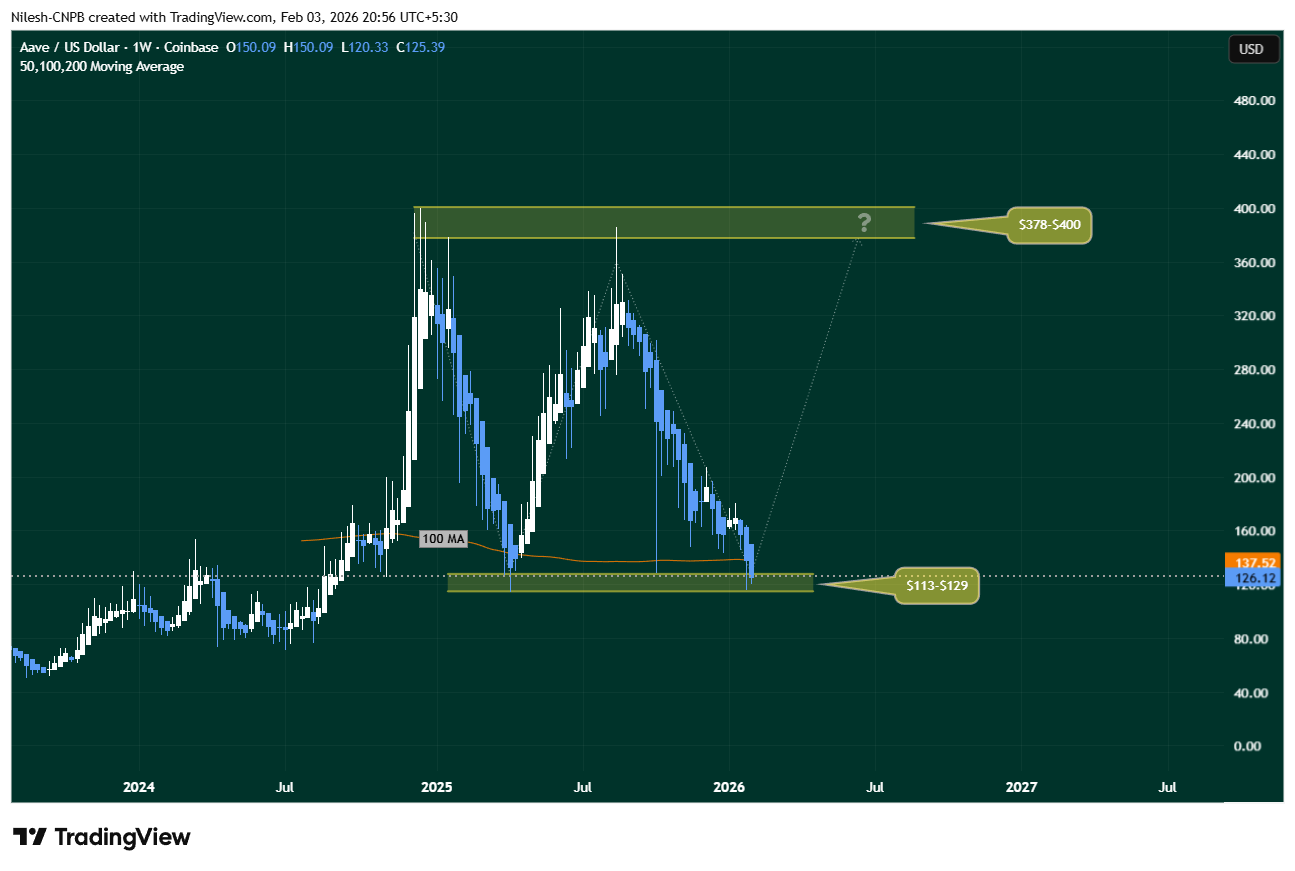
Aave ($AAVE) Weekly Chart/Coinsprobe (Source: Tradingview)
As long as AAVE continues to hold above this level, the broader double bottom structure remains technically valid.
What’s Next for AAVE?
For the bullish setup to gain traction, AAVE must hold the $113–$129 support zone and reclaim the 100-week moving average, currently sitting near $137.52. A sustained move above this level would signal improving momentum and mark an important shift in market structure.
If buyers manage to push price higher from here, the next major upside objective would be the neckline resistance at $378–$400. While that target may appear distant, a successful double bottom confirmation often leads to sharp recovery moves — especially if broader market conditions stabilize.
On the downside, the $113–$129 region remains the line in the sand. A decisive breakdown below this zone would invalidate the bullish setup and open the door to deeper downside risk.
Final Outlook
Despite recent weakness, AAVE’s technical structure remains constructive. The repeated defense of key support, the developing double bottom formation, and price hovering near the 100-week moving average suggest the token may be approaching a pivotal inflection point.
If accumulation continues and broader crypto sentiment improves, AAVE could be setting the stage for a meaningful recovery phase. Until then, all eyes remain on how price behaves around this critical support zone.
Disclaimer: The views and analysis presented in this article are for informational purposes only and reflect the author’s perspective, not financial advice. Technical patterns and indicators discussed are subject to market volatility and may or may not yield the anticipated results. Investors are advised to exercise caution, conduct independent research, and make decisions aligned with their individual risk tolerance.
About Author: Nilesh Hembade is the Founder and Lead Author of Coinsprobe, with over 5 years of experience in the cryptocurrency and blockchain industry. Since launching Coinsprobe in 2023, he has been providing daily, research-driven insights through in-depth market analysis, on-chain data, and technical research.
Disclaimer: The information on this page may come from third parties and does not represent the views or opinions of Gate. The content displayed on this page is for reference only and does not constitute any financial, investment, or legal advice. Gate does not guarantee the accuracy or completeness of the information and shall not be liable for any losses arising from the use of this information. Virtual asset investments carry high risks and are subject to significant price volatility. You may lose all of your invested principal. Please fully understand the relevant risks and make prudent decisions based on your own financial situation and risk tolerance. For details, please refer to
Disclaimer.
Related Articles
BTC surged to $74,000 before falling back below $69,000, with the total market capitalization evaporating approximately $110 billion.
This week, the cryptocurrency industry received positive news from Wall Street, but Bitcoin's price fell from $74,000 to $69,000, with a market cap evaporating approximately $110 billion. The strength of the US dollar and macroeconomic factors are putting pressure on risk assets. Short-term holders are taking profits, increasing selling pressure, but the US spot Bitcoin ETF recorded net inflows, indicating an improvement in the funding environment.
GateNews4m ago
Today, the cryptocurrency Fear & Greed Index dropped to 12, indicating the market is in extreme fear.
Gate News Report, March 7th, according to Alternative.me data, today the cryptocurrency fear and greed index dropped to 12, indicating the market is in a state of "extreme fear." Yesterday, the index was 18, also in the "extreme fear" zone.
GateNews19m ago
Kaspa Tops CoinMarketCap Community Sentiment With 90% Bullish Votes – Here’s Why
Kaspa’s price hasn’t had the best year. The coin is currently trading around $0.03, and on the yearly chart it’s still down roughly 60%. That kind of drop usually hurts sentiment in most crypto
CaptainAltcoin1h ago
Will XRP Hold $1.33 or Extend Toward $1.30 Before Rebound?
XRP is currently trading at $1.35, experiencing a 1.3% decline. Key support is at $1.34, while resistance is at $1.40. The price is testing around the Fibonacci levels of $1.33 and $1.30, crucial for potential upward movement or deeper decline.
CryptoNewsLand5h ago
Dogecoin Monthly Breakdown Pattern Reappears as Price Tests $0.0918
Dogecoin is currently trading at $0.09205 at a gain of 2.3, with support of above $0.08878.
As can be seen in the monthly chart, there are recurring breakdown areas that have been followed by significant expansions in price.
The short-term trading range is narrow and the immediate point o
CryptoNewsLand5h ago
Solana Nears $95 Resistance With $17B Volume Surge
Solana approaches a key resistance level near $95, with increased trading volume and open interest signaling active trader interest. The token is currently at $90.20, facing potential upward movement if it surpasses $95, but may test $85 if rejected.
CryptoFrontNews5h ago