Toncoin (TON) is showing clear signs of recovery as it continues to maintain its upward momentum and trades above the $1.40 level as of Wednesday. The coin has increased by approximately 4.5% over the past two days, partially regaining balance after a deep correction last week.
In the derivatives market, investor sentiment is gradually improving as the number of long positions increases, and the funding rate has turned positive. From a technical perspective, the outlook for TON’s price is beginning to show initial signs of recovery, with indicators suggesting selling pressure is weakening and the downward trend is slowing.
Derivatives Data Indicates Improving Market Sentiment
Data from CoinGlass shows that market sentiment toward Toncoin (TON) is gradually turning positive. Specifically, the long/short ratio for TON reached 1.06 on Wednesday and continued to rise, reflecting that more traders are betting on a price increase. Notably, on Binance, the long position ratio surged to 1.84 on the same day — the highest since January 7 — reinforcing expectations of a recovery for TON.
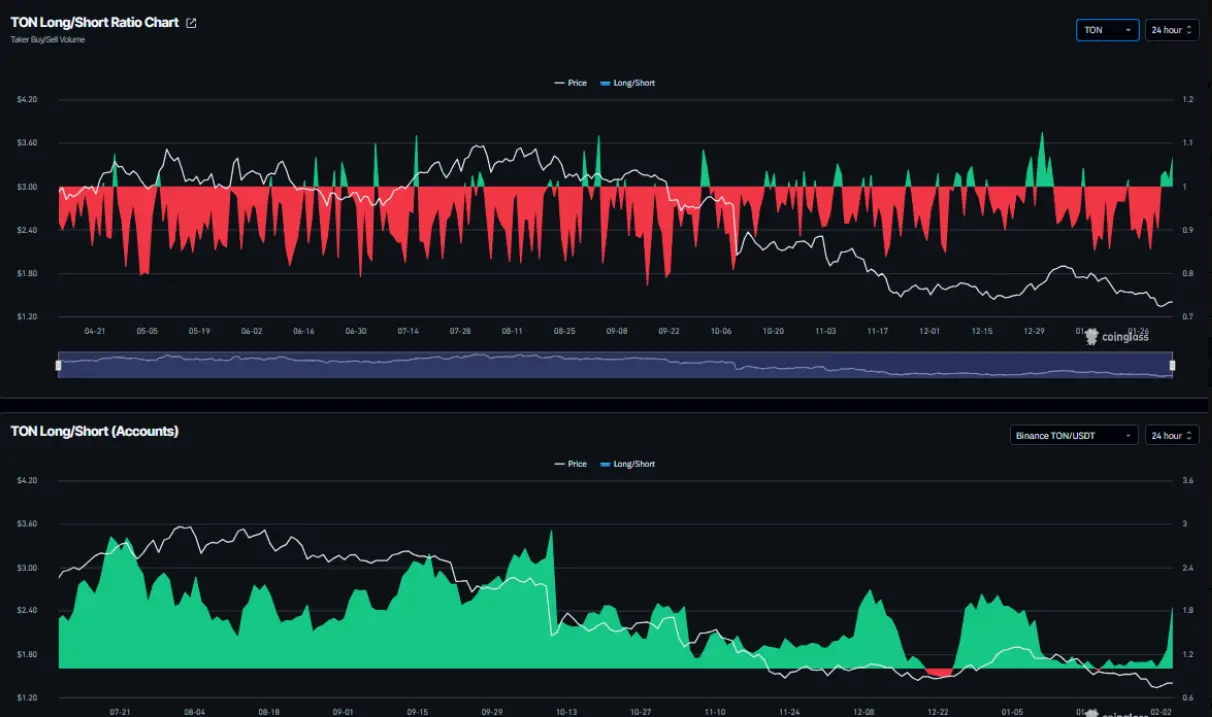 Long/short ratio chart for TON | Source: CoinglassAdditionally, the OI-Weighted Funding Rate data from CoinGlass indicates that the number of traders believing in a decline in TON’s price is significantly lower than those expecting an upward trend. The indicator has turned positive, reaching 0.0045% on Wednesday, meaning bulls are willing to pay fees to hold long positions, a signal often seen as supportive of a short-term recovery outlook for TON.
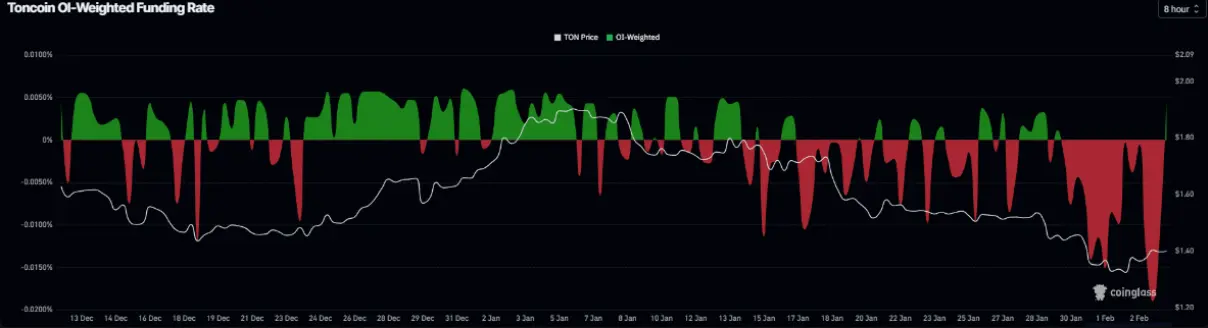 Funding rate chart for Toncoin | Source: Coinglass## Toncoin Price Forecast: TON Rises After Testing Support Level
Toncoin experienced a sharp correction of over 11% last week, retreating to test the daily support zone around $1.31. At the start of this week, buying interest re-emerged at this critical support area, helping TON recover approximately 4.5% through Tuesday. As of Wednesday, the coin is trading around $1.40.
If the recovery momentum continues, TON’s price could extend its upward move toward the $1.59 level — where the 50-day exponential moving average (EMA) and the downward trendline connecting recent peaks since early August converge, creating a notable technical resistance.
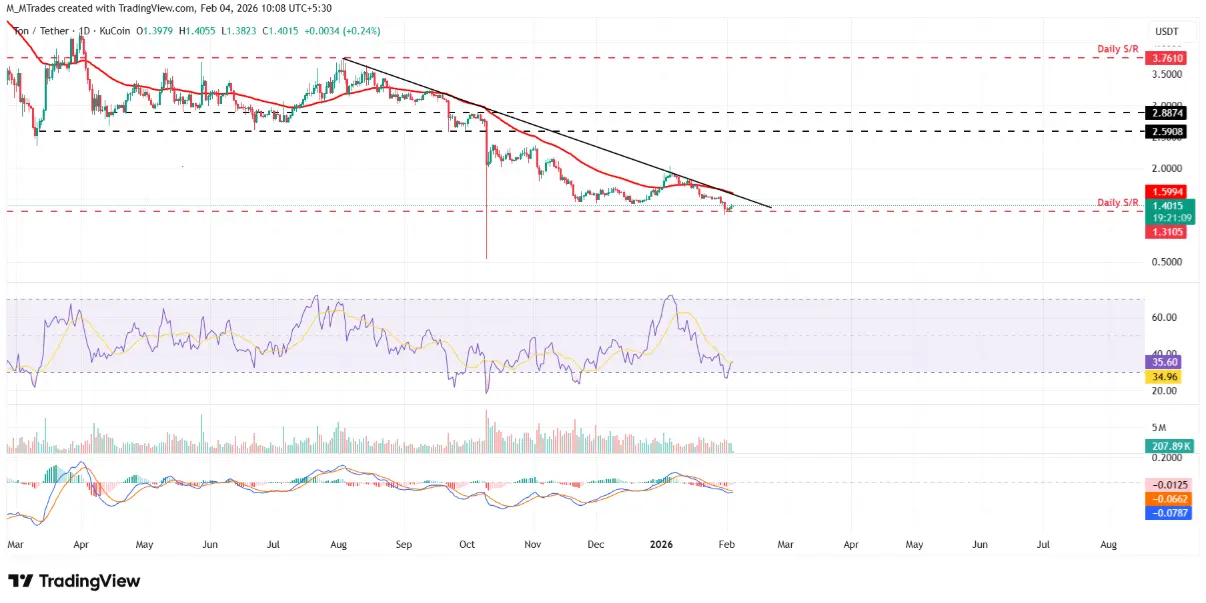 Daily TON/USDT chart | Source: TradingView Regarding indicators, the Relative Strength Index (RSI) on the daily timeframe is currently at 35, having rebounded from oversold territory and trending upward, reflecting weakening selling pressure. However, for the recovery trend to become more sustainable, RSI needs to break above the neutral threshold. Meanwhile, the MACD indicator also signals positive momentum as the red histogram bars below the neutral line continue to shrink, supporting a short-term recovery scenario.
In a negative scenario, if TON faces renewed selling pressure, the price could once again test the daily support zone around $1.31.
Disclaimer: The information on this page may come from third parties and does not represent the views or opinions of Gate. The content displayed on this page is for reference only and does not constitute any financial, investment, or legal advice. Gate does not guarantee the accuracy or completeness of the information and shall not be liable for any losses arising from the use of this information. Virtual asset investments carry high risks and are subject to significant price volatility. You may lose all of your invested principal. Please fully understand the relevant risks and make prudent decisions based on your own financial situation and risk tolerance. For details, please refer to
Disclaimer.