Stellar broke below $0.167, with a bullish-to-bearish ratio of 0.85, reaching a monthly low with increased short positions. Open interest (OI) hit a 14-month low of $95 million, down 13% weekly, breaking below the wedge lower boundary. RSI is at 26, indicating oversold conditions, and the MACD death cross persists. Support is at $0.160, with a rebound target of $0.180.
XLM Bullish-to-Bearish Ratio at 0.85, Open Interest Hits 14-Month Low
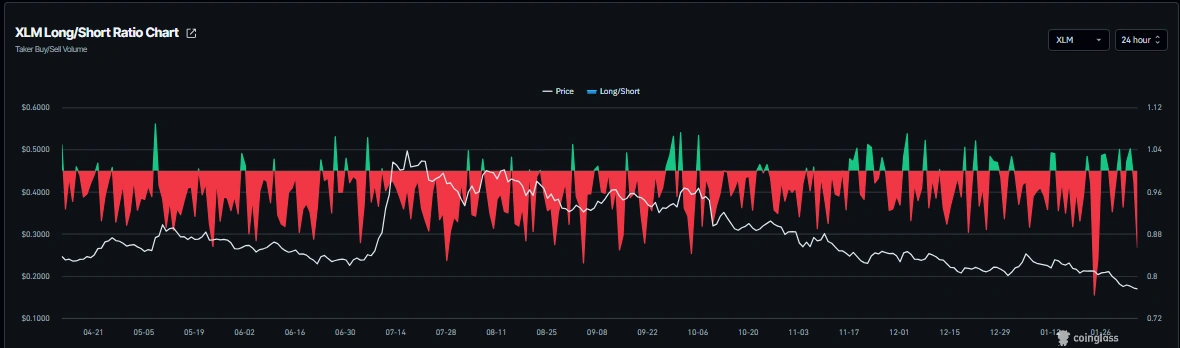
(Source: Coinglass)
CoinGlass reports that the XLM bullish-to-bearish ratio on Thursday is 0.85, approaching the lowest level in nearly a month. The ratio below 1 reflects bearish market sentiment, as more traders are betting on the asset’s price decline. The ratio is a direct indicator of market sentiment; when below 1, it indicates more short positions than long positions. A reading of 0.85 shows a clear short dominance, with approximately 118 shorts for every 100 longs.
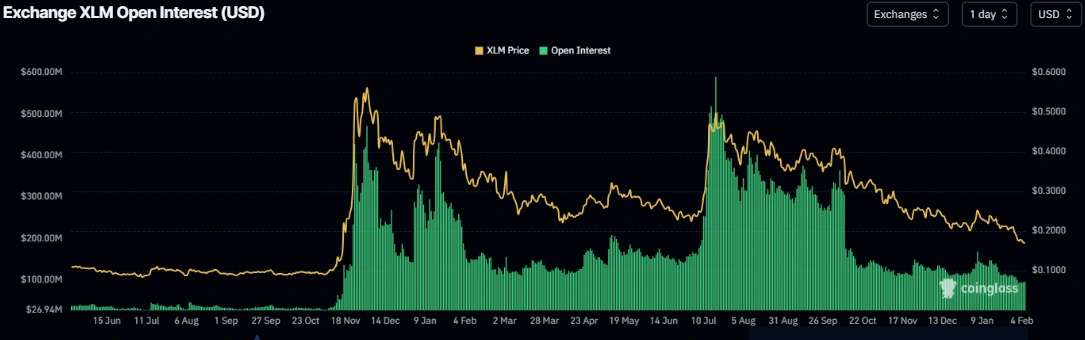
(Source: Coinglass)
Additionally, Stellar futures open interest (OI) on Thursday dropped to $95 million, the lowest since November 2024, and has been declining since the start of this year. The decrease in OI indicates waning investor participation, suggesting a bearish outlook. Open interest represents the total value of all unsettled futures contracts; its decline implies many positions have been closed or expired without reopening.
Over the past 14 months since November 2024, hitting such a low is rare. This typically occurs in highly pessimistic markets or when investors lose interest in the asset altogether. Compared to other major coins like Bitcoin and Ethereum, whose OI also declined but to a lesser extent, this disparity shows that XLM faces not only overall market weakness but also a specific confidence crisis in itself.
Dual Bearish Signals in the Derivatives Market
Bullish-to-bearish ratio 0.85: Short positions significantly outweigh longs, market betting on decline
Open interest hits 14-month low: $95 million, indicating collapsing investor engagement
The combined analysis of the bullish-to-bearish ratio and OI provides a more complete picture. If the ratio is bearish but OI is rising, it might only reflect short-term hedging or speculative shorts. However, when both indicators worsen simultaneously (bearish ratio + declining OI), it suggests not only bearish sentiment but also low overall participation. Under such conditions, even short-term rebounds may struggle to sustain due to lack of new buying interest.
Historically, XLM’s OI peaked above $300 million during the last bull market. The current level of $95 million is less than one-third of that peak, indicating a severe decline in market interest. Such participation collapse often precedes further price declines, as the lack of new capital means any selling pressure is hard to absorb.
Breaking Wedge with RSI at 26 Oversold Still Fails to Halt Decline
Last week, Stellar’s price fell over 13%, and on Saturday, the weekly close broke below the lower trendline of the descending wedge pattern. Before Wednesday, XLM faced resistance near this broken trendline, with declines exceeding 5%. As of Thursday, XLM traded at $0.169. The descending wedge is a classic technical pattern, typically appearing in downtrends, formed by two converging downward-sloping trendlines.
Breaking below the wedge’s lower boundary is significant technically. It usually signals an acceleration or continuation of the existing downtrend. In XLM’s case, the break on Saturday, confirmed by increased volume, validates the move. The rebound attempt on Wednesday was halted at the broken trendline, which has now shifted from support to resistance—a typical technical reversal, further reinforcing the bearish outlook.
If XLM continues to decline, it may test the 2025 low of $0.160, set on October 10. This support level has been tested multiple times; losing it could open the door to deeper declines. There is little technical support below $0.160, potentially accelerating the fall.
The daily RSI is at 26, in oversold territory, indicating strong downward momentum. RSI below 30 is generally considered oversold; 26 is deeply oversold. However, in strong downtrends, RSI can remain in oversold zones for extended periods without bouncing. Only when RSI begins to turn upward from oversold levels can it signal waning downward momentum.
The MACD also shows a death cross that has persisted since mid-January, with the red histogram bars extending below the neutral line, further confirming a negative outlook. The MACD death cross is a key trend reversal signal, occurring when the fast line crosses below the slow line. XLM’s death cross has lasted several weeks, with prices continuing to decline, indicating a genuine trend shift rather than a false signal.
Conversely, if XLM rebounds, it might rise toward the nearby downtrend line at around $0.180. This level is the first resistance for a short-term bounce; a break above it would open the path to higher targets. However, given current technical and sentiment conditions, such a rebound seems less likely.
Fundamental Weakness in Stellar Without Catalysts
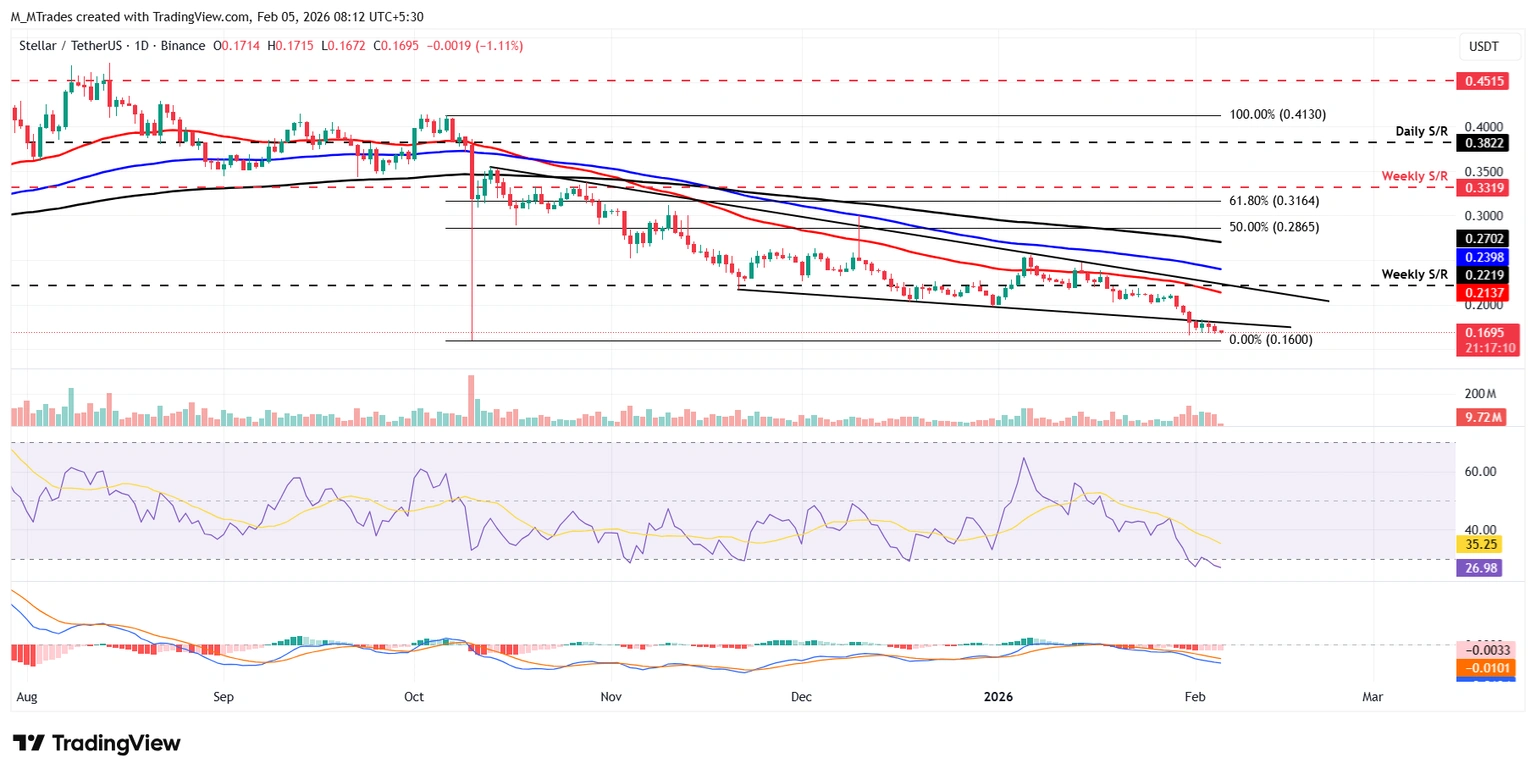
(Source: TradingView)
Beyond technical deterioration and derivatives data, Stellar faces a fundamental lack of catalysts. Compared to Ripple’s XRP, XLM has little progress in institutional adoption or regulatory breakthroughs. XRP benefits from ETF launches, Ripple’s EU licensing, and partnerships with banks, whereas Stellar lacks similar major news.
Stellar’s cross-border payment network, though technically advanced, lags behind Ripple in market promotion and commercial deployment. This fundamental weakness causes XLM to fall more sharply during downturns and rebound with less strength. Investors favor XRP over XLM when allocating cross-border payment tokens, reflected in price performance.
Market cap-wise, XLM is around $5 billion, far below XRP’s over $90 billion. This gap not only reflects differing market outlooks but also impacts liquidity and institutional interest. Larger institutions prefer assets with higher liquidity and market cap, putting XLM at a disadvantage.
For XLM holders, the current environment is highly challenging. Technicals are bearish across the board, derivatives data worsens, and fundamentals lack catalysts. This triple pressure makes a clear reversal unlikely in the short term. Unless the Stellar Foundation announces major partnerships or technological breakthroughs, XLM may continue to drift in a bear market.
Disclaimer: The information on this page may come from third parties and does not represent the views or opinions of Gate. The content displayed on this page is for reference only and does not constitute any financial, investment, or legal advice. Gate does not guarantee the accuracy or completeness of the information and shall not be liable for any losses arising from the use of this information. Virtual asset investments carry high risks and are subject to significant price volatility. You may lose all of your invested principal. Please fully understand the relevant risks and make prudent decisions based on your own financial situation and risk tolerance. For details, please refer to
Disclaimer.
Related Articles
Bitcoin Rises as Trump Amplifies Iran Threats, Fed Rate Cut Chances Fall Near Zero
Bitcoin's price hovers near $71,000 despite a 3% increase, as geopolitical tensions and the Federal Reserve's rate policy create market uncertainty. Oil prices have declined from recent peaks, and crypto markets face liquidation pressures amid mixed investor sentiment.
Decrypt22m ago
Crypto and TradFi Divergence Defines 2026 Market Resilience Amidst Bitcoin Sell-Off
March 2026 as traditional equities and digital assets fell sharply apart. In the first quarter A decoupling is being witnessed that challenges the notion of Bitcoin as a high-beta proxy for the stock market. After a year-end sell-off and a plunge from its 2025 highs, the S&P 500 (SPX) has shown
BlockChainReporter49m ago
ETH 15-minute increase of 1.02%: Ecosystem upgrade expectations resonate with active buying, driving the rally
From 14:30 to 14:45 (UTC) on March 10, 2026, ETH recorded a short-term gain of +1.02%, with the price rising from 2024.3 USDT to 2047.18 USDT, an amplitude of 1.13%. Trading volume during this period significantly increased, with active addresses rising from 12,800 to 15,600, and large on-chain transfers up by 30.2%, reflecting a notable increase in market attention and volatility.
The main driver of this movement is the Ethereum "Verde" technical upgrade testnet news.
GateNews1h ago
BTC 15-minute increase of 0.95%: Technical breakthrough and large on-chain transfers dominate short-term rally
From 14:30 to 14:45 on March 10, 2026 (UTC), the price of BTC surged rapidly, with a 15-minute return of +0.95%. The candlestick quotes fluctuated between 69,792.0 and 70,485.0 USDT, with an amplitude of 0.99%. Market short-term activity increased, and the heightened volatility attracted widespread attention from users.
The main driver of this anomaly was BTC breaking through a key resistance level in the short term, activating technical traders and automated quantitative strategies to buy, creating a bullish momentum. At the same time, large on-chain BTC transfers and net inflows to exchanges...
GateNews1h ago
Geopolitical Turmoil! Dalio Declares "Gold is the Only True God," but Its Safe-Haven Performance Trails Bitcoin
As geopolitical tensions in the Middle East escalate, Bridgewater founder Ray Dalio questions Bitcoin and reaffirms gold as the preferred safe haven. Nevertheless, gold prices fell accordingly, while Bitcoin only experienced a slight correction, indicating that the correlation between the two is weakening. Dalio doubts Bitcoin's transparency and future risks, but he still maintains a small allocation of Bitcoin for diversification.
区块客1h ago
QUBIC Surges 44.4% Over the Week, Ready to Ascent to the Moon: Expert Analysis
The Qubic (QUBIC) coin has gained attention for its price rise, reaching $0.0696514, driven by strong demand for its decentralized computing solutions. Analysts predict continued growth thanks to increased usage and user activity, with an 85.89% spike in trading volume.
BlockChainReporter1h ago