
Key Takeaways
-
Bitcoin is trading inside a consolidation range that closely mirrors a previous bullish fractal.
-
Price action suggests BTC is entering a Wyckoff Spring zone, where a final liquidity sweep may occur.
-
A brief dip toward the $78,000 demand area could act as a last shakeout rather than a breakdown.
-
If buyers absorb supply near this zone, BTC may reclaim range support and attempt a rebound.
-
The broader structure still favors accumulation, with downside moves potentially serving as fuel for the next upside leg.
The broader cryptocurrency market has come under intense pressure over the last 24 hours, with Bitcoin (BTC) dropping nearly 6% to below $83,000, marking its lowest level of 2026 so far.
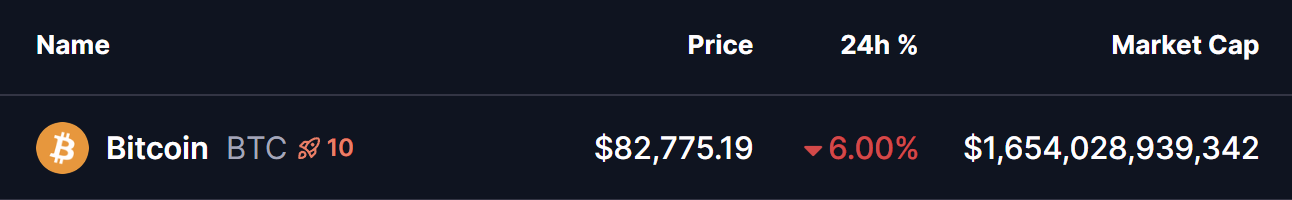
Source: Coinmarketcap
The sharp decline triggered around $780 million in liquidations, with an overwhelming $745 million coming from long positions, highlighting how aggressively leveraged the market had become.
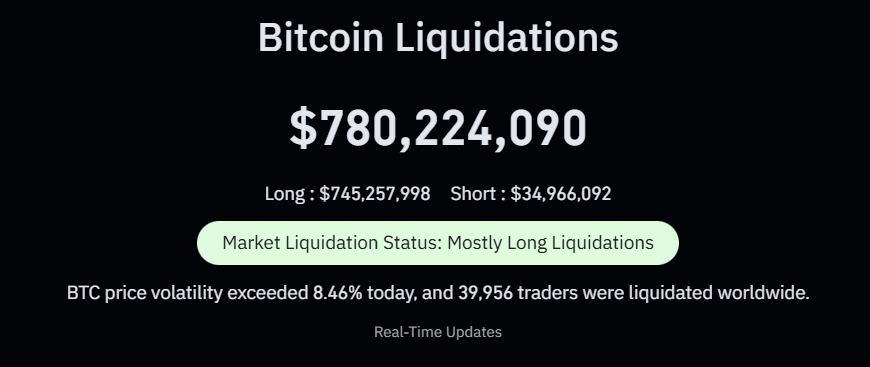
BTC Liquidations/Source: Coinglass
This move did not happen in isolation. A broader sell-off in risk assets, weakness in US equities, aggressive leverage unwinding, and rising Bitcoin ETF outflows all combined to fuel the downside. Fear accelerated quickly—but the chart suggests this move may be more strategic than it appears at first glance.
Spot ETF Outflows Accelerate
Adding to the pressure, Bitcoin spot ETFs recorded $817 million in net outflows on January 29 (ET), according to SoSoValue data.
-
BlackRock’s IBIT saw the largest single-day outflow at $318 million, though it still holds a massive $62.48 billion in historical net inflows.
-
Fidelity’s FBTC followed with $168 million in outflows, while its total historical net inflow stands at $11.26 billion.
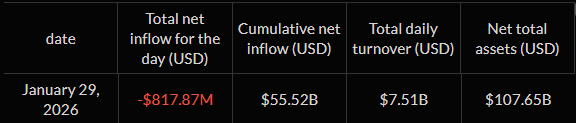
BTC Spot ETF Outflow/Source: SoSoValue
Despite the short-term outflows, the total net asset value of Bitcoin spot ETFs remains high at $107.65 billion, signaling that long-term capital has not exited the market—only repositioned.
Wyckoff Structure Comes Into Focus
According to the latest chart analysis by B4CRYPTOTW, Bitcoin’s current price action closely aligns with a Wyckoff Accumulation schematic, particularly a Spring phase near the lower boundary of the broader trading range.
On the daily chart, BTC has spent weeks consolidating within a defined range. The recent breakdown below support does not show characteristics of a trend failure. Instead, it resembles a liquidity grab—a move designed to force weak hands out of the market:
-
Price dips below key support
-
Stop losses are triggered
-
Long positions are liquidated
-
Fear peaks
-
Smart money absorbs supply quietly
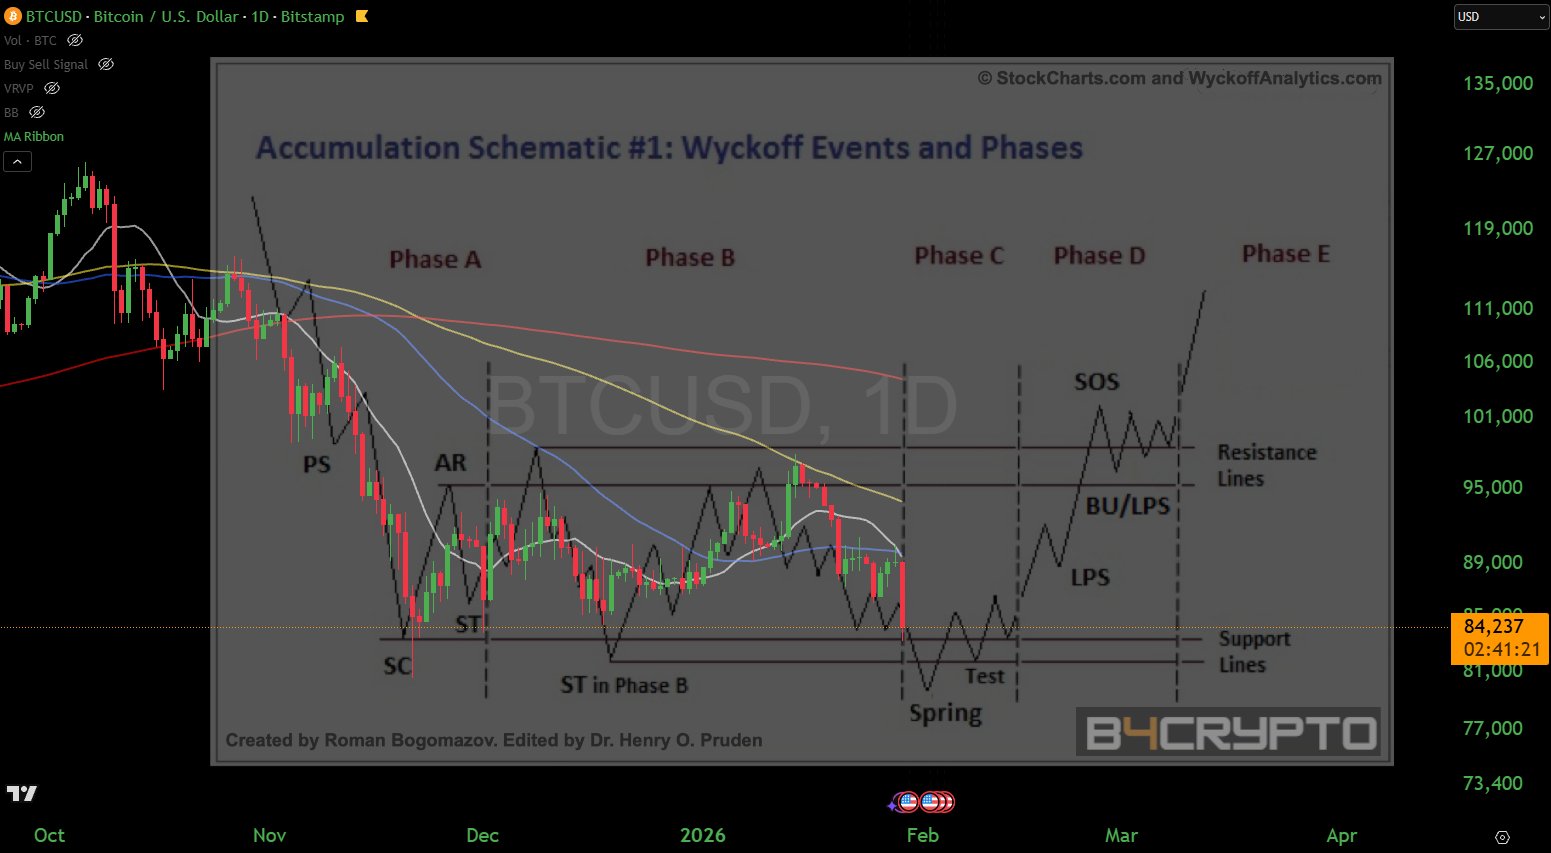
_Bitcoin (BTC) Chart/Daily Chart/Coinsprobe _
This is how Wyckoff ranges typically resolve before expansion. The largest red candles often appear during Springs, not during true breakdowns.
Spring Zone in Play: Could $78K Be Touched?
At the same time, price action suggests Bitcoin is now moving deeper into the Spring zone, where one more downside sweep cannot be ruled out. If selling pressure continues in the short term, BTC could briefly dip toward the lower demand area around $78,000, a level that sits just below the current range support and fits the profile of a classic Wyckoff stop-hunt.
Such a move would likely be fast, emotional, and driven by panic, designed to flush out the remaining late longs. Importantly, this would not signal structural weakness. In Wyckoff terms, a deeper Spring often represents the final shakeout, where supply is fully absorbed before a reversal takes shape.
If this Spring scenario plays out, Bitcoin may now be transitioning into a testing phase, where price holds above the lows before strength gradually re-emerges.What Could Come Next for $BTC?
If this Spring scenario plays out, Bitcoin may now be transitioning into a testing phase, where price holds above the lows before strength gradually re-emerges.
What Could Come Next for $BTC?
As long as Bitcoin avoids sustained acceptance below the lower demand zone, this move is more likely to be remembered as a shakeout, not a breakdown. A successful defense of the Spring area could mark the foundation for the next expansion leg once volatility cools and liquidity resets.
Disclaimer: The views and analysis presented in this article are for informational purposes only and reflect the author’s perspective, not financial advice. Technical patterns and indicators discussed are subject to market volatility and may or may not yield the anticipated results. Investors are advised to exercise caution, conduct independent research, and make decisions aligned with their individual risk tolerance.
About Author: Nilesh Hembade is the Founder and Lead Author of Coinsprobe, with over 5 years of experience in the cryptocurrency and blockchain industry. Since launching Coinsprobe in 2023, he has been providing daily, research-driven insights through in-depth market analysis, on-chain data, and technical research.
Disclaimer: The information on this page may come from third parties and does not represent the views or opinions of Gate. The content displayed on this page is for reference only and does not constitute any financial, investment, or legal advice. Gate does not guarantee the accuracy or completeness of the information and shall not be liable for any losses arising from the use of this information. Virtual asset investments carry high risks and are subject to significant price volatility. You may lose all of your invested principal. Please fully understand the relevant risks and make prudent decisions based on your own financial situation and risk tolerance. For details, please refer to
Disclaimer.
Related Articles
Aptos Shows Momentum: Could APT Break Resistance Soon?
APT tests $1 resistance, forming higher lows and showing steady buyer conviction.
Rising triangle, A/D, and MFI indicators suggest building bullish momentum.
Confirmation above $1 could trigger breakout, but BTC stability and caution remain important.
Aptos — APT, has been gaining
CryptoNewsLand47m ago
Bitcoin Gold Price Soars 12.83%: Institutional Interest Grows
Bitcoin Gold's price surged by 12.83% to $0.554349, reflecting increased market interest, particularly from institutional investors. Active trading indicates growing retail participation. Traders are monitoring key price levels for potential future trends.
Coinfomania50m ago
Bitcoin shows resilience, options market indicates easing of downside concerns
Despite international oil prices rising to $115 and the market shifting to a defensive stance, Bitcoin has shown resilience, with options flow indicating reduced downside concerns. Market optimism towards Bitcoin is returning, with focus on this week's economic data.
GateNews1h ago
'Bull Trap Forming' – Willy Woo Says Bottom Not In for Bitcoin
Willy Woo, an on-chain analyst, warns that Bitcoin's recent rally may be a "bull trap," suggesting the market remains in a downward trend and that the true bottom has not yet been reached. Traders should remain cautious and watch for potential lower prices.
Coinpedia1h ago
Trump says oil prices will quickly fall back, but Bitcoin and the stock market have already been hit
On March 9th, as the "Epic Rage Action" escalated, the global energy markets experienced intense volatility, with oil prices soaring to $116 at one point, raising concerns about supply disruptions through the Strait of Hormuz. Trump predicted that oil prices would fall back, but gasoline prices have already risen to $3.45. The stock and cryptocurrency markets declined sharply, and investors should pay attention to the impact of geopolitical events on the markets and future monetary policies.
GateNews1h ago
Ethereum Price News: Co-founder Jeffrey Wilcke transfers $157 million worth of ETH to CEX, can the key support level of $1920 hold?
Ethereum (ETH) recently dropped nearly 8%, hitting a low of $1912, mainly due to market concerns over the founder transferring a large amount of ETH. However, institutional investors remain actively involved, with a short-term support level at $1920. If maintained, a rebound to $2000 is possible. Technical analysis shows bearish signals, and future trends will depend on the performance of large holders and support levels.
GateNews1h ago