
Key Takeaways
-
Bitcoin has dropped into a major 10-month support zone between $74,500–$78,600
-
The weekly chart shows a developing head and shoulders structure
-
BTC has corrected nearly 40% from its all-time high near $121,900
-
Reclaiming the 100-week MA around $87,263 could trigger a move toward $109,568
-
A breakdown below support may expose BTC to deeper downside toward the $49,000 region
Bitcoin has entered a critical phase in early February 2026, sliding into a zone that hasn’t been meaningfully tested in nearly ten months. After weeks of sustained selling pressure, BTC has dropped into the $74,500–$78,600 support range, an area that previously acted as a strong base during April-2025.
As of February 2, 2026, Bitcoin is trading near $76,614, down 2.24% over the past 24 hours, with an intraday low touching $74,551. On a broader scale, BTC is now down 12.45% year-to-date, erasing a large portion of the late-2025 rally and pushing market sentiment back into caution mode.
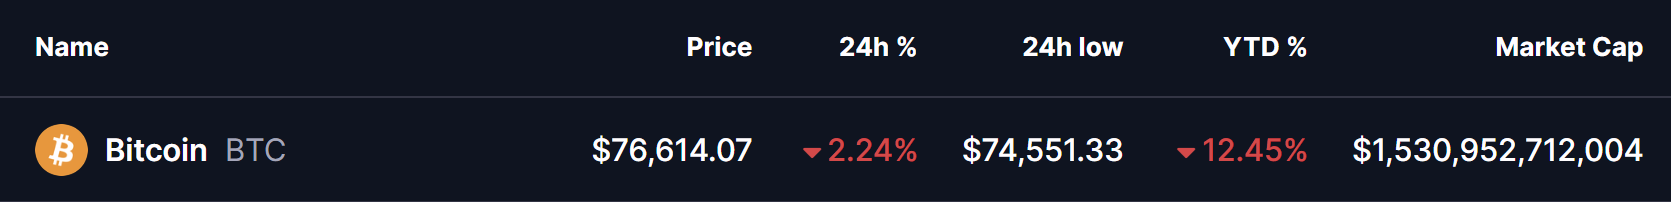
Source: Coinmarketcap
Yet, while price action looks heavy on the surface, the weekly chart structure suggests this move may be more than just panic-driven selling.
A Head and Shoulders Structure Near Completion
On the weekly timeframe, Bitcoin is carving out a developing head and shoulders pattern, a classic structure that often marks a major transition in trend. The “head” of the pattern formed near Bitcoin’s all-time high region around $121,900, from where BTC has corrected roughly 40% at its worst point.
The recent breakdown below the 100-week moving average, currently near $87,263, accelerated downside momentum and dragged price directly into the neckline support zone between $74,500 and $78,600.
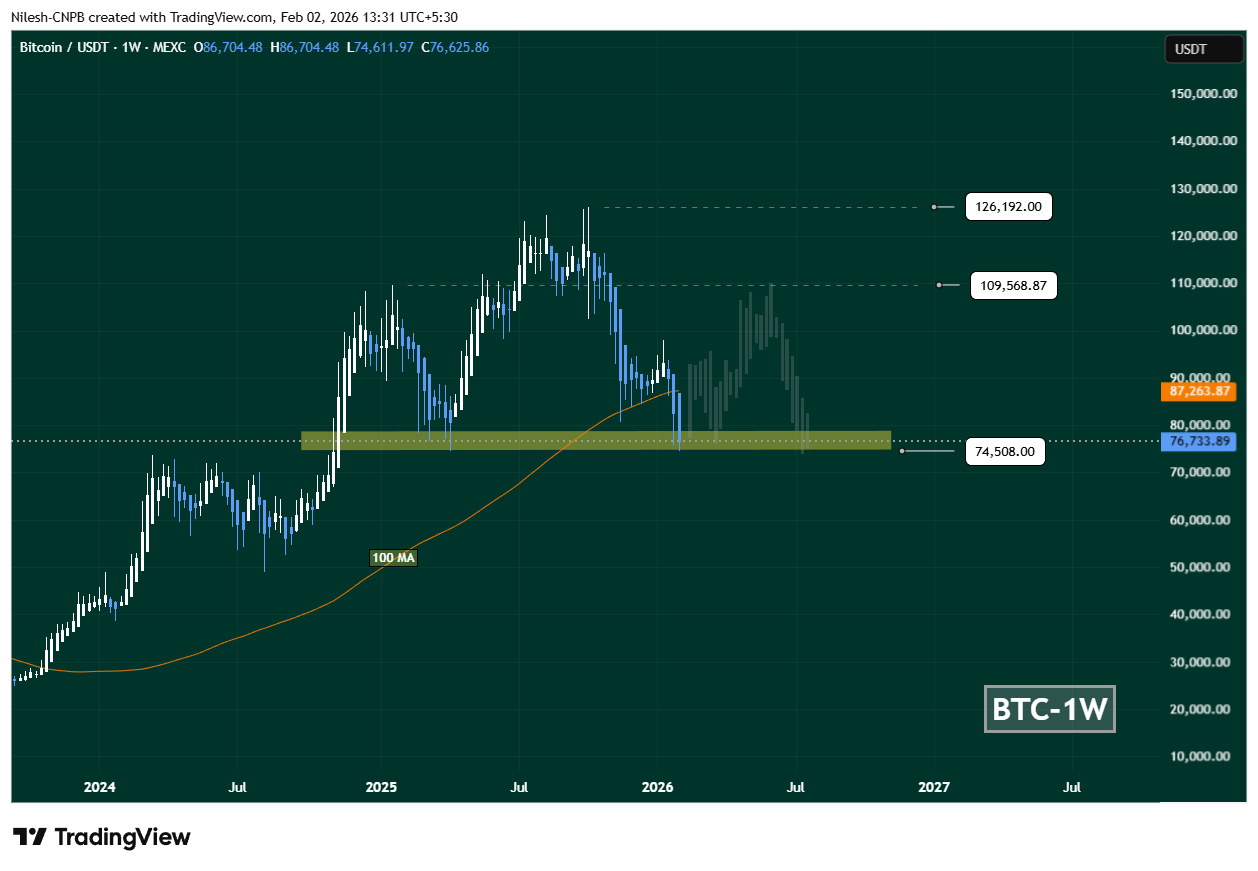
Bitcoin (BTC) Weekly Chart/Coinsprobe (Source: Tradingview)
This neckline is not just a random horizontal level. Historically, it has acted as a high-demand area, absorbing selling pressure and triggering strong rebounds. The latest weekly candle shows a clear downside wick into this zone, hinting that selling momentum may be weakening as buyers cautiously step in.
Liquidity Clusters Hint at a Potential Upside Magnet
Adding weight to the rebound narrative, Coinglass data highlights over $2.60 billion in liquidity stacked above the $87,000 region. This cluster creates a potential upside magnet if price manages to stabilize and reclaim key resistance levels.
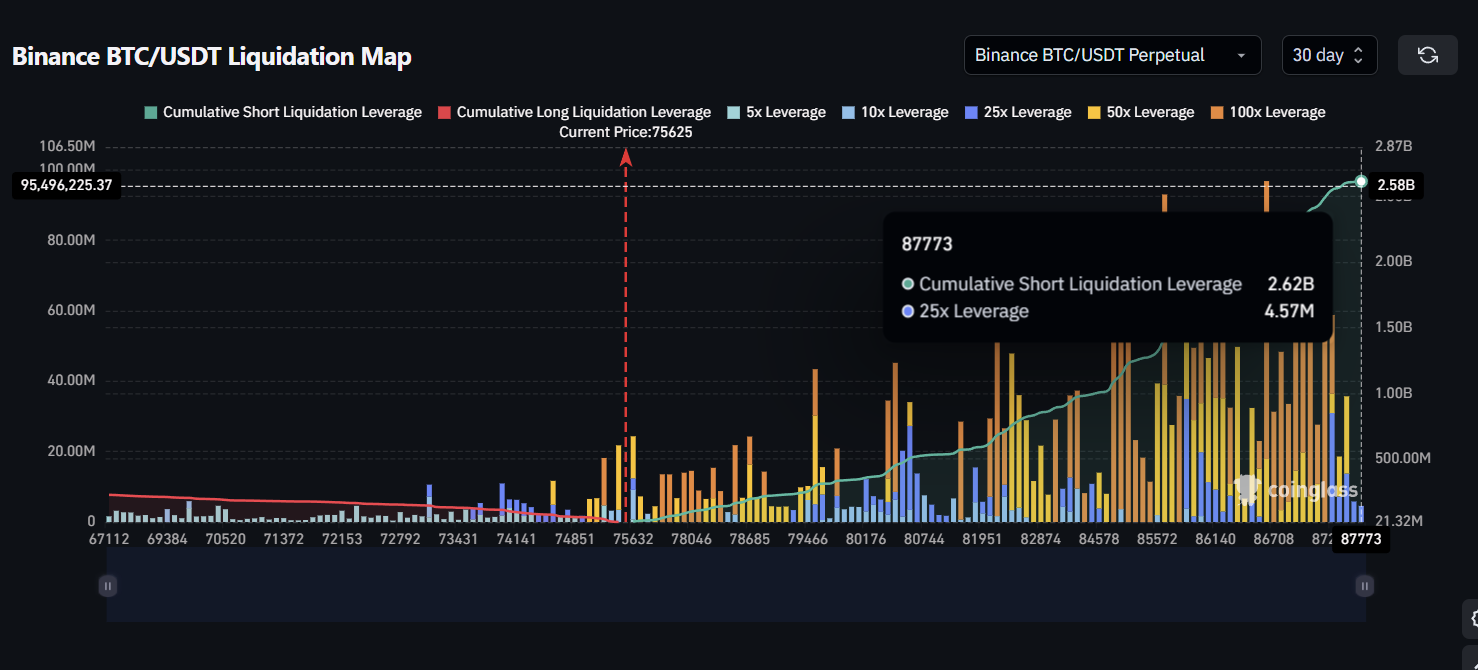
Source: Coinglass
From a market mechanics perspective, such liquidity zones often attract price once downside pressure cools, especially after a prolonged corrective move like the one Bitcoin has just experienced.
What the Chart Suggests Going Forward
If Bitcoin manages to defend the neckline support and reclaims the 100-week MA near $87,263, momentum could shift meaningfully in favor of bulls. In that scenario, a recovery toward the $109,568 region becomes technically plausible — representing a potential 40%+ upside move from current levels.
Such a rally would likely form the right shoulder of the larger head and shoulders structure, leaving BTC at a critical decision point between trend continuation or renewed consolidation.
On the flip side, failure to hold the $74,500–$78,600 zone would significantly weaken the structure. A clean breakdown below this area could open the door to a deeper correction toward the $49,000 region, where the next major liquidity pocket and historical support reside.
The Market’s Defining Moment
For now, Bitcoin is sitting at a make-or-break level. The neckline zone remains the battlefield where bulls and bears are actively fighting for control. How price reacts here will likely set the tone for the next major trend — whether that’s a relief rally driven by liquidity hunts or a continuation of the broader corrective phase.
One thing is clear: this is not a level the market can ignore.
Disclaimer: The views and analysis presented in this article are for informational purposes only and reflect the author’s perspective, not financial advice. Technical patterns and indicators discussed are subject to market volatility and may or may not yield the anticipated results. Investors are advised to exercise caution, conduct independent research, and make decisions aligned with their individual risk tolerance.
About Author: Nilesh Hembade is the Founder and Lead Author of Coinsprobe, with over 5 years of experience in the cryptocurrency and blockchain industry. Since launching Coinsprobe in 2023, he has been providing daily, research-driven insights through in-depth market analysis, on-chain data, and technical research.
Disclaimer: The information on this page may come from third parties and does not represent the views or opinions of Gate. The content displayed on this page is for reference only and does not constitute any financial, investment, or legal advice. Gate does not guarantee the accuracy or completeness of the information and shall not be liable for any losses arising from the use of this information. Virtual asset investments carry high risks and are subject to significant price volatility. You may lose all of your invested principal. Please fully understand the relevant risks and make prudent decisions based on your own financial situation and risk tolerance. For details, please refer to
Disclaimer.
Related Articles
The number of Americans holding Bitcoin has surpassed gold for the first time, with BTC holding steady at $63,700 becoming the key
The Bitcoin market is consolidating at high levels, and the number of holders surpassing gold owners indicates increased recognition of it as a new store of value. The US market demand is strong but faces a key technical test, requiring a steady hold above $63,700. The flow of funds will determine the future price trend.
GateNews19m ago
Bitcoin holds steady at $67,000: Crypto concept stocks collectively decline, signaling a repeat of the 2022 market crisis
Recently, Bitcoin's price has been fluctuating around $67,500, but related crypto concept stocks have experienced a significant pullback, sparking market concerns about risk. Data shows that the stock prices of many publicly traded companies holding Bitcoin have declined, and some investors are already in unrealized losses. This situation echoes signals from the 2022 crypto market crisis, with funds flowing out of crypto ETFs and investors beginning to reduce their risk exposure. Nevertheless, publicly traded companies still hold large amounts of Bitcoin, and future development depends on increased institutional participation.
GateNews22m ago
Bitcoin rebounds and breaks through $67,000: Trump signals a de-escalation of tensions, BTC market strengthens again
Bitcoin price has returned to $67,000 amid easing expectations in the Middle East situation, with a nearly 1% increase over 24 hours. Trading volume has increased by 53%, and the total market capitalization has risen to approximately $2.33 trillion. Mainstream digital assets are also rebounding in tandem. Analysts suggest that if the Middle East conflict cools down, it could trigger a capital inflow, further driving Bitcoin higher.
GateNews26m ago
BTC Markets targets 16 trillion RWA Bitcoin, applies for Australian tokenized market license
Australian cryptocurrency exchange BTC Markets is applying for a market license to offer regulated tokenized real-world asset (RWA) trading. The exchange aims to transform into a tokenized market operator and predicts that the global tokenization market could reach $16 trillion by 2030. Dobbins pointed out that Australia could generate approximately $16.8 billion in economic benefits annually through the tokenization market and plans to promote tokenization applications in private markets and infrastructure investments.
MarketWhisper44m ago
Analyst Warning: If Bitcoin enters a cyclical correction, XRP price may drop to $0.70
Cryptocurrency market fluctuations have attracted attention. Analysts point out that if Bitcoin enters a correction, XRP may face a pullback risk, with a target price of around $0.70. Bitcoin's four-year cycle characteristics indicate that correction periods could impact altcoin performance. If XRP's price falls below the $1.20 support level, the market could see further downside. Meanwhile, XRP's application in cross-border payments may reduce its dependence on Bitcoin. Investors should monitor Bitcoin's cycle changes and technical support levels.
GateNews49m ago