Bitcoin’s bounce appears driven by short covering, with analysts warning that weak demand could expose the price to renewed downside.
After a turbulent week marked by high price swings, Bitcoin has posted a slight price recovery. Even at that, market analysts remain cautious about the OG coin’s price movement. As spotted by market commentators, the recent uptick appears to be driven by
short position closures rather than new buying interest. More so, several technical and on-chain signals suggest selling pressure has not fully eased.
Bitcoin Rally Lacks Conviction as Open Interest Drops, Ted Pillows Warns
Crypto analyst Ted Pillows said Bitcoin’s recent price rise came mainly from short covering. Basically, traders closed bearish positions as the market worsened. In turn, this led to a surge in liquidations, which momentarily pushed prices higher.
$BTC recent pump was mostly driven by shorts closing.
Now, Open Interest has been fully wiped out, and the spot demand will decide the next move.
So far, I have seen that sellers are still dominant, which isn’t a good thing. pic.twitter.com/45VsQj2ttG
— Ted (@TedPillows) February 7, 2026
As Bitcoin recovered, open interest fell quickly as prices rose, with many leveraged futures positions closed. Generally, such a trend indicates that traders are exiting positions rather than a confident play by new buyers.
A chart posted by Pillows shows that the firstborn coin is flashing weak market signals despite the rebound. Evidently, Bitcoin’s trend remains predominantly southbound, marked by lower highs and lower lows.
Aggregated open interest falling during a price increase suggests limited new long exposure. Sellers are still in control at current prices, making it unlikely that these levels will hold for long. As such, the downward travel could continue unless spot buyers enter strongly at the current level.
Analyst Highlights BTC’s Bottom Near $34,500
Pillows also reviewed Bitcoin’s position using an on-chain valuation model. He focused on Long-Term Holder Realized Price, which tracks the average acquisition cost for long-term investors.
The analyst explained that “every $BTC cycle bottom has happened 15% below its Long-Term Holder Realized Price. Right now, it’s sitting around $40,300. A 15% dip means Bitcoin will bottom around $34,500.”
However, Pillows cautioned that such a drop may not occur during this cycle. He added that stronger holder conviction and shifting market structure could keep prices above prior downside targets.
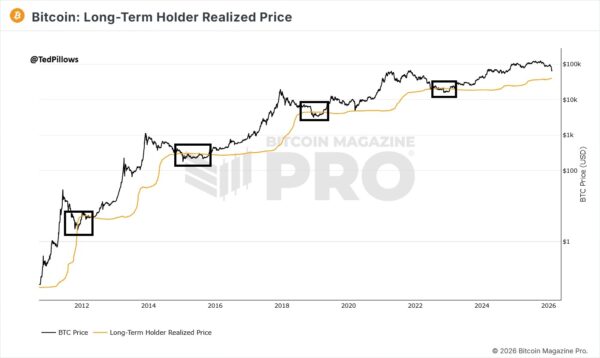
_Image Source: _X Ted Pillows
During earlier cycles, the price briefly dipped below LTH cost before forming lasting lows. Often, those moments preceded a decline in the high level of selling frenzy and early stabilization.
At the time of writing, BTC is hovering around $69,447 after rebounding from below $60,000. Even with the recent recovery, BTC’s market structure shows the absence of a sustained trend shift. Short-term moves continue to depend heavily on futures activity rather than spot accumulation.
Ash Crypto Says Bitcoin Shows June 2022–Like Weakness
Another analyst, Ash Crypto, compared recent conditions with those in June 2022 based on structure and momentum. The market commentator said that weekly Relative Strength Index readings have fallen to levels last seen during prior capitulation phases. Typically, such setups are evident during panic selling or near temporary bottoms.
This week’s crash looks like June 2022.
– RSI hitting the same level
– Similar breakdown below key Fibonacci level
– Rumours of big HK funds blowing up.
If this holds true, we are now entering a sideways/accumulation phase ($60K-$90K), which could last for 3-5 months. pic.twitter.com/dJGoWtNcoE
— Ash Crypto (@AshCrypto) February 7, 2026
The market commentator identified a break below a key Fibonacci support level. Interestingly, a similar trend appeared during the 2022 crypto winter. And interestingly, the breakdown resulted in accelerated losses as traders reacted to failed support.
Macroeconomic concerns like the weak outing by Hong Kong-based investment vehicles also weighed in on the price trend. As in that period, fear associated with external risk events has again weighed on sentiment.
Ash Crypto predicted a prolonged consolidation phase for the OG coin, citing current market signals. He speculated the price could range between $60,000 and $90,000 for several months. Instead of rapid price rebounds, these phases usually feature sharp swings and lower volatility. Additionally, it comes with slow buying by long-term investors.
Disclaimer: The information on this page may come from third parties and does not represent the views or opinions of Gate. The content displayed on this page is for reference only and does not constitute any financial, investment, or legal advice. Gate does not guarantee the accuracy or completeness of the information and shall not be liable for any losses arising from the use of this information. Virtual asset investments carry high risks and are subject to significant price volatility. You may lose all of your invested principal. Please fully understand the relevant risks and make prudent decisions based on your own financial situation and risk tolerance. For details, please refer to
Disclaimer.
Related Articles
Yesterday, the US Bitcoin spot ETF experienced a net inflow of $57.73 million.
Gate News Report, March 10 — According to crypto analyst Trader T's monitoring, on March 9, the US Bitcoin spot ETF saw a net inflow of $57.73 million. Among them, FBTC (Fidelity) had a net inflow of $60.09 million; BITB (Bitwise) had a net outflow of $4.49 million; ARKB (Ark) had a net outflow of $274 million.
GateNews4m ago
Peter Brandt releases Bitcoin chart analysis showing a short-term bullish pattern
Gate News Announcement, March 10, renowned trader and chart analyst Peter Brandt released a Bitcoin chart analysis. Peter Brandt successfully predicted the 2018 Bitcoin crash. The chart shows the "Big Banana" chart displaying a large upward curved channel on the long-term weekly chart (2014-2027); the "Small Banana" chart shows a smaller similar curve currently forming near $69,000 on the daily chart. The arrows in the chart clearly point upward, indicating higher targets.
GateNews25m ago
BTC Price Fluctuation Analysis
# BTC Price Movement Deep Attribution Report for March 10, 2026, 02:30-02:45 (UTC)
## 1. Event Overview
Between 02:30 and 02:45 (UTC) on March 10, 2026, Bitcoin (BTC) experienced a significant price movement, with a return of +1.39%. The price fluctuations during this time window exceeded normal ranges, attracting market attention. This report will conduct a comprehensive attribution analysis based on on-chain data, market conditions, macroeconomic environment, trading behaviors, and other dimensions to uncover the true causes of the event and provide insights for investors.
GateNews32m ago
Bitcoin surpasses 70,000 USDT, with an intraday increase of 2.33%
Gate News Report, March 10th, according to market data, Bitcoin broke through 70,000 USDT, currently trading at 70,031.93 USDT, with a daily increase of 2.33%.
GateNews37m ago