Pump.fun (PUMP) continues to face correction pressure, declining about 2% at the time of writing on Tuesday, extending the previous session’s 4% plunge. The token of this launchpad platform remains at risk of deeper decline, as 10 billion PUMP are scheduled to be unlocked today, increasing supply pressure amid waning retail investor interest. From a technical perspective, PUMP’s outlook continues to lean toward a negative scenario, with selling pressure clearly dominant and bearish momentum still prevailing in the market.
Monthly token unlocks and weak demand increase downside risk
Data from DeFiLlama indicates that approximately 10 billion PUMP tokens will be unlocked on Tuesday evening and distributed to the community fund and ecosystem. With a total value exceeding $20 million, this amount—especially the portion allocated to the community—could add to selling pressure, as investor sentiment has not yet recovered from last week’s sharp market sell-off.
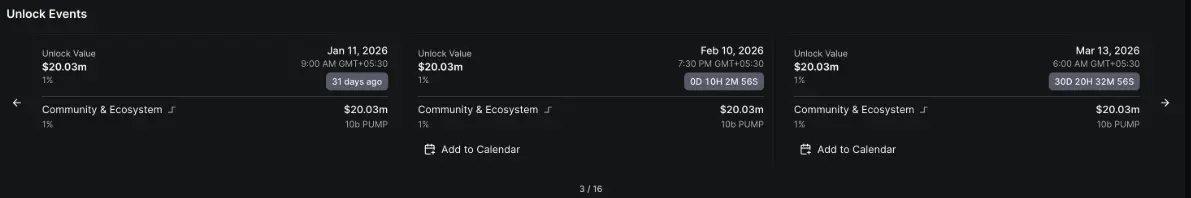 PUMP unlock data | Source: DeFiLlama Conversely, data from CoinGlass shows that the open interest (OI) of PUMP futures contracts has been steadily declining, dropping to $161.95 million on Tuesday. This trend reflects increasing caution and diminishing participation from retail investors.
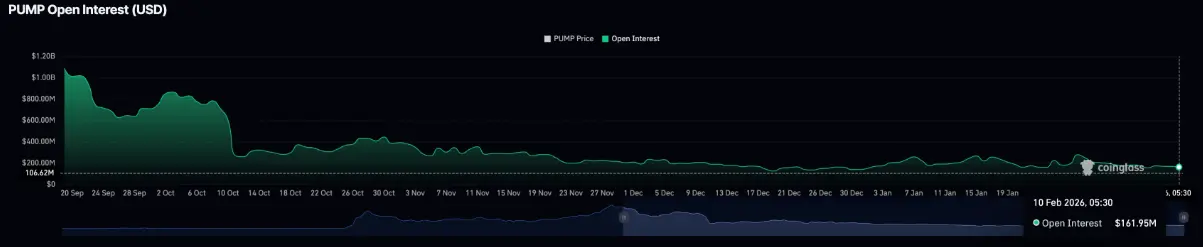 PUMP futures open interest (OI) | Source: CoinGlass
Technical analysis: Will PUMP continue to fall sharply?
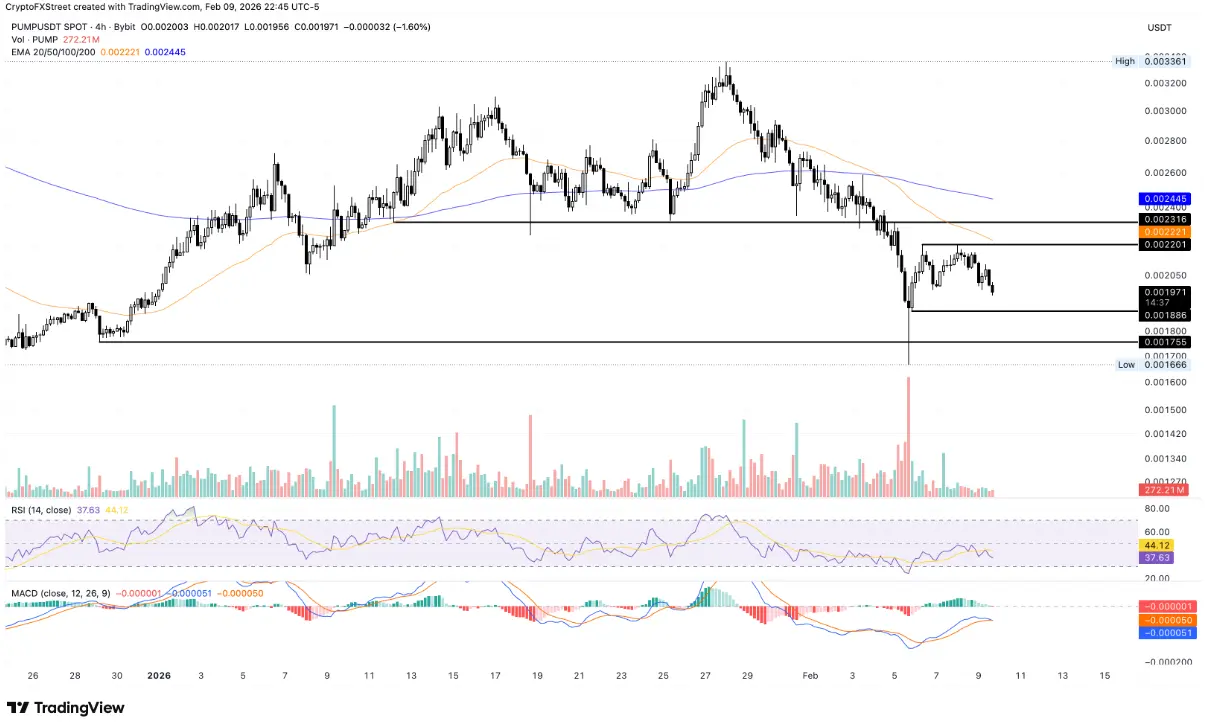
PUMP broke below the key psychological level of $0.002000 after a 4% decline on Monday. The selling momentum shows no signs of stopping; as of this writing, the price continued to lose nearly 2% on Tuesday, marking the fourth consecutive day of decline since the peak on February 6 at $0.002201.
The current weakening trend is pushing PUMP close to the support zone at $0.001886—corresponding to the 4-hour candle low formed on February 5. If the price closes clearly below this level on the 4-hour chart, the downtrend is likely to extend, with the next target being the December 29 low around $0.001775.
 PUMP/USDT 4-hour chart | Source: TradingView
From a technical standpoint, momentum indicators on the 4-hour chart are leaning toward a negative scenario. The RSI has retreated to around 40 and turned downward from the neutral zone, indicating room for correction before entering oversold territory. Meanwhile, the MACD line is approaching the signal line, increasing the risk of a bearish crossover.
Conversely, if the bulls manage to quickly regain the $0.002000 level, the price could recover to test the 50-period EMA at $0.002213, near the short-term high on February 6 at $0.002201.
Disclaimer: The information on this page may come from third parties and does not represent the views or opinions of Gate. The content displayed on this page is for reference only and does not constitute any financial, investment, or legal advice. Gate does not guarantee the accuracy or completeness of the information and shall not be liable for any losses arising from the use of this information. Virtual asset investments carry high risks and are subject to significant price volatility. You may lose all of your invested principal. Please fully understand the relevant risks and make prudent decisions based on your own financial situation and risk tolerance. For details, please refer to
Disclaimer.
Related Articles
Geopolitical Turmoil! Dalio Declares "Gold is the Only True God," but Its Safe-Haven Performance Trails Bitcoin
As geopolitical tensions in the Middle East escalate, Bridgewater founder Ray Dalio questions Bitcoin and reaffirms gold as the preferred safe haven. Nevertheless, gold prices fell accordingly, while Bitcoin only experienced a slight correction, indicating that the correlation between the two is weakening. Dalio doubts Bitcoin's transparency and future risks, but he still maintains a small allocation of Bitcoin for diversification.
区块客16m ago
Interest in altcoins cools down: Can Ethereum trigger a new altcoin season?
The market is forcing investors to bring risk management back to the center.
From a technical perspective, the inflow of funds over the past week has driven
TapChiBitcoin18m ago
Aster Price Nears $0.79 Breakout as Reversal Pattern Strengthens
Key Insights
Aster price structure shows an inverse head and shoulders pattern forming beneath $0.79 resistance, signaling growing buying pressure and possible trend reversal ahead.
Repeated tests of the $0.79 neckline suggest weakening selling pressure as buyers steadily absorb supply
CryptoFrontNews3h ago
The HYPE price could surge despite the upcoming $2.8 million short squeeze.
The recent price movements of Hyperliquid (HYPE) are characterized by stagnation around 30 USD. A symmetrical triangle pattern indicates potential for a breakout in either direction, but market sentiment is cautious. Short squeeze risks may boost prices, while weak market flow and deteriorating demand pose challenges. The token could face significant support levels if it dips below 30 USD. An improved market sentiment could lead to a breakout above 33 USD, sparking recovery momentum.
TapChiBitcoin3h ago
Ethereum Price Holds Key Support: Is $2,200 the Next Test for ETH?
March 6, 2026 7:15 pm EST
TheCoinRepublic5h ago
Cardano Price Trends: Bulls Eye Opportunity as Indicator Flashes Green
ADA: Trading near $0.27, facing resistance at $0.28 and support at $0.26.
Technical Indicators: RSI and MACD show weak momentum, signaling short-term consolidation and cautious trading.
Macro Outlook: Rising PMI and historical patterns suggest potential bullish rebound if resistance
CryptoNewsLand5h ago