It is a war of the Bitcoin banana narrative as market veteran Peter Brandt shares conflicting views with an executive from leading asset manager Fidelity.
Brandt particularly called out Jurrien Timmer, who is the director of global macro at Fidelity, for the outlook from his own version of the Bitcoin banana chart. The market veteran called the chart “food from Aruba,” taunting that it looks fabulous.
Key Points
- It is a war of the Bitcoin banana narrative as market veteran Peter Brandt shares conflicting views with an executive at leading asset manager Fidelity.
- Brandt particularly called out Jurrien Timmer, who is the director of global macro at Fidelity, for the outlook from his own version of the Bitcoin banana chart.
- His chart shows that the apex cryptocurrency is near the banana peel—marked in green and has historically aligned with its base—and should fall into it, as in past cycles.
- The Fidelity chart shows that Bitcoin is in a corrective phase but marks $60,000 as a possible bottom.
War of the Bitcoin Banana Chart
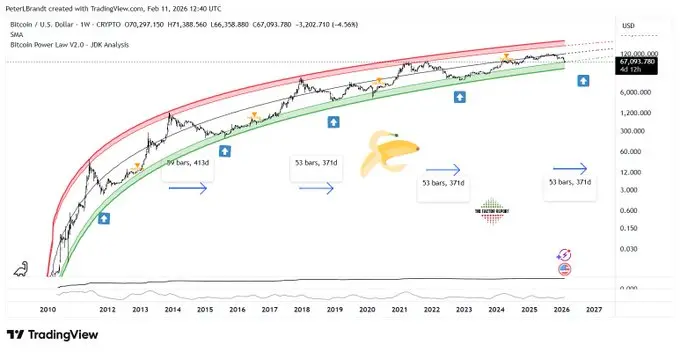 Peter Brandt’s Bitcoin Banana ChartThe veteran trader has been big on this structure, as it has formed his narrative that Bitcoin could revisit multi-year lows to find support before any further bullish break. His chart shows that the apex cryptocurrency is near the banana peel—marked in green and has historically aligned with its base—and should fall into it, as in past cycles.
However, he shared another version of the Bitcoin banana chart from Timmer in the tweet. While the Fidelity exec’s exposition does not explicitly regard the graph as a banana chart, it shared similarities in shape.
Conflicting Stance
The Fidelity chart, titled “Bitcoin’s Road to Maturity,” highlights how the asset has progressed since its inception. It shows that Bitcoin is currently in a corrective phase but marks $60,000 as a possible bottom.
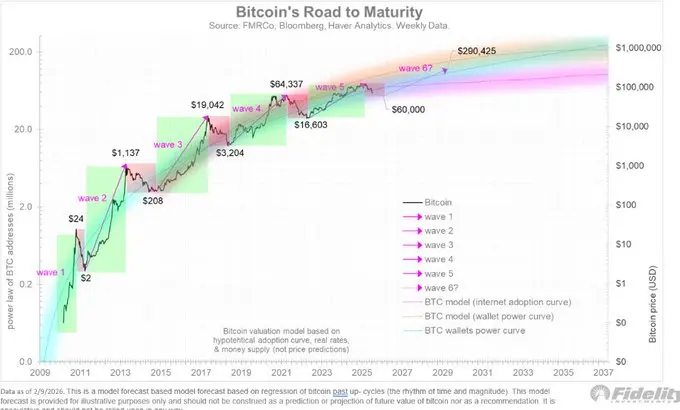 Fidelity Bitcoin Maturity ChartFrom there, it expects the pioneering cryptocurrency to enter wave 6, targeting a new all-time high of $290,456. While Brandt did not dispute the possibility of this price, he finds its nearly immediate broadening outlook contentious.
The Fidelity chart suggests an expansion in the near term as BTC nears its bottom, while Bandt predicts a further downward trend. The conflicting views led to Brandt’s “playing around” comment.
$42,000 BTC Target?
From there, he sees a “hop, skip, and jump,” insinuating a massive rebound, possibly to unprecedented prices. Notably, there is no guarantee that BTC will drop that low, as some industry leaders have argued it will not experience a steep decline as in past cycles, given its curtailed uptrend during the bull season.
Disclaimer: The information on this page may come from third parties and does not represent the views or opinions of Gate. The content displayed on this page is for reference only and does not constitute any financial, investment, or legal advice. Gate does not guarantee the accuracy or completeness of the information and shall not be liable for any losses arising from the use of this information. Virtual asset investments carry high risks and are subject to significant price volatility. You may lose all of your invested principal. Please fully understand the relevant risks and make prudent decisions based on your own financial situation and risk tolerance. For details, please refer to
Disclaimer.