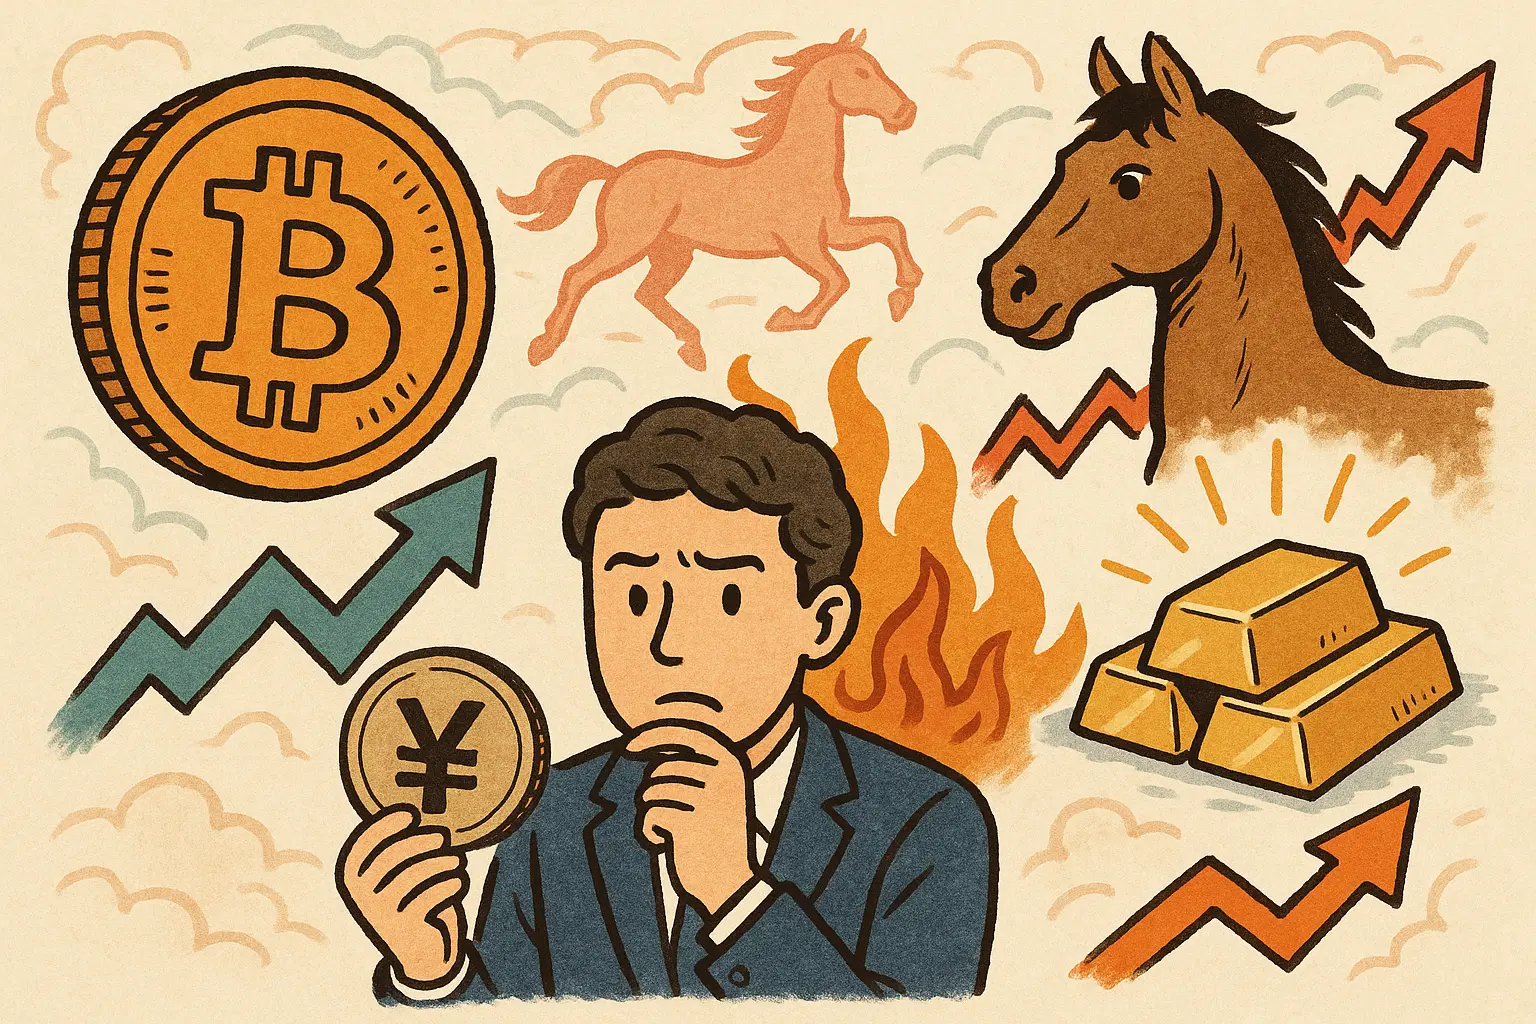
In 2026, the Year of the Horse, the Bank of Japan raises interest rates, triggering yen carry trade unwinding that causes volatility in gold and Bitcoin. Over the past decade, Bitcoin has returned 26,931.1%, while gold has gained 7%. In terms of market capitalization, gold is valued at 12-14 trillion USD, and Bitcoin at 1.74 trillion USD. The unwinding of carry trades explains the short-term plunge in Bitcoin, but both assets have risen in the long term, reflecting a search for fiat currency alternatives. Gold is tangible, with central banks increasing their holdings by 2-3% annually, while Bitcoin is an intangible, decentralized asset capped at 21 million coins.
Decoding the Impact of Yen Carry Trade Unwinding
Many investors watching the price swings wonder: “Bitcoin has dropped so much, can it still be considered a hedge asset?” This confusion stems from a misunderstanding of the yen carry trade mechanism. Historically, many institutional investors borrowed low-interest yen to buy high-yield assets like Bitcoin, a practice known as yen carry trade. When Japan maintains negative or zero interest rates, borrowing yen is nearly free, allowing investors to leverage funds into high-return assets and profit from the interest rate differential.
When Japan raises interest rates, borrowing costs increase, forcing institutions to sell Bitcoin to repay yen loans, causing short-term selling pressure. While this results in a dip, it also indicates that Bitcoin has become part of mainstream global asset allocation, similar to gold, both influenced by macroeconomic policies. This demonstrates that Bitcoin has entered the “institutional investment era,” no longer dominated by retail speculation.
The scale of yen carry trades is enormous, estimated at over hundreds of billions of dollars. When the Bank of Japan announces rate hikes, these leveraged positions must be unwound quickly, causing significant market volatility. Bitcoin, with its 24/7 trading and high liquidity, is among the easiest assets to liquidate rapidly, making it the first to be affected during unwinding. Gold, although impacted, has a much larger market size (12-14 trillion USD vs. 1.74 trillion USD for Bitcoin), so similar-scale sell-offs have a relatively smaller impact on its price.
However, looking further into the future, data from Bloomberg Professional reveals a deeper trend: amid ongoing US-China trade tensions and rising global debt, investors are collectively seeking alternatives to fiat currencies. Both gold and Bitcoin show long-term upward trajectories. Their synchronized rise suggests they serve as “fiat hedging tools,” though with different risk-return profiles.
Comprehensive Comparison: Bitcoin vs. Gold
Gold’s physical nature is its most obvious feature—you can hold it, feel its weight and temperature. Bitcoin, on the other hand, is a digital asset stored on the internet and computers, protected by complex cryptography. This fundamental difference results in distinct user experiences: gold requires physical safekeeping with theft risk, while Bitcoin only requires remembering private keys or seed phrases but faces hacking risks.
Although the gold market is global, it remains heavily influenced by governments, central banks, and large financial institutions. Central banks and governments hold substantial gold reserves, which can influence market prices through buying and selling. In contrast, Bitcoin is designed to be decentralized, distributed among millions of holders worldwide, with no single entity controlling its issuance or operation.
Mining mechanisms are also key. Gold is mined from deep within the Earth, increasing supply by about 2-3% annually, with the total amount of gold on Earth being finite but the exact upper limit unknown. Bitcoin is created through mining—solving complex mathematical problems with computers—and its issuance halves approximately every four years until reaching a maximum of 21 million coins. This supply mechanism ensures slow, steady growth in gold supply, while Bitcoin’s supply growth slows over time, ultimately reaching a fixed cap.
Key Data Comparison: Bitcoin vs. Gold
Past 10-year returns: Bitcoin 26,931.1% (annualized 38.74%) vs. gold 7%
Market cap: gold 12-14 trillion USD vs. Bitcoin 1.74 trillion USD
Daily trading volume: gold 130-150 billion USD vs. Bitcoin 30-50 billion USD
Liquidity: gold is balanced between OTC and exchange markets vs. Bitcoin’s 24/7 global trading
Volatility: gold relatively stable vs. Bitcoin highly volatile
Asset Allocation Strategies for 2026
In today’s economic environment, the importance of safe-haven assets is increasing: escalating geopolitical tensions, persistent inflation, and uncertainties in traditional currencies and financial systems. These factors drive more investors to seek assets that preserve value amid market turbulence. In 2026, should one favor the security of physical gold or the high growth potential of digital gold Bitcoin?
Asset allocation is undergoing a major transformation: traditional safe-haven gold faces a formidable digital challenger—Bitcoin. Although both are viewed as inflation hedges and tools against currency devaluation, their fundamental differences require investors to make informed choices. Conservative investors may prefer gold for stability and proven track record, suitable as a core hedge. Risk-tolerant investors might lean toward Bitcoin for its high growth potential but must accept high volatility.
A balanced approach could be optimal—allocating according to risk appetite. For example, a portfolio of 60% gold and 40% Bitcoin offers both the stability of gold and the growth potential of Bitcoin. As age and wealth change, dynamically adjusting the ratio makes sense: increasing Bitcoin exposure when young, shifting toward more gold as retirement approaches.
Disclaimer: The information on this page may come from third parties and does not represent the views or opinions of Gate. The content displayed on this page is for reference only and does not constitute any financial, investment, or legal advice. Gate does not guarantee the accuracy or completeness of the information and shall not be liable for any losses arising from the use of this information. Virtual asset investments carry high risks and are subject to significant price volatility. You may lose all of your invested principal. Please fully understand the relevant risks and make prudent decisions based on your own financial situation and risk tolerance. For details, please refer to
Disclaimer.