
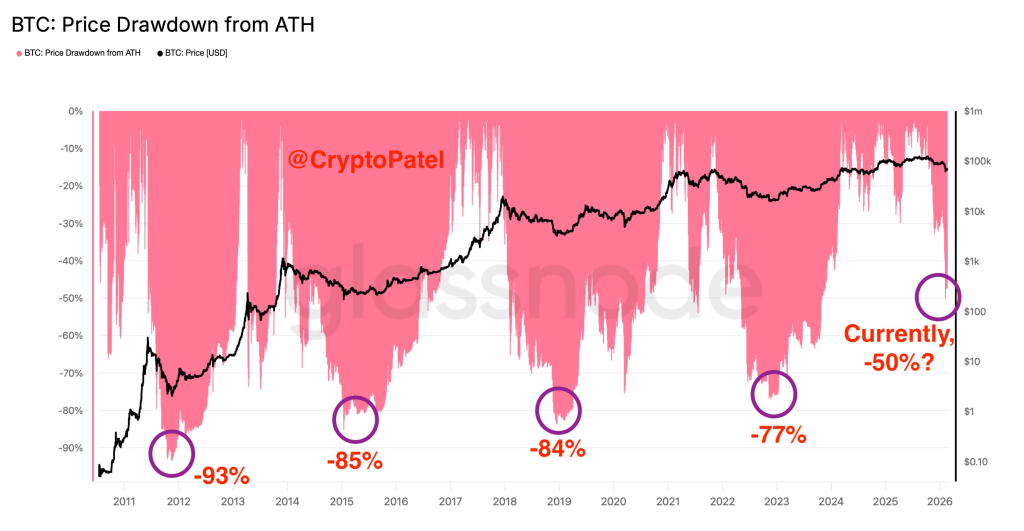
The chart shared by Crypto Patel puts Bitcoin’s current drawdown into long-term perspective by mapping every major peak-to-trough decline since 2011. What immediately stands out is not just how brutal past bear markets were, but how consistently Bitcoin has tested investor conviction before resetting for the next cycle. Compared to earlier crashes, today’s pullback still sits on the shallow end of Bitcoin’s historical spectrum.
The pink area on the chart tracks Bitcoin’s percentage drawdown from its all-time high, overlaid with the BTC price itself. Previous cycle lows were extreme: roughly -93% in 2011, -85% in 2015, -84% in 2018, and -77% in 2022. In contrast, the current cycle is hovering near a -50% drawdown, which is materially less severe than any prior major bottom. From a purely historical standpoint, that suggests Bitcoin has not yet experienced the type of capitulation that has defined past cycle lows.
Crypto Patel’s key observation is valid: each cycle’s maximum drawdown has become less aggressive over time. That trend aligns with Bitcoin’s maturation, deeper liquidity, broader ownership, and increasing institutional participation. However, the chart also delivers an uncomfortable reality check. Even if this cycle continues the pattern of “shallower” losses, a move toward a -70% drawdown would still be well within historical norms, and that would place Bitcoin near the $30,000 zone from current levels.
Source: X/@CryptoPatel
The most important takeaway is not a price prediction, but a framework. Bitcoin does not bottom quietly. Every prior cycle required prolonged pain, time, and psychological exhaustion before a durable low formed. The absence of a deep drawdown does not invalidate the bull thesis long-term, but it does indicate that downside scenarios remain very much alive. Markets rarely reward complacency, especially during transitions between expansion and contraction phases.
Crypto Patel’s conclusion is less about fear and more about preparation. History shows that Bitcoin survives every storm, but not everyone holding it does. Planning for multiple outcomes, including deeper volatility, has historically been the difference between forced exits and long-term survival. If this cycle ultimately bottoms at a higher level than the past, that will be constructive. Until proven otherwise, though, the chart argues for respect (not confidence) in what Bitcoin is still capable of doing on the downside.
Read also: Robert Kiyosaki Buys Another Bitcoin at $67,000 as BTC Price Shows Recovery Signs
Disclaimer: The information on this page may come from third parties and does not represent the views or opinions of Gate. The content displayed on this page is for reference only and does not constitute any financial, investment, or legal advice. Gate does not guarantee the accuracy or completeness of the information and shall not be liable for any losses arising from the use of this information. Virtual asset investments carry high risks and are subject to significant price volatility. You may lose all of your invested principal. Please fully understand the relevant risks and make prudent decisions based on your own financial situation and risk tolerance. For details, please refer to
Disclaimer.
Related Articles
A newly created wallet deposits 2 million USDC into Hyperliquid to open short positions on BTC and ETH.
Gate News Report, March 8th: According to Onchain Lens monitoring, a newly created wallet deposited 2 million USDC into Hyperliquid, opened a 5x leveraged BTC short position and a 20x leveraged ETH short position, with the current position value approximately equivalent to 10 million USD.
GateNews25m ago
PI Network Price Jumps 15% as Volume Rises But $0.28 Holds the Real Answer - BTC Hunts
The post PI Network Price Jumps 15% as Volume Rises But $0.28 Holds the Real Answer appeared first on Coinpedia Fintech News
The PI Network price is suddenly back on traders’ radar this weekend. Not because it exploded into a massive rally but because something subtler is happening beneath the
BTCHUNTS1h ago
CryptoQuant Analyst: Bitcoin NUPL-MVRV indicator reaches 0.33, indicating that extreme selling conditions are moderating
Gate News Announcement, March 8 — CryptoQuant analyst Axel posted on X platform that Bitcoin may have entered the mid-stage of this bear market cycle. Data shows that the NUPL–MVRV harmonic composite indicator has reached 0.33, while historical cycle bottoms typically occur around the -0.5 level. The chart indicates that the start of the bear market cycle is trending upward, suggesting that extreme selling conditions are moderating. However, the indicator remains well above historical bottom levels, indicating that a full-scale market sell-off has not yet been confirmed.
GateNews1h ago
Bitcoin Investment: Data Shows No Profit for 3+ Years
Bitcoin (CRYPTO: BTC) has long carried a reputation for punishing late entrants, with double-digit drawdowns that test even patient investors. Yet a closer look at cycle-era history suggests that time, not timing, often determines whether red ink becomes green in the long run. Across
CryptoBreaking1h ago
Altcoin Clock Is Ticking: 5 Explosive Coins Traders Eye for 500% Breakouts as Alts Start Outrunning BTC
Several altcoins are gaining attention as traders observe periods where altcoin momentum temporarily exceeds Bitcoin performance.
Bittensor and Render stand out in decentralized AI and GPU computing infrastructure sectors.
Near Protocol, Virtuals Protocol, and Bonk
CryptoNewsLand1h ago
Bitcoin Bulls on Edge – the Massive $70 Million Liquidation Trap At $54,000
Currently, the crypto markets are dealing with extremely volatile conditions and there are technical indicators that say that the market could be under a “long squeeze” which could change the direction of the digital asset over a short period of time. A recent technical analysis performed by market
BlockChainReporter2h ago