Record-low RSI and a 50% OI drop signal deep stress as ETF outflows weaken institutional support.
Bitcoin has printed one of the most extreme technical readings in its history. Momentum has collapsed to levels never recorded on the weekly timeframe. As spotted by Ash Crypto, weekly RSI has fallen below every prior macro panic event. Notably, the current conditions place Bitcoin in rare statistical territory.
Historic RSI Breakdown Meets 50% Open Interest Collapse in Bitcoin Market
Trading near $64,000, Bitcoin’s weekly RSI has dropped into the mid-20s. That reading sits below levels seen during the Mt. Gox collapse, 2018 bear market bottom, March 2020 COVID crash, and 2022 FTX selloff.
BITCOIN JUST MADE HISTORY.
But it’s not something we all wanted.
Bitcoin weekly RSI has just reached its lowest level in history.
– Lower than tariffs Crash
– Lower than the FTX crash
– Lower than the Covid Crash
– Lower than the 2018 bottom
– Lower than the Mt. Gox hack… pic.twitter.com/HRWQZD0GRY
— Ash Crypto (@AshCrypto) February 24, 2026
Historically, major cycle lows have formed when the weekly RSI reached the 30–35 range. Even during capitulation phases, readings rarely stayed under 30 for long. Current compression marks an outlier in Bitcoin’s price history.
Derivatives data shows clear stress across the market. Open interest across exchanges has dropped from around $45–47 billion at the 2025 highs to about $21 billion. That is a decline of more than 50%. As a result, many traders have closed or been forced out of their positions, even though the price is still well above past-cycle lows.
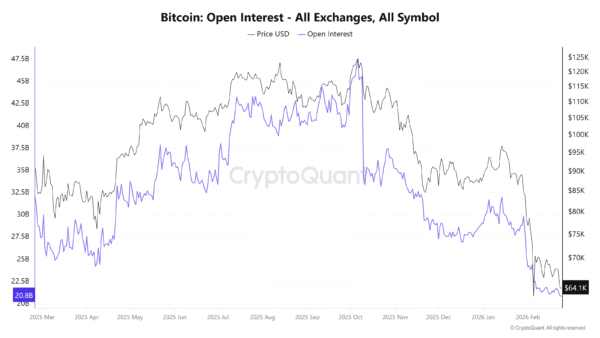
_Image Source: _CryptoQuant
At the same time, liquidations have removed excess risk faster than the spot price has fallen. In previous cycles, sharp drops in open interest were often followed by large price moves. However, direction usually depended on whether strong spot buying returned.
BTC Faces Multi-Timeframe Pressure as Valuation Nears Long-Term Support
On-chain data shows more pressure building, but not full capitulation. As per data, the MVRV ratio has dropped to around 1.1, which is close to long-term value support. In past cycles, market tops formed above 2.5. Meanwhile, normal mid-cycle conditions ranged between 1.5 and 2.0. Capitulation usually appeared near 1.0.
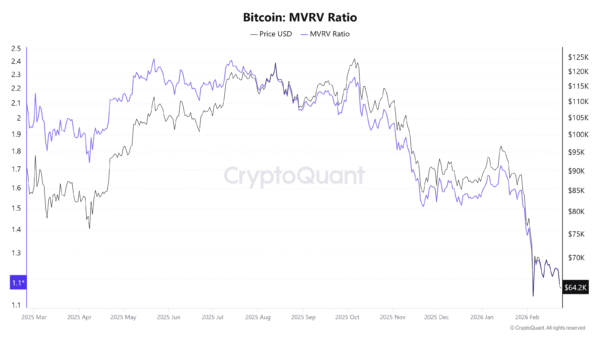
_Image Source: _CryptoQuant
At current levels, Bitcoin is trading close to the average cost basis of holders. However, it has not fallen below 1.0, where deeper loss conditions and stronger long-term bottoms often form.
At the same time, institutional flows look weaker than in past resets. Spot Bitcoin ETFs have seen about $1.2 billion in monthly net outflows. As the price declined, total net assets also moved lower.
During the 2024–2025 rally, steady ETF inflows helped push prices higher. Now, price is falling while flows remain negative. As a result, institutional demand appears to be slowing rather than returning.
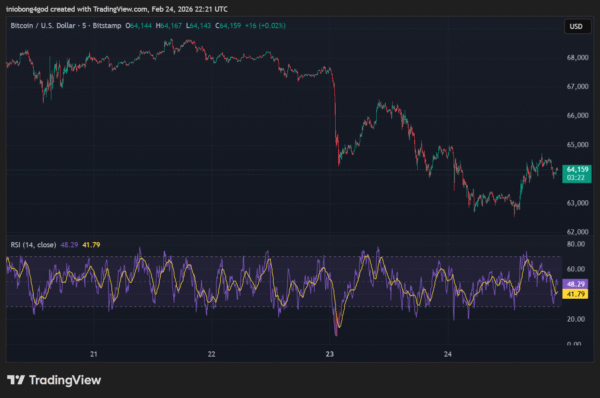
_Image Source: _TradingView
Short-term momentum is starting to stabilize. The five-hour RSI recently dropped into oversold levels, then bounced back toward neutral. As a result, immediate selling pressure seems to have eased around the $64,000 area.
However, higher timeframes remain deeply oversold. So while short-term pressure has cooled, longer-term momentum is still very weak, creating tension across multiple timeframes.
Disclaimer: The information on this page may come from third parties and does not represent the views or opinions of Gate. The content displayed on this page is for reference only and does not constitute any financial, investment, or legal advice. Gate does not guarantee the accuracy or completeness of the information and shall not be liable for any losses arising from the use of this information. Virtual asset investments carry high risks and are subject to significant price volatility. You may lose all of your invested principal. Please fully understand the relevant risks and make prudent decisions based on your own financial situation and risk tolerance. For details, please refer to
Disclaimer.
Related Articles
Data: 155.22 BTC transferred from an anonymous address, worth approximately 11.09 million USD
ChainCatcher reports that, according to Arkham data, at 00:43, 155.22 BTC (worth approximately $11.09 million) was transferred from an anonymous address (starting with 1AkTDtK7...) to another anonymous address (starting with 1NErFWRW...).
GateNews1h ago
Bitcoin Poised for Next Leg Down as $73K Precedes Death Cross
Bitcoin is navigating a delicate chart landscape as traders weigh the risk of a protracted bear cycle against the possibility of a renewed bounce. After a March rally, market watchers say a sustained move higher will require a meaningful bullish catalyst to overcome persistent resistance and the wei
CryptoBreaking1h ago
Bitcoin Price Predictions Flip Bullish, But Ethereum Is Still Stuck
Predictors have turned bullish on Bitcoin's near-term price, suggesting a rise to $84,000 before a potential drop. However, analysts remain divided on sustainability, while sentiment for Ethereum is bearish, with expectations of a decline to $1,500.
Decrypt1h ago
Data: In the past 24 hours, the entire network has liquidated $339 million, with long positions liquidated at $182 million and short positions at $157 million.
ChainCatcher reports that, according to Coinglass data, the total liquidations across the entire network in the past 24 hours amounted to $339 million, with long positions liquidated at $182 million and short positions at $157 million. Among these, Bitcoin long positions were liquidated at $67.776 million, Bitcoin short positions at $69.678 million, Ethereum long positions at $38.385 million, and Ethereum short positions at $50.239 million.
GateNews1h ago
BTC 15-minute sharp decline of 0.90%: liquidity gap area and macro risk aversion resonate, triggering short-term selling pressure
On March 5, 2026, from 16:00 to 16:15 (UTC), Bitcoin (BTC) experienced a -0.90% return within a short time window, with the price ranging from 70,800.8 to 71,653.9 USDT, and an amplitude of 1.19%. This anomaly occurred amid heightened market attention, with volatility significantly increasing, investor sentiment turning cautious, and trading volume and on-chain activity remaining high, intensifying short-term trading pressure.
The main driver of this anomaly is that BTC is in a "gap zone" — meaning liquidity above 72,000 USDT is extremely thin, with only about 1% of circulation.
GateNews2h ago

