
Hedera (HBAR) is in the news again, but the price chart still looks unsure. A senior U.S. transportation official recently secured a patent for a nationwide road usage system that runs on decentralized ledger technology and is compatible with Hashgraph. That is a serious use case tied to public infrastructure, not just crypto speculation.
However, the HBAR price slipped toward $0.10 as Bitcoin weakened. The market pulled back across the board, and HBAR followed. Volume eased slightly, hinting that aggressive selling may be slowing down.
So there’s a split picture right now: long-term utility talk on one side, short-term technical pressure on the other.
- Hedera Price Is Holding a Thin Line Near $0.10
- What the Indicators Are Saying
- HBAR Price Targets This Week
Hedera Price Is Holding a Thin Line Near $0.10
On the 4H chart, HBAR has been drifting lower for months. Each of the bounces has been smaller than the previous one. Price fell towards the $0.072 price level before rising again and finding support just under the $0.10 price level.
Right now, the price levels around $0.088-$0.10 are the levels to watch. The HBAR price is sitting almost exactly on it. That tells us buyers are defending this level, but not with much strength. The structure is flat, not impulsive. It looks more like a pause than a breakout.
There is also clear resistance above. The $0.11–$0.12 area has rejected the price several times. Until HBAR price breaks clean through the $0.12 price level, the trend is still weak. The chart isn’t falling, but it isn’t strong either.
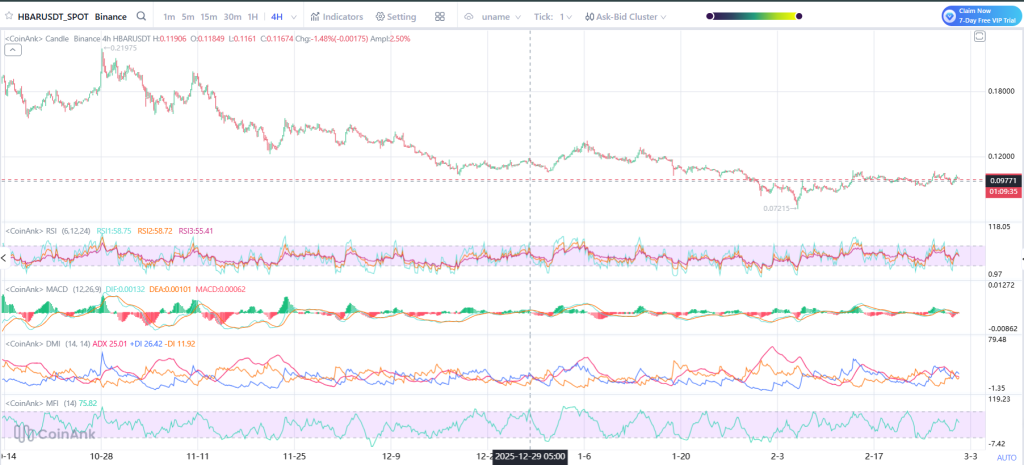
Source: Coinank
What the Indicators Are Saying
RSI is sitting around the middle range. It is not oversold and not overheated. That means there is room to move either way. Momentum is neutral.
MACD is close to flipping negative. The histogram bars are small. That shows there is no strong push from buyers right now. Direction is unclear.
DMI shows buyers and sellers are close, with no clear dominance. MFI is elevated but not extreme, which means money is flowing in and out without strong conviction.
Overall, the indicators point to consolidation. The market is waiting.
_****ChatGPT Predicts the Price of Cardano and Polkadot If the CLARITY Act Passes**
HBAR Price Targets This Week
If HBAR can continue to trade above the $0.088 to $0.10 area, the next area of interest would be the $0.11 level, with a break through the $0.12 level potentially leading to a move towards the $0.135 area.
If momentum builds beyond that, $0.15 becomes the next larger target from previous structure.
On the downside, losing $0.088 would expose $0.072 again. If that level fails, the next area sits near $0.065.
For now, the HBAR price is trying to stabilize. The government patent story adds weight to the long-term case, but this week depends on whether price can push back above $0.12 or slips under support again.
Disclaimer: The information on this page may come from third parties and does not represent the views or opinions of Gate. The content displayed on this page is for reference only and does not constitute any financial, investment, or legal advice. Gate does not guarantee the accuracy or completeness of the information and shall not be liable for any losses arising from the use of this information. Virtual asset investments carry high risks and are subject to significant price volatility. You may lose all of your invested principal. Please fully understand the relevant risks and make prudent decisions based on your own financial situation and risk tolerance. For details, please refer to
Disclaimer.
Related Articles
CryptoQuant Analyst: Bitcoin NUPL-MVRV indicator reaches 0.33, indicating that extreme selling conditions are moderating
Gate News Announcement, March 8 — CryptoQuant analyst Axel posted on X platform that Bitcoin may have entered the mid-stage of this bear market cycle. Data shows that the NUPL–MVRV harmonic composite indicator has reached 0.33, while historical cycle bottoms typically occur around the -0.5 level. The chart indicates that the start of the bear market cycle is trending upward, suggesting that extreme selling conditions are moderating. However, the indicator remains well above historical bottom levels, indicating that a full-scale market sell-off has not yet been confirmed.
GateNews7m ago
Polkadot to Reset Tokenomics on March 12 With Major DOT Supply and Staking Changes
Polkadot will introduce a new monetary framework on March 12 that sets DOT’s supply cap at 2.1 billion and lowers emissions by 53.6%.
The overhaul will also create a Dynamic Allocation Pool and shorten the DOT unbonding period from 28 days to 24–48 hours.
On March 12, Polkadot will reset
CryptoNewsFlash4h ago
Bitcoin May Be Closer to a Bottom Than Most Think, Chart Signals
The Bitcoin price slipped about 2% today, trading slightly below $68,000 after pushing above $73,000 earlier this week, as already covered on our site. The move added fresh pressure to a market that still feels shaky, especially after several failed attempts to hold higher levels.
Still, not e
CaptainAltcoin4h ago
Dogecoin Monthly Breakdown Pattern Reappears as Price Tests $0.0918
Dogecoin is currently trading at $0.09205 at a gain of 2.3, with support of above $0.08878.
As can be seen in the monthly chart, there are recurring breakdown areas that have been followed by significant expansions in price.
The short-term trading range is narrow and the immediate point o
CryptoNewsLand4h ago
Solana Eyes $90.6 Trigger Point as $83 Support Holds and Liquidation Pressure Builds
A large cluster of short positions faces liquidation if SOL reaches $90.6, potentially increasing volatility.
SOL trades between $83.00 support and $89.58 resistance, keeping price action compressed in the short term.
SOL posts a 0.8% daily gain and rises 0.7% against BTC, holding
CryptoNewsLand4h ago
Crypto Market Plunges As Extreme Fear Controls Investor Sentiment
The global crypto market is notably bearish, with a 2.93% drop in market capitalization to $2.32T. Bitcoin and Ethereum saw decreases of 3.07% and 4.01%, respectively. Meanwhile, notable gainers include $XBTC, $TRUMP, and $PEPE. DeFi TVL and NFT sales also declined significantly, while key investments from YZi Labs and Kazakhstan's central bank emerged.
BlockChainReporter5h ago