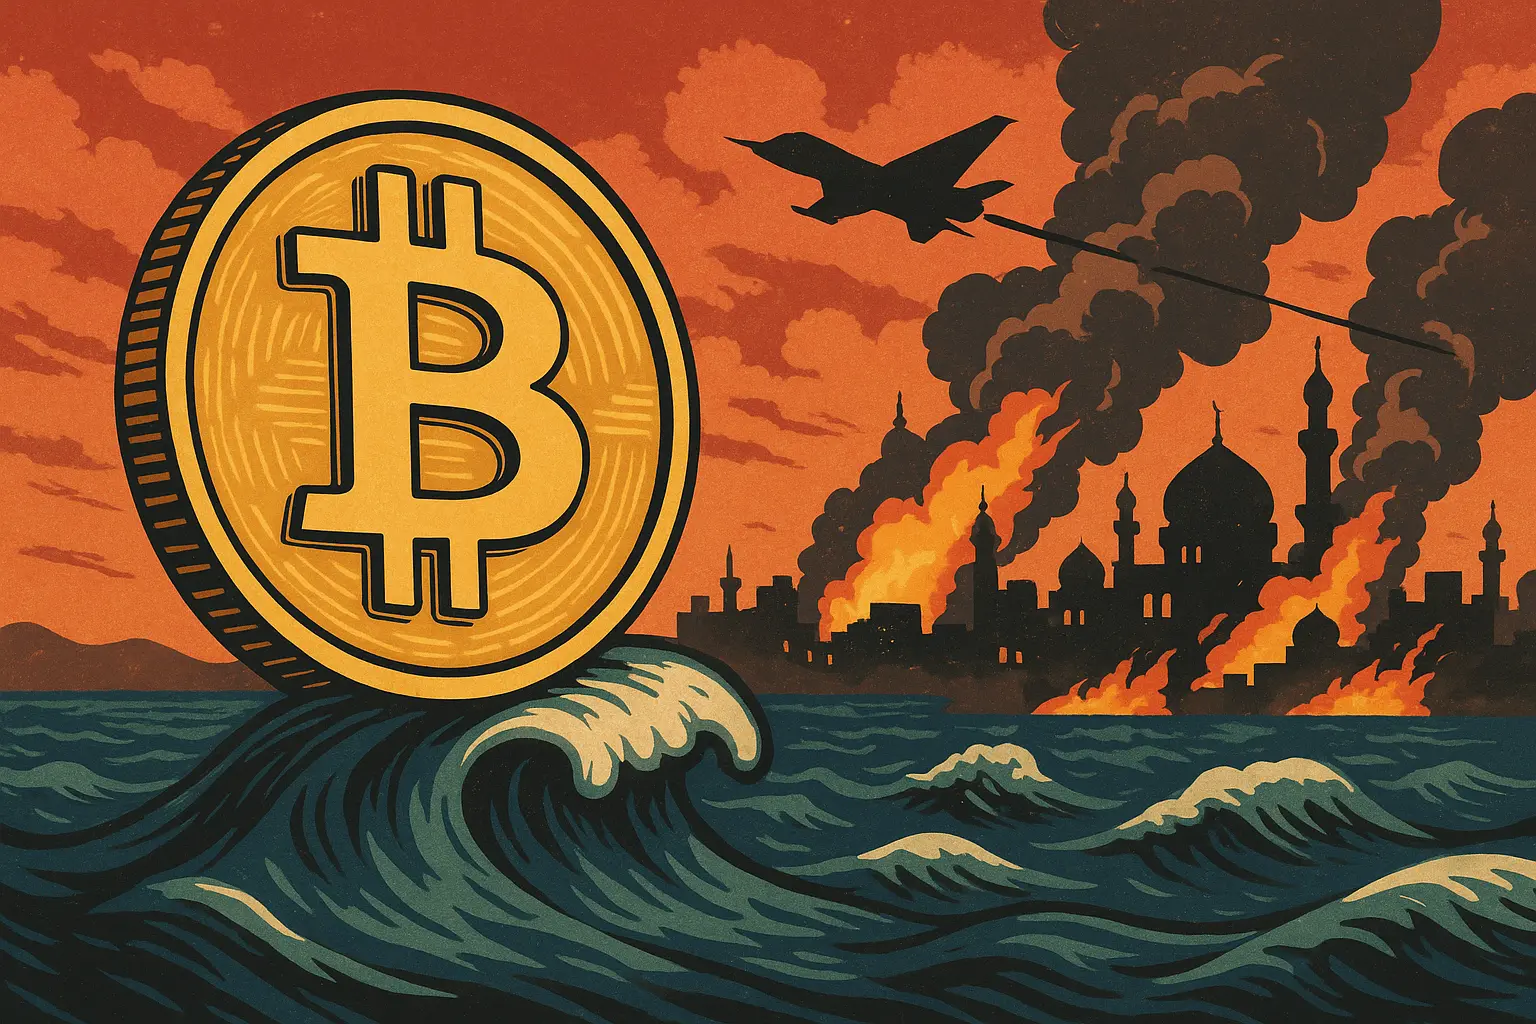
As the US-Iran military conflict continues to escalate, Bitcoin has not followed the previous pattern of sharp declines caused by geopolitical shocks. Over the weekend, it remained relatively stable around $67,000, indicating that the market has already priced in the main geopolitical risks. Crypto trader BitBull interprets the three-day trend chart, stating that “resistance has turned into support,” and expects Bitcoin to rebound to $73,000–$74,000.
The Resilience of Bitcoin: Geopolitical Risks Have Been “Digest”
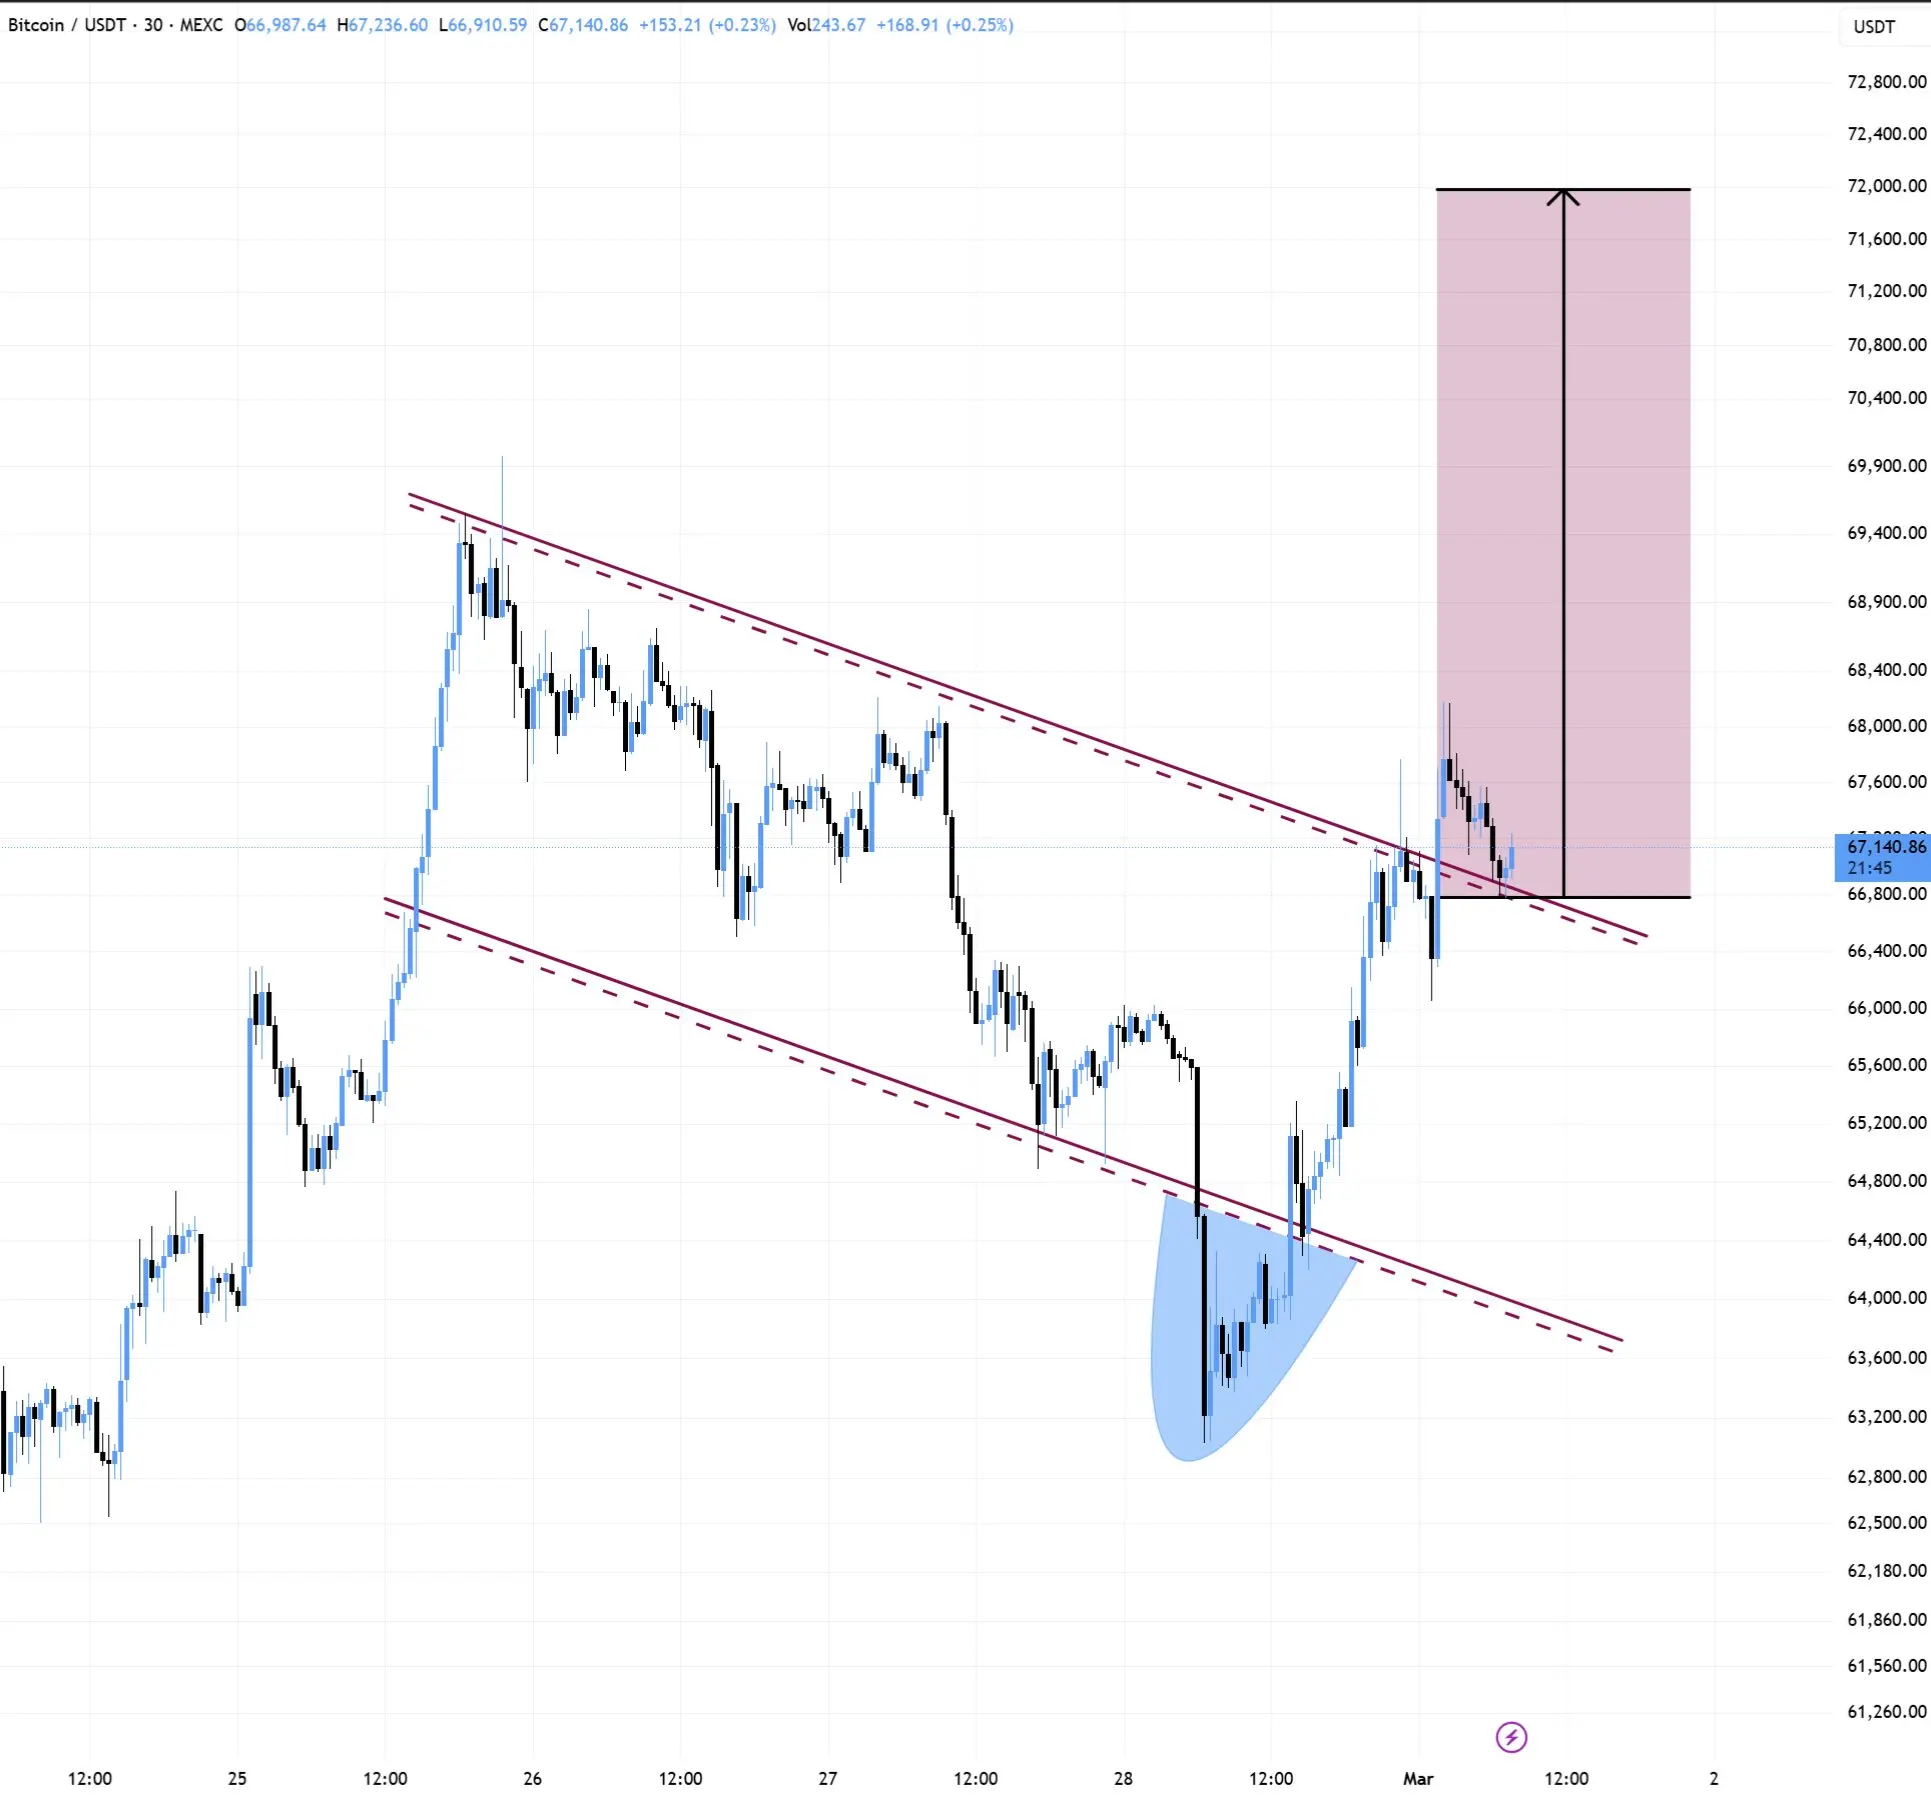
(Source: Trading View)
Over the weekend, President Trump confirmed in an exclusive interview with the Daily Mail that three US service members were killed during operations against Iran, and hinted that the conflict could last about four weeks. Iran issued a threat to block the Strait of Hormuz, causing US stock futures to fall by 0.65% over the weekend.
However, Bitcoin’s reaction was completely different. After a brief fluctuation, the crypto market quickly stabilized, with BTC/USD remaining within a local range and no breakthrough decline. Some market participants believe that the worst-case scenario of the Iran conflict has already been fully reflected in previous pricing, so the new developments did not trigger additional selling.
Three Main Reasons for Bitcoin’s Rise Today
Geopolitical Risks Already Digested: The market believes the main impact of the Iran conflict was priced in earlier, and weekend news did not cause additional panic.
Technical Support Turned Signal: BitBull points out that the previous resistance zone has turned into effective support, with a bullish three-day chart structure, targeting $73,000–$74,000.
21-Day Moving Average Breakout Expectation: Michaël van de Poppe states that if the 21-day simple moving average (around $67,627) can be broken, it will confirm a medium-term rebound, expected to occur between March and April.
Oil Prices and Inflation Impact: Where Is Bitcoin’s Biggest Downside Risk?
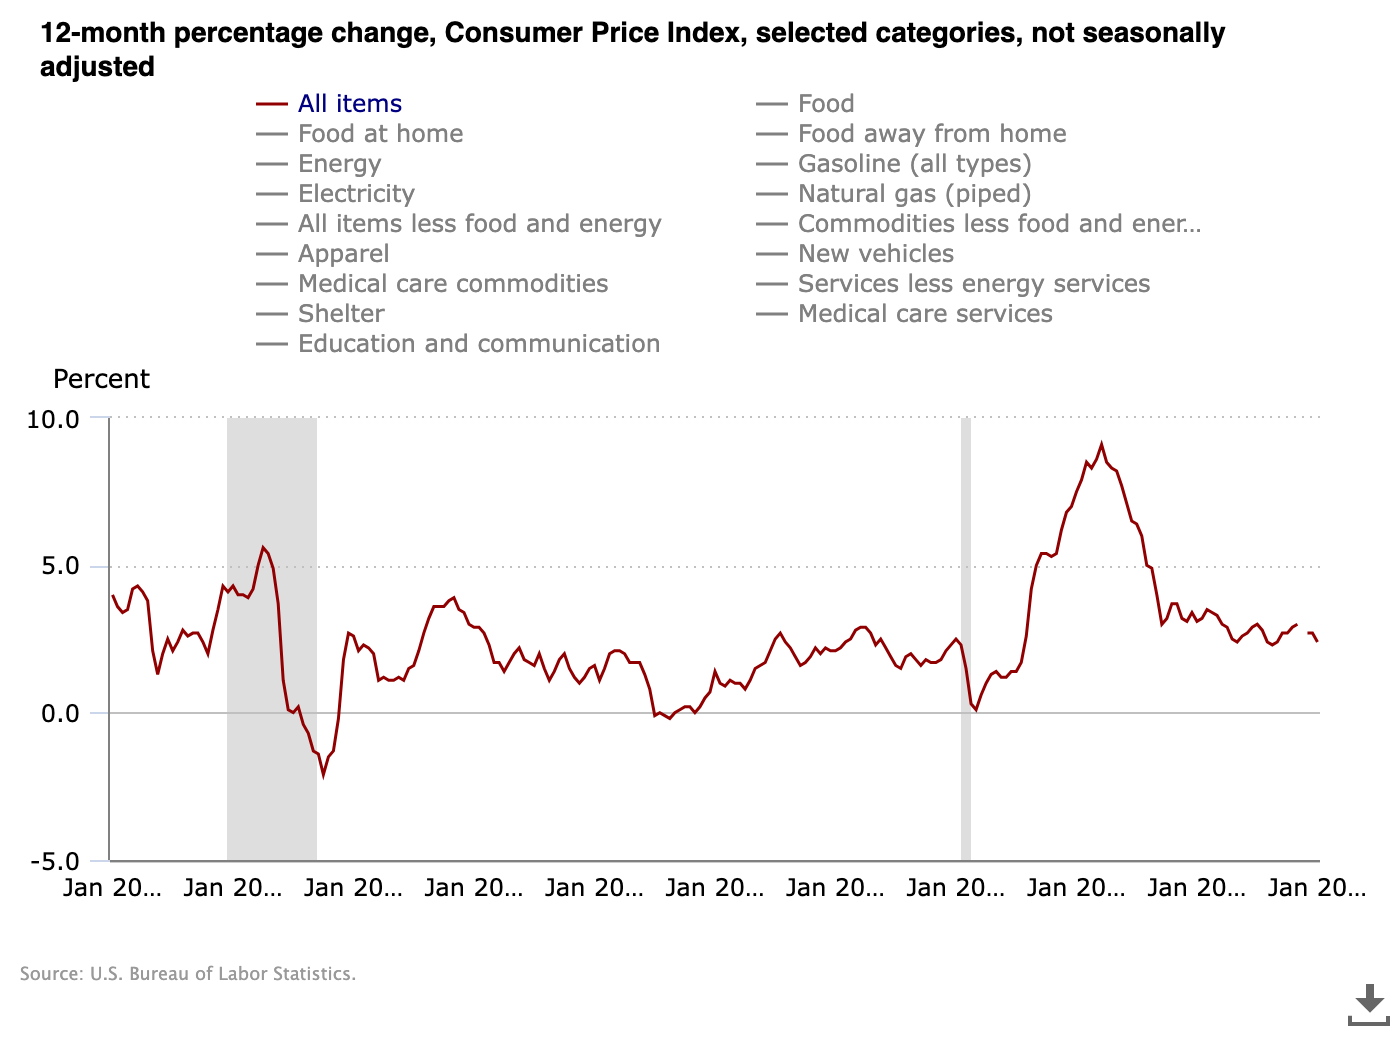
(Source: U.S. Bureau of Labor Statistics)
Although the short-term outlook is relatively optimistic, a key macro risk is brewing. If Iran actually blocks the Strait of Hormuz, global oil prices could surge dramatically. The resource trading platform Kobe Communications cites a JPMorgan research report, stating that a significant rise in oil prices could push US CPI to 5%.
The last time US CPI reached 5% was in March 2023, when the Federal Reserve was in an aggressive rate-hiking cycle, and radical tightening policies heavily suppressed risk assets. Recently, US inflation data has repeatedly exceeded expectations, especially the PPI data released on Friday, which was significantly higher than market estimates. If oil prices continue to climb, the Fed’s dovish expectations will be revised, and Bitcoin will face renewed macro pressure.
Additionally, the Chicago Mercantile Exchange (CME) Bitcoin futures have a downward unfilled gap at $65,880. If US stocks open under pressure tomorrow, this gap could become a short-term magnet for Bitcoin’s decline.
Frequently Asked Questions
Why did Bitcoin rise today?
The market generally believes that the main geopolitical risk from the Iran conflict has already been priced in, and weekend news did not trigger further selling. Several analysts see technical support turning signals, and the breakout of the 21-day moving average provides a basis for a bullish scenario from March to April.
What is Bitcoin’s short-term technical target?
BitBull expects Bitcoin to rebound from current support levels to $73,000–$74,000. The 21-day simple moving average (around $67,627) is a key technical threshold; a successful breakout would confirm the start of a medium-term bull trend.
What is the biggest risk of the Iran conflict for Bitcoin?
The greatest risk comes from rising oil prices fueling inflation expectations. If the Strait of Hormuz is blocked, causing oil prices to spike, US CPI could reach 5%, forcing the Fed to maintain a hawkish stance, which would suppress demand for risk assets like Bitcoin. Additionally, the CME futures gap at $65,880 remains a short-term downward magnet to watch.
Disclaimer: The information on this page may come from third parties and does not represent the views or opinions of Gate. The content displayed on this page is for reference only and does not constitute any financial, investment, or legal advice. Gate does not guarantee the accuracy or completeness of the information and shall not be liable for any losses arising from the use of this information. Virtual asset investments carry high risks and are subject to significant price volatility. You may lose all of your invested principal. Please fully understand the relevant risks and make prudent decisions based on your own financial situation and risk tolerance. For details, please refer to
Disclaimer.
Related Articles
HBAR at a Crossroads: Will $0.095 Support Trigger a Break Toward $0.106?
HBAR is trading at $0.09739 and above the S/R flip of $0.094-$0.096 in the 12H chart.
The nearest resistance will be at $0.10 with a falling trendline pressure at around $0.104-$0.106.
The support is at $0.095835 and a breakdown at the
CryptoNewsLand17m ago
DXY Retest at 99.183: Will 100–101 Break as US Degen Index Stabilizes?
DXY trades at 99.183 while retesting the 100–101 monthly resistance zone.
US Degen Index 6900 sits at $0.0001197 with support at $0.0001175 and resistance at $0.0001214.
A break above 101 on DXY would shift structure higher, while rejection keeps price below key resistance.
The U.
CryptoNewsLand20m ago
PEPE Hovers at Critical $0.053414 Support as $432M Volume Surge Tightens Breakout Watch
PEPE is trading at $0.053416, just above support at $0.053414, with significant trading volume up 22.14%. Resistance is at $0.053676. Despite a slight decrease in price, there’s increased market activity, suggesting potential volatility.
CryptoNewsLand24m ago
Expert Claims Altcoin Metrics Are Being 'Gamed' to Mislead Investors
Crypto researcher Orbion raises concerns over the possible manipulation of key market indicators, including the Altseason Index and Crypto Fear and Greed Index, suggesting that inflated metrics create false optimism and mislead investors about the onset of altcoin season.
Coinpedia1h ago
XRP Holds $1.34 Support as $1.80–$2.00 Becomes 2025 Make-or-Break Zone
XRP is trading at $1.37 and its trading higher than the support of $1.34 but facing a heavy resistance at $1.38.
The critical structural pivot zone of $1.80-2.00 is the critical 2025 structural pivot.
March structure has the targets of $2.78 and 3.60, with anticipated
CryptoNewsLand1h ago
XRP Slides to $1.42 After Losing $1.80–$2 Neckline as $1.39 Support Faces Immediate Test
XRP dropped to less than the $1.80-2 neckline and a key support area became an overhead and the overall trend was altered.
The current short-term trading corridor is between the support and resistance of the asset which is between $1.39 and $1.47 respectively.
A price above $1.39 will
CryptoNewsLand1h ago