
Gold just went through a sharp shakeout. Today, the XAU price dropped nearly $300, catching many traders off guard. But not everyone believes the move marks the start of a deeper slide.
Analyst Shirley argues that the decline may already be complete and expects a rebound into the end of the week. At the center of her view is one key area: $5,000–$5,050.
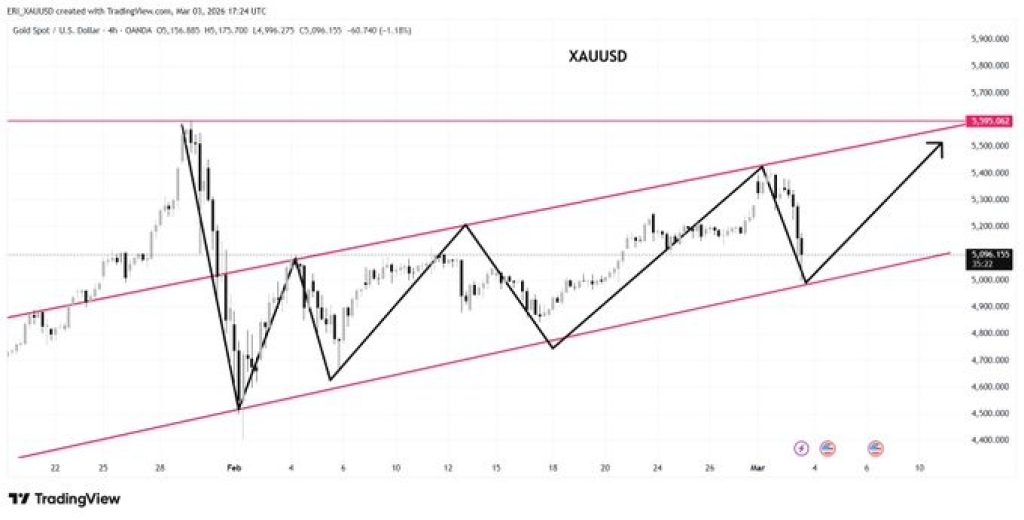
Looking at the chart, gold has been trading inside a rising channel for weeks. Each pullback has found support along the lower boundary of that channel before pushing to new highs. The recent drop sent the Gold price back toward that lower trendline again, right into the $5,000 region.
That area lines up with previous reaction zones and the lower structure of the channel. So far, buyers have stepped in there repeatedly. If this pattern continues, the latest dip could simply be another higher low within an ongoing uptrend.
Source: X/Shirley
Here’s Where Gold Price Could Go
Shirley is looking to add gold between $5,000 and $5,050.
Her thinking is clear. If buyers defend that pocket, price could work its way back toward the top of the rising channel, which comes in around $5,350 to $5,400. That’s the area gold has struggled with before.
If it breaks above that ceiling and stays there, new highs would be within reach.
But if the gold price slips under $5,000 and can’t get back above it, the setup starts to crack. In that case, a slide toward the mid-$4,800s would be on the table.
Even with the recent swings, she hasn’t changed her bigger view. She still sees gold pushing toward $6,300 this year, as long as the wider environment, rising prices, global tensions, and central bank moves, keeps supporting hard assets.
_****3 Stocks To BUY NOW In March 2026**
Disclaimer: The information on this page may come from third parties and does not represent the views or opinions of Gate. The content displayed on this page is for reference only and does not constitute any financial, investment, or legal advice. Gate does not guarantee the accuracy or completeness of the information and shall not be liable for any losses arising from the use of this information. Virtual asset investments carry high risks and are subject to significant price volatility. You may lose all of your invested principal. Please fully understand the relevant risks and make prudent decisions based on your own financial situation and risk tolerance. For details, please refer to
Disclaimer.
Related Articles
PEPE Hovers at Critical $0.053414 Support as $432M Volume Surge Tightens Breakout Watch
PEPE is trading at $0.053416, just above support at $0.053414, with significant trading volume up 22.14%. Resistance is at $0.053676. Despite a slight decrease in price, there’s increased market activity, suggesting potential volatility.
CryptoNewsLand29m ago
DXY Retest at 99.183: Will 100–101 Break as US Degen Index Stabilizes?
DXY trades at 99.183 while retesting the 100–101 monthly resistance zone.
US Degen Index 6900 sits at $0.0001197 with support at $0.0001175 and resistance at $0.0001214.
A break above 101 on DXY would shift structure higher, while rejection keeps price below key resistance.
The U.
CryptoNewsLand33m ago
AVAX Tests $9.38 Resistance After 8.3% Surge — Breakout or Pullback Ahead?
AVAX is also trading at $9.16 with a daily gain of 8.3 per cent, but still below $9.38 resistance.
Strong buyer activity near $8.46 continues to prevent deeper downside extensions.
A daily close above $9.38 could open room toward $9.50, while rejection risks $8.30.
Avalanche’s
CryptoNewsLand1h ago
XRP Holds $1.34 Support as $1.80–$2.00 Becomes 2025 Make-or-Break Zone
XRP is trading at $1.37 and its trading higher than the support of $1.34 but facing a heavy resistance at $1.38.
The critical structural pivot zone of $1.80-2.00 is the critical 2025 structural pivot.
March structure has the targets of $2.78 and 3.60, with anticipated
CryptoNewsLand1h ago
Dogecoin Prints Monthly Morning Doji Star — Will $0.097 Break Next?
Dogecoin is forming a "Morning Doji Star" pattern on the monthly chart around $0.09, indicating a potential bullish reversal despite a recent 1.9% daily decline. Key support is at $0.09036 and resistance at $0.09707, with current trading at $0.09010.
CryptoNewsLand1h ago
SHIB Faces Critical Breakout Test as Forecast Points to Short-Term 7.47% Gain
Shiba Inu (SHIB) is trading close to the support level of $0.05545, showing a recent decline but also potential for a 7.47% upside by March 2026. The price remains within established boundaries, facing key resistance at $0.055727. Future movements depend on breaking above resistance or falling below support.
CryptoNewsLand2h ago