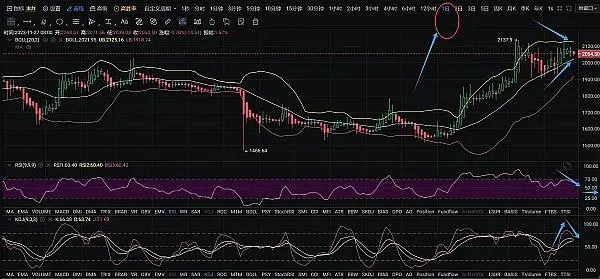
Let’s take a look at the daily level trend of Ethereum on the 27th today, the price index is in the upper Bollinger band, the swing index RSI trend reverses downward near the 70 value, and the inflection point is near the 50 value axis. Similarly, in the KDJ indicator, the J line reverses at a high level and there are signs of intersecting K and D cycle lines. The reaction also increases the risk expectation of long to short in the price action. Once the support near the daily mid-band 2020 is broken, and the short-term chasing long chips are forced to close the position with profits, it will increase the strength of the retracement. Intraday, it is not ruled out that the index may retrace to the bottom support below 1950. On the whole, the signal given by the daily line is that the intraday rebound is weakened and the downward momentum is increased
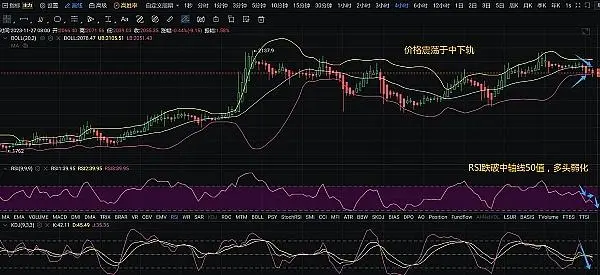
The extremely short-term 4-hour trend also reflects the signs of weakening of the bullish trend, after the K-line weakly fluctuated and fell below the middle line, near the lower band, the K-line continued to close the upper hanging line did not prevent the price from falling. At present, it has fallen below the lower track of 2050, and the RSI of the relative similar indicator has gradually moved down with the peak of the fluctuation, and the current value of 50 on the central axis has gone to around 25. The J line value of the KDJ indicator completes the downward crossing of K, and the D period line widens the downward opening angle. In the local market trend, the downward trend of the first shock is very strong, and the bearish sentiment is also increasing.
Once the lower 4-hour Bollinger Bands at 2050 is truly broken, the bottom support of the hourly band at 2030 will also be null and void.
Short-term contracts can try to take a short position near 2055-2070 above, see 2005-1950 under the moving take profit, and within 20 points above the average entry price of the stop loss
Source: Golden Finance
Disclaimer: The information on this page may come from third parties and does not represent the views or opinions of Gate. The content displayed on this page is for reference only and does not constitute any financial, investment, or legal advice. Gate does not guarantee the accuracy or completeness of the information and shall not be liable for any losses arising from the use of this information. Virtual asset investments carry high risks and are subject to significant price volatility. You may lose all of your invested principal. Please fully understand the relevant risks and make prudent decisions based on your own financial situation and risk tolerance. For details, please refer to
Disclaimer.