The MEV cake from the Black Forest exudes an alluring aroma.
Written by: xiaoyu
There are always tempting treasures hidden in the dark forest. MEV (Maximal Extractable Value, maximum extractable value) extracts value from users on a first-come, first-served basis. From block congestion issues caused by the Priority Gas Auction (PGA) to possible vulnerabilities between validators and block builders, there are concerns about public issues within the Ethereum ecosystem.
AMM is the most direct link in the MEV extraction process. Due to the permissionless visibility of the memory pool, DEX users will inevitably face the risk of being attacked by MEV bots. At the same time, arbitrage robots play a vital role in improving the price discovery efficiency of AMM and markets.
**In this report, we start from the classification of common MEVs in DEX as a whole and their market size, and establish a general understanding of the development stages of DEX MEVs. Zoom in with the magnifying glass and analyze the MEV case from the block explorer. Explore the solutions and development direction of MEV by comparing and understanding the characteristics of MEV in different DEXs. **
At a glance——The development of DEX MEV
DEX MEV is mainly divided into three types: Sandwich, Arbitrage and Liquidation. According to data from EigenPhi, in the past 30 days, arbitrage MEV on Ethereum occurred $1.64M, sandwich attack MEV occurred $1.74M, and liquidation MEV occurred $21.01K. **It can be seen that arbitrage and sandwich are the main sources of profits for DEX MEV, accounting for 99.38%, and are also the focus of this report. **
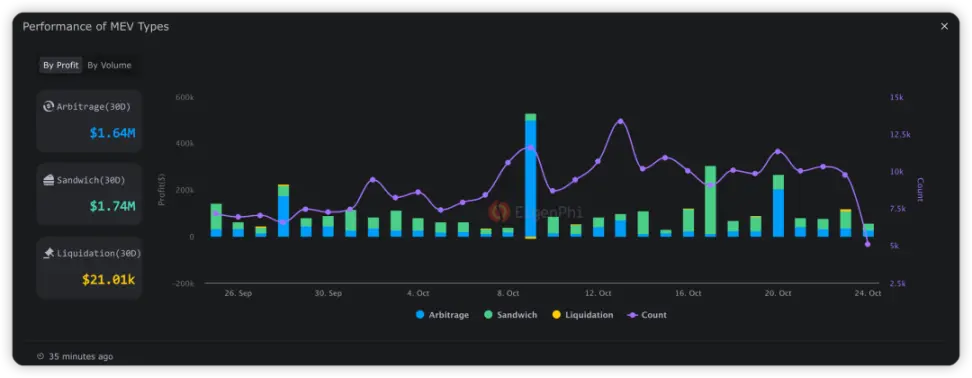
Performance of Liquidation, Sandwich and Arbitrage in the past 30 days, source: EigenPhi
Before proceeding, let’s briefly introduce the principles of three MEV types of attacks:
- Sandwich attack: The attacker monitors unconfirmed transactions, bribes miners, and inserts his own transactions before and after the target transaction, thereby affecting the price of the target transaction and profiting from it.
- Arbitrage: In a DEX environment, arbitrage often involves exploiting price differences between different trading platforms. Due to the decentralized nature of DEX, price updates may lag. Arbitrageurs can make profits by buying an asset at a low price on one platform and selling the same asset at a high price on another platform.
- Liquidation: A liquidation event is triggered when the value of a borrower’s collateral falls below a predetermined threshold. At this point, the agreement allows anyone to liquidate the collateral and pay creditors immediately. When the liquidation line is triggered, the liquidation robot will insert a liquidation order after it to obtain fees.
It can be seen from the data that liquidation of MEV does not happen frequently. Large-scale liquidation attacks usually occur in extreme market conditions. Starting from the attack principle of liquidating MEV, this is not difficult to understand. For example, due to the 10-point rise in BTC on October 23 and 24, the trading volume of liquidated MEV was as high as $561K on that day, which was significantly higher than at other times.
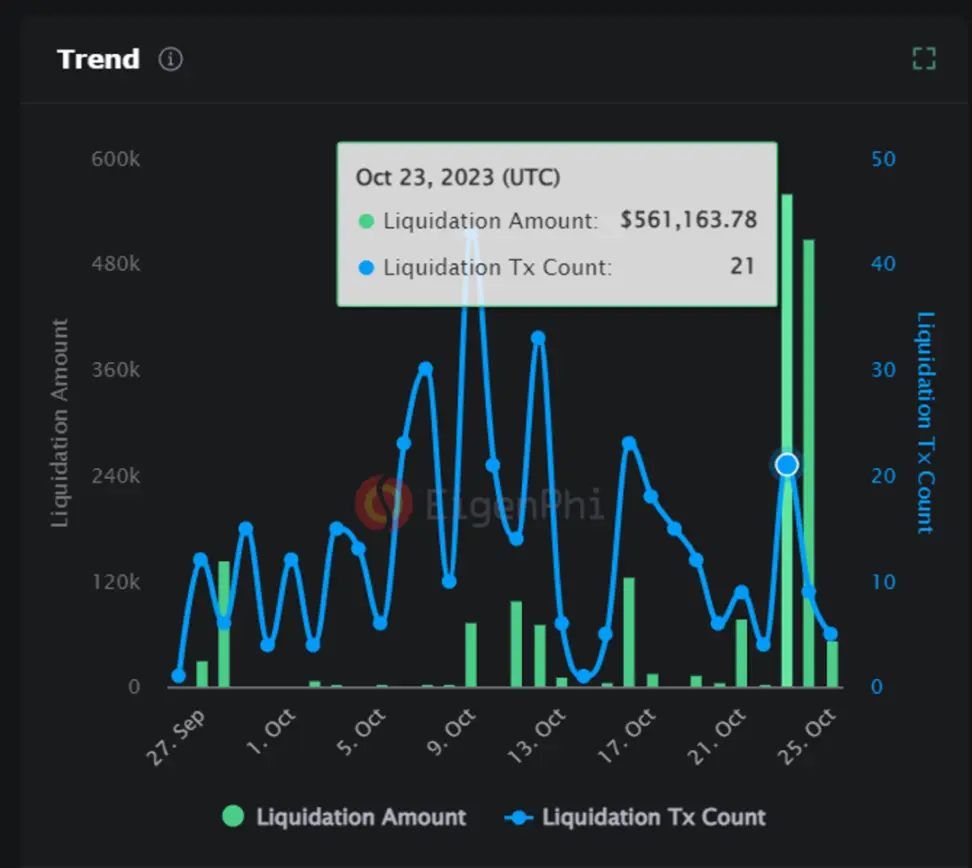
Scale and volume of liquidated MEV, source: EigenPhi
Most of the sandwich attacks occur in the leading DEX, Uniswap, which accounts for about 3/4 of the market share. This is closely followed by aggregators. 1inch v5: Aggregation and 0x: Exchange are equally divided, accounting for 10% of the total MEV. Metamask: Swap Router accounts for 4.8%.
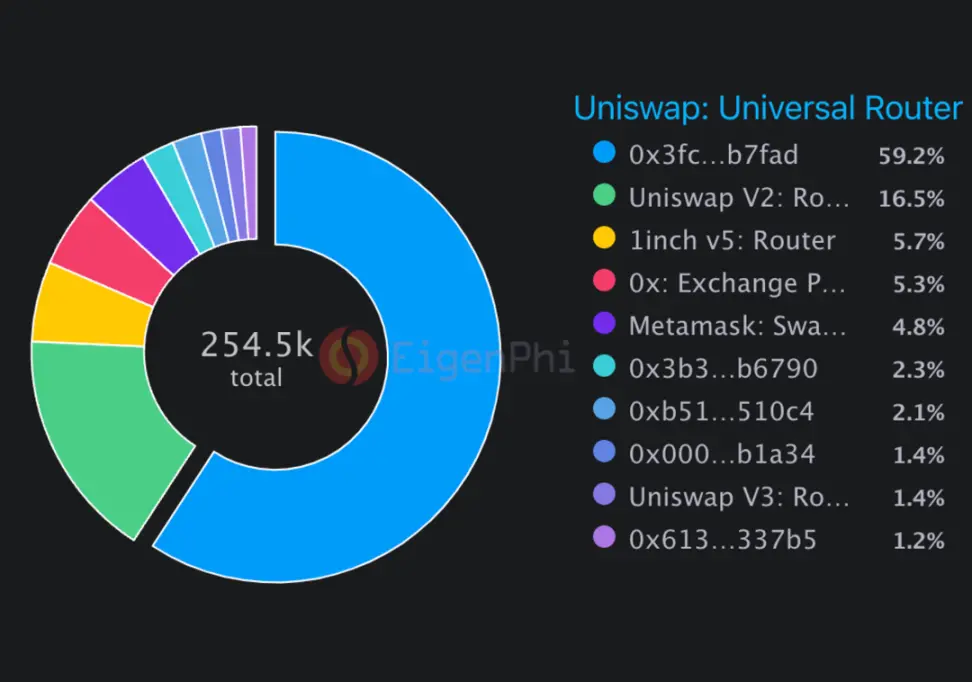
Sandwich attacks are distributed among various routes, source: EigenPhi
82.18% of the single profit amount is between $0-$10, 6.84% of the single profit is $10-$100, and 9.28% of the single loss is $10-$100.
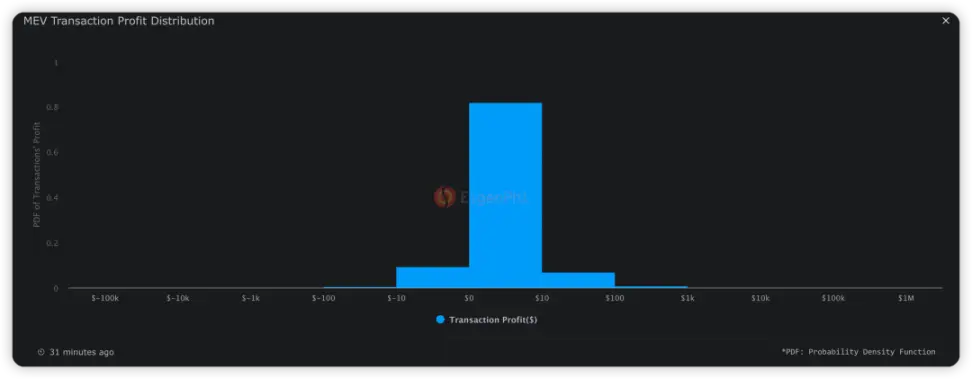
MEV profit distribution, source: EigenPhi
Insight into the details——MEV occurrence from block explorer
In order to understand the occurrence process of MEV and clarify the calculation of the income of MEV robots, we selected a recent sandwich attack from the EigenPhi website as an example to explain the entire process of MEV attacks in detail. This is a sandwich attack that occurred at 2023-10-23 21:00:35. The attacker spent $634.93, earned $6,167.48, and made a profit of $5,532.55.
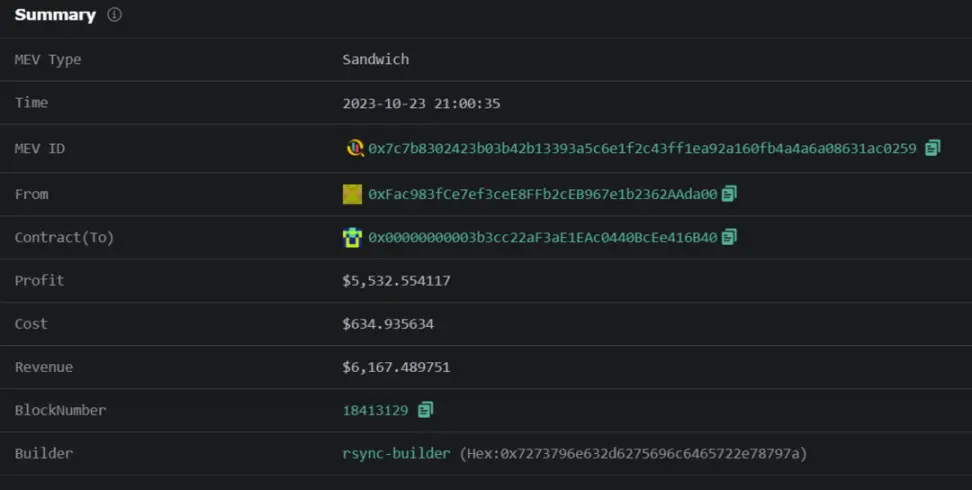
MEV attack interpretation example, source: EigenPhi
The entire sandwich attack process is divided into three steps: Front-run, Victim, and Back-run. These three transactions are closely arranged and packaged in block 18413129. In order to better explain each step, we used the Tag function in Etherscan to mark the addresses. The from address of the victim txn was marked as “victim”, and the interaction addresses in front-run and back-run were marked as “attack” ", and the remaining tags come from the Internet.
**Front-run: Buy before you buy! **
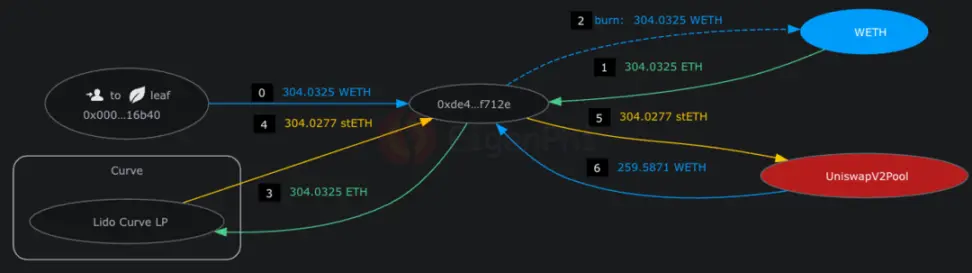
In the front-run, the attacker first transferred 304.03 WETH to Attacker 2, and exchanged 304.027 stETH through the Lido Curve pool with extremely low slippage. Then stETH was exchanged for 259.59 WETH in the Uniswap V2: stETH 2 pool, causing a liquidity shift. (There are 56,000 ETH and stETH in the Lido pool)
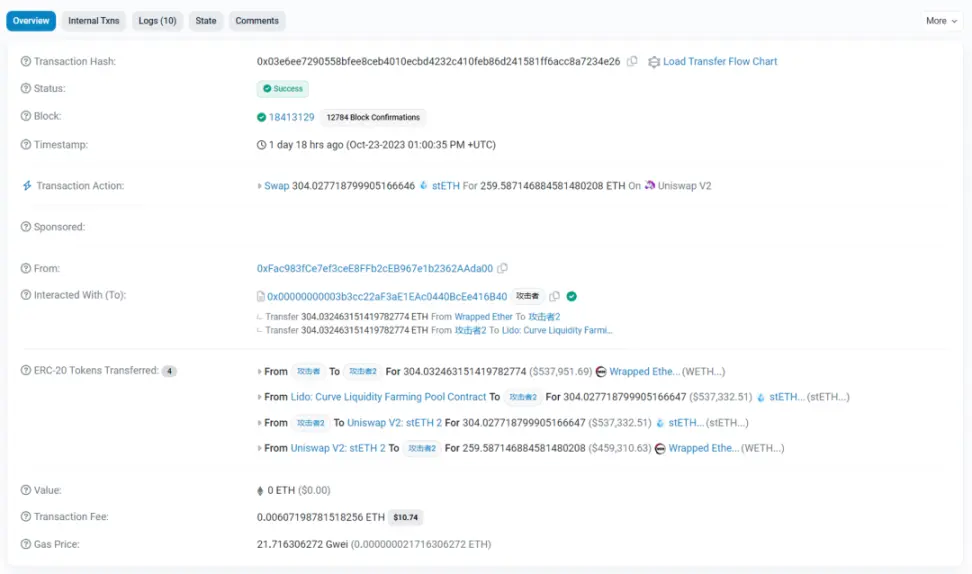
Front-run Transaction, source: Etherscan
Victim: You bought precious “precious” chips
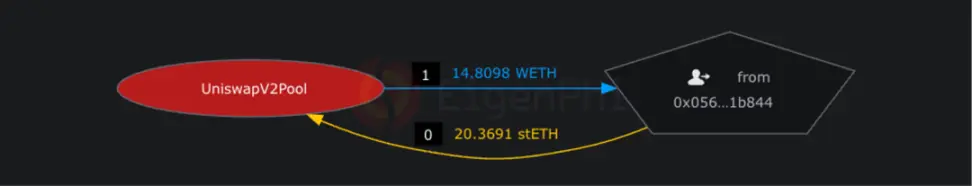
In a subsequent transaction, the victim exchanged 20.37 stETH for 14.81 WETH through the same Uniswap v2 pool. Since the attacker exchanges a large amount of stETH for WETH in advance in the front-run, it causes a shift in the AMM curve, thereby raising the average price of the victim’s WETH/stETH. The victim suffered an MEV attack.
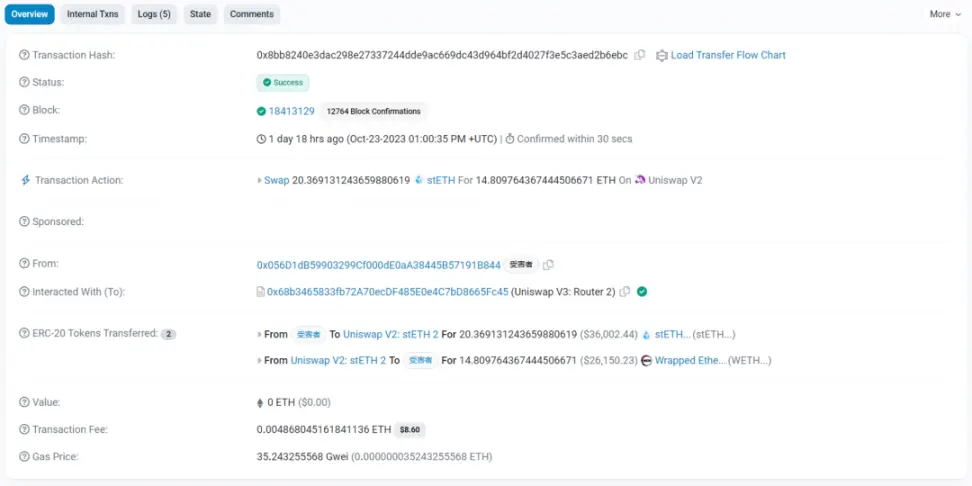
Victim Transaction, source: Etherscan
Back-run: They took the money and ran away😭
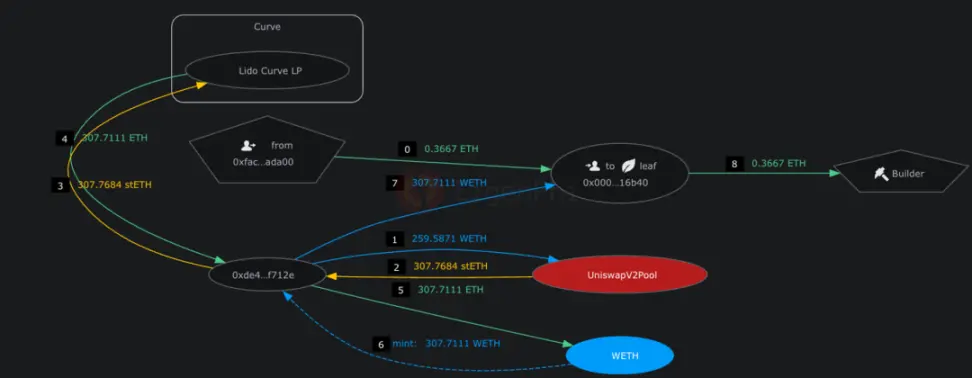
BackRun: Subsequently, attacker 2 exchanged 259.59 WETH back to stETH through the pool, obtaining 307.76 stETH (note: 3.76 more than before). Finally, attacker 2 uses the Lido Curve pool to exchange stETH for WETH with extremely low slippage, and transfers it back to the attacker. Take profit.
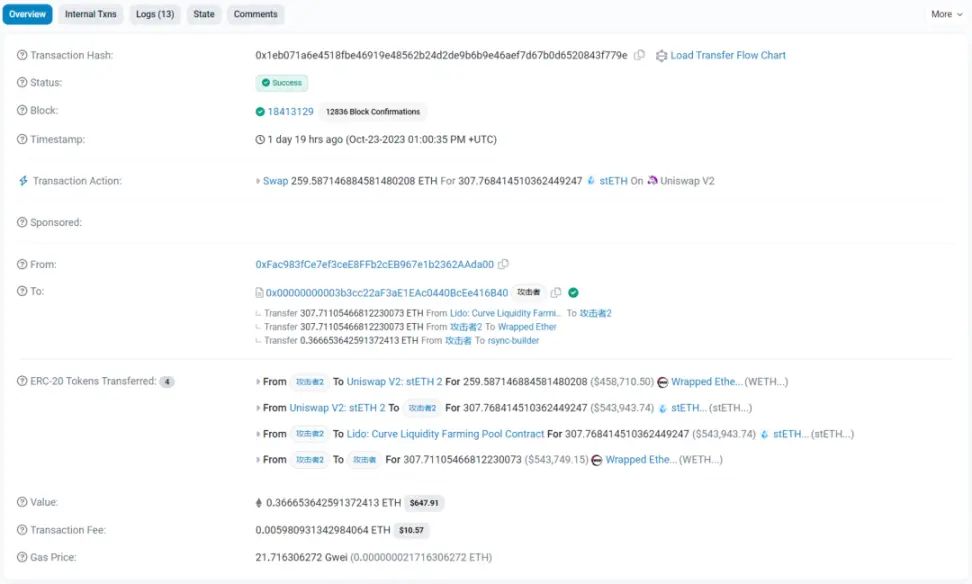
Back-run Transaction, source: Etherscan
Settlement screen
The cost is two Gas plus 0.3667 ETH as tip to the miner, the income is 3.76 WETH, and the profit is $5,532.55. Seeing from Curve that the victim’s 20.3691 stETH is quoted on the UI as 20.359 WETH. The victim only received 14.81 ETH, which means the victim suffered a whopping 37.5% slippage.
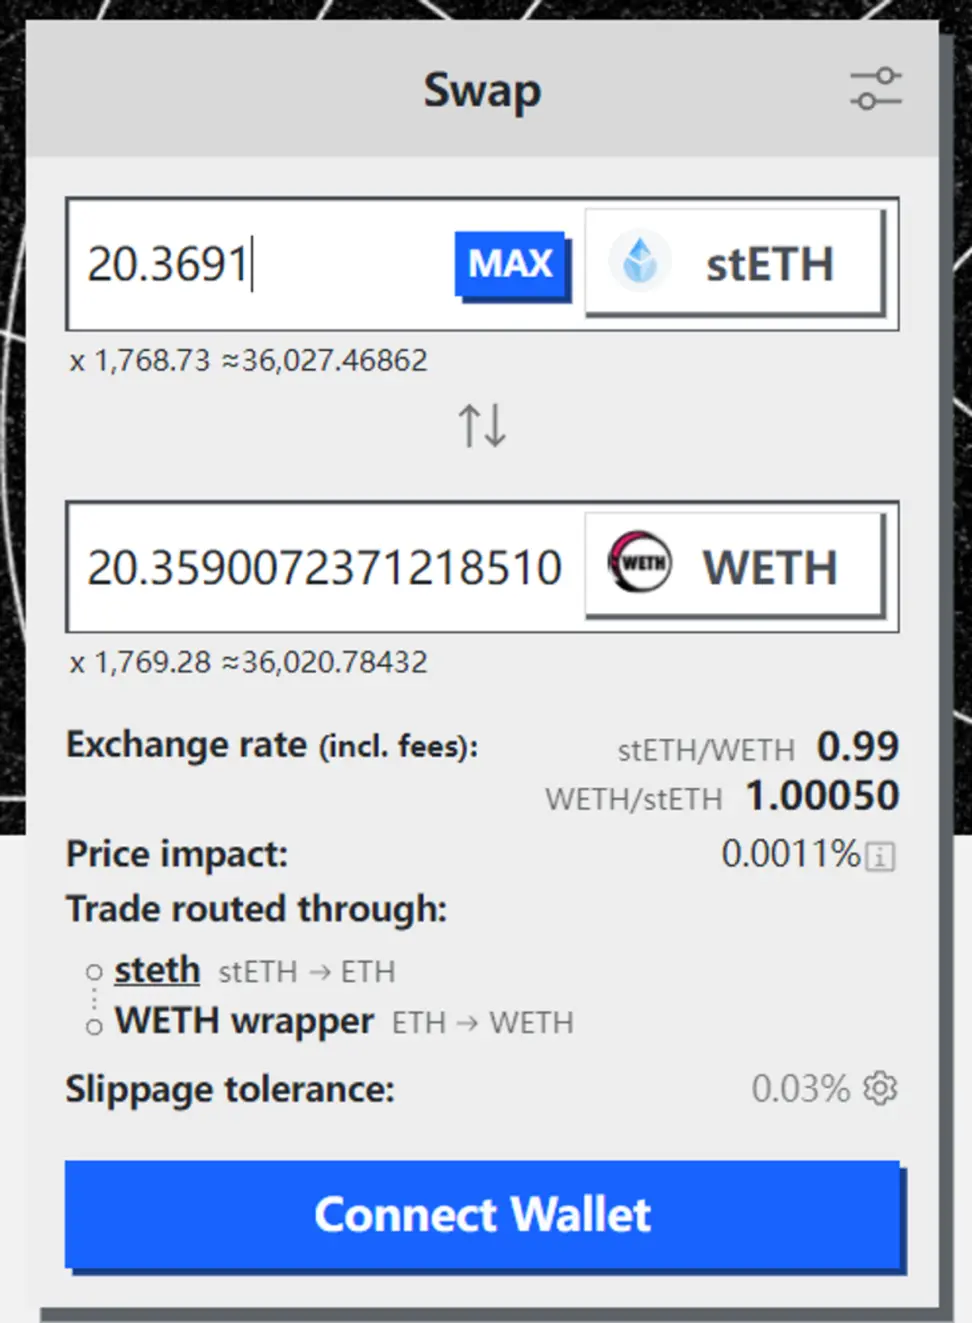
Quotation of 20.3691 stETH in Curve, source: Curve UI
*Note: The attacker here refers to the MEV Bot, and the real profiteer is the address of the interaction with the Bot, which is 0xFac…da00 in From. *
Eigentx uses Token Flow to display the above process, which makes it easier to review and visualize after understanding, making it more intuitive. The figure below shows the Token Flow of Front-run, Victim, and Back-run in order. The numbers indicate the order of occurrence for readers to sort out their memories.
Token Flow of sample MEV attack, source: Eigentx
From this transaction, we can summarize the necessary conditions for MEV to make a profit:
- First, a large amount of Swap is required to trigger a shift in liquidity in the AMM curve in advance.
- Sort the transactions and sandwich the victim Swap between Frontrun and Back run
- At the same time, ensure that the victim’s Swap result does not exceed the slippage limit (otherwise the transaction fails)
In the first step, attackers usually use flash loans to obtain large initial funds. Flash loan is a unique loan method in the blockchain. As long as the repayment can be completed in the same transaction, a large amount of funds can be loaned with 0 principal. The second step requires the attacker to have the ability to bundle transactions and broadcast them to nodes around the world in a short period of time. At the same time, they use ETH to bribe miners and give priority to packaging this transaction in the block. MEV attackers also need high-precision calculations to ensure that the victim’s Swap slippage will not exceed the agreement. It is also necessary to reasonably calculate the amount of bribes to miners to ensure maximum profits while avoiding losses caused by other MEV attackers using Front run.
Analysis one by one——How each DEX MEV is
Here is an analysis of the DEXs with the highest trading volume on the ETH chain: DODO, Uniswap, Curve, Pancakeswap. TVL, trading volume, rates, and slippage are important primary indicators. Combining EigenPhi data, we first observe the “universal law” of DEX MEV from Uniswap, a DEX with a long-term market share of 50%. Uniswap’s rich transaction volume brings a large number of samples for MEV observation. At the same time, Uniswap is also accompanied by many Forks, which is suitable as a benchmark reference. Then, by comparing the characteristics of other DEX MEVs, we find the reasons for the differences and gain further understanding of the occurrence of DEX MEVs.
1.Uniswap - Typical MEV Bots’ Activities
Uniswap, as the leading DEX with nearly half of the market share on the ETH chain, has the largest number and largest number of MEV transactions and trading volume. We can use the performance of MEV on Uniswap as a benchmark to draw some universal conclusions:
- There is no conflict of interest between Arbitrage Robot, Sandwich Robot and LP;
- The occurrence of arbitrage and sandwich attacks is related to the intensity of market price fluctuations;
- Mining pools with large transaction volumes are more likely to be exploited by sandwich bots to extract value;
- Spatial arbitrage involving 2 venues is the most common model, with up to more than 100 venues involved;
- There is a positive correlation between profitability and the activity of Sandwich Bot.
1.1 There is no conflict of interest between Arbitrage Robot, Sandwich Robot and LP
Let’s first look at the revenue scale of MEV Robots and LP. In the “MEV’s Impact on Uniswap” report, EigenPhi separately calculated the income of V3 LP and the income of three robots: arbitrage, sandwich, and JIT from January 1 to October 31, 2022, as shown in the figure below. In terms of revenue scale, the revenue of the three MEV robots exceeded 25% of LP revenue, amounting to US$540 million. This seems to be competing for the market with LPs, trying to seize the profits that should belong to LPs from traders.
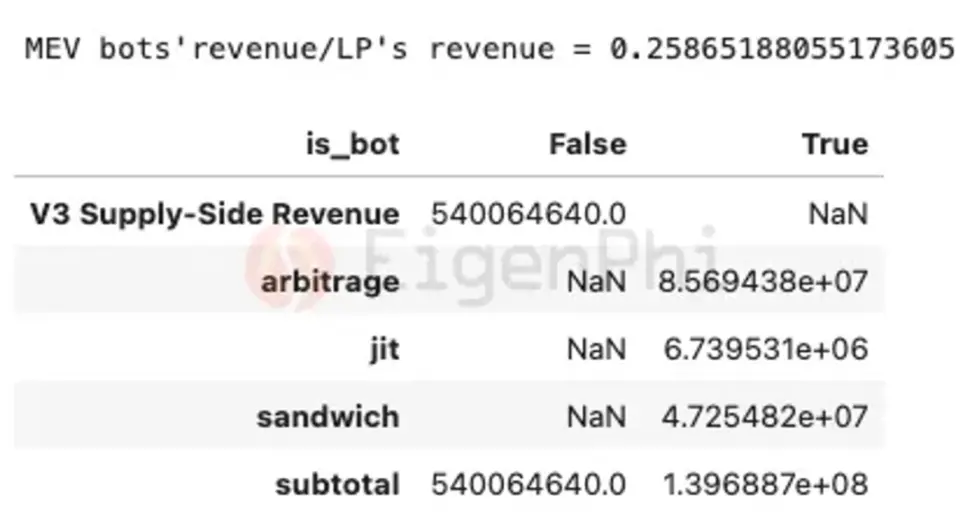
Profits from arbitrage, JIT and sandwich attacks and income from LP transaction fees. Source: EigenPhi
However, according to the correlation coefficient presented by Messari in Dune, arbitrage and sandwich robots have no negative correlation with LP’s income, which means that the occurrence of arbitrage and sandwich MEV has no conflict of interest with LP. This may be because the Sandwich Bot’s attack does not only involve the two currency pairs traded by the user, but will be routed to the head liquidity pool to exchange tokens, such as converting stablecoins USDC and DAI into the ETH required in the currency pair. . To a certain extent, arbitrage and sandwich attacks will bring additional trading volume in addition to users’ ordinary transactions, which will not have a negative impact on LP’s income, and their income is more likely to fluctuate with the entire market.
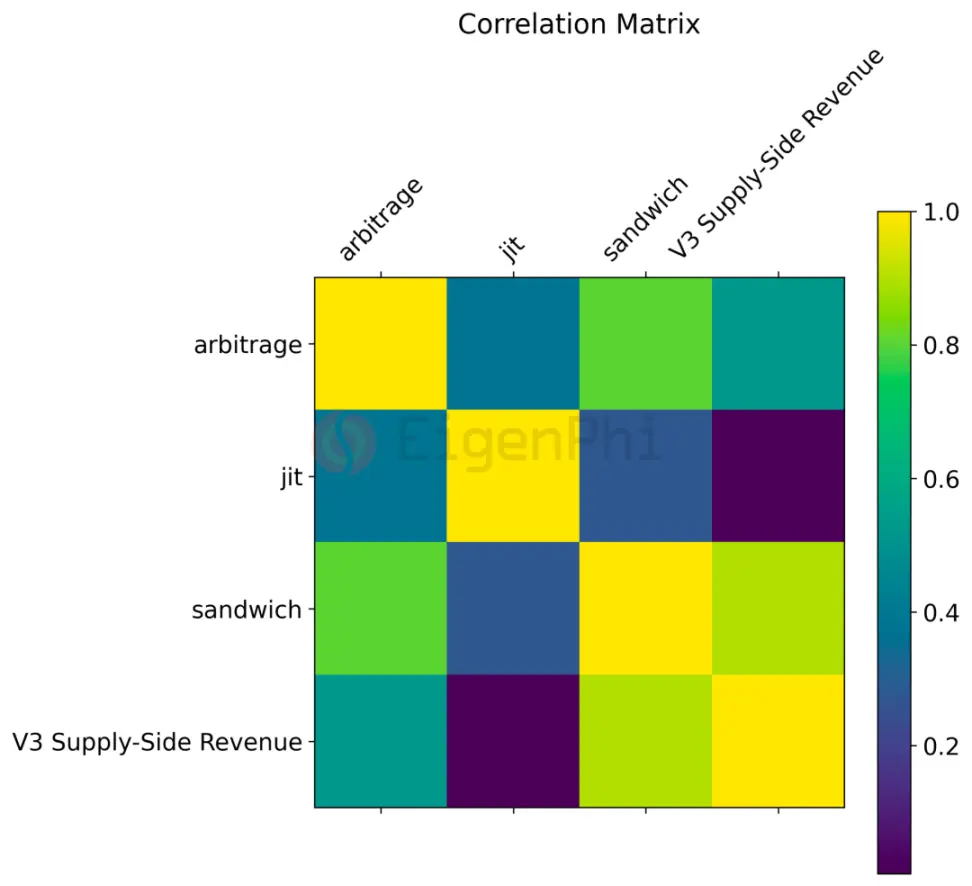
Correlation coefficient matrix of profits from arbitrage, JIT and sandwich attacks and LP transaction fee income, source: Dune, @messari
1.2 The occurrence of arbitrage and sandwich attacks is related to the intensity of market price fluctuations
In order to explore the influencing factors of arbitrage and sandwich robot income, we explored the relationship between its income market price fluctuations. The data in the EigenPhi report demonstrates the quantitative relationship between ETH price changes and arbitrage and sandwich activity, as shown in the chart below. We can clearly observe that as the price fluctuation of ETH becomes larger, the total number of arbitrage and sandwich transactions also increases, showing an obvious positive correlation.
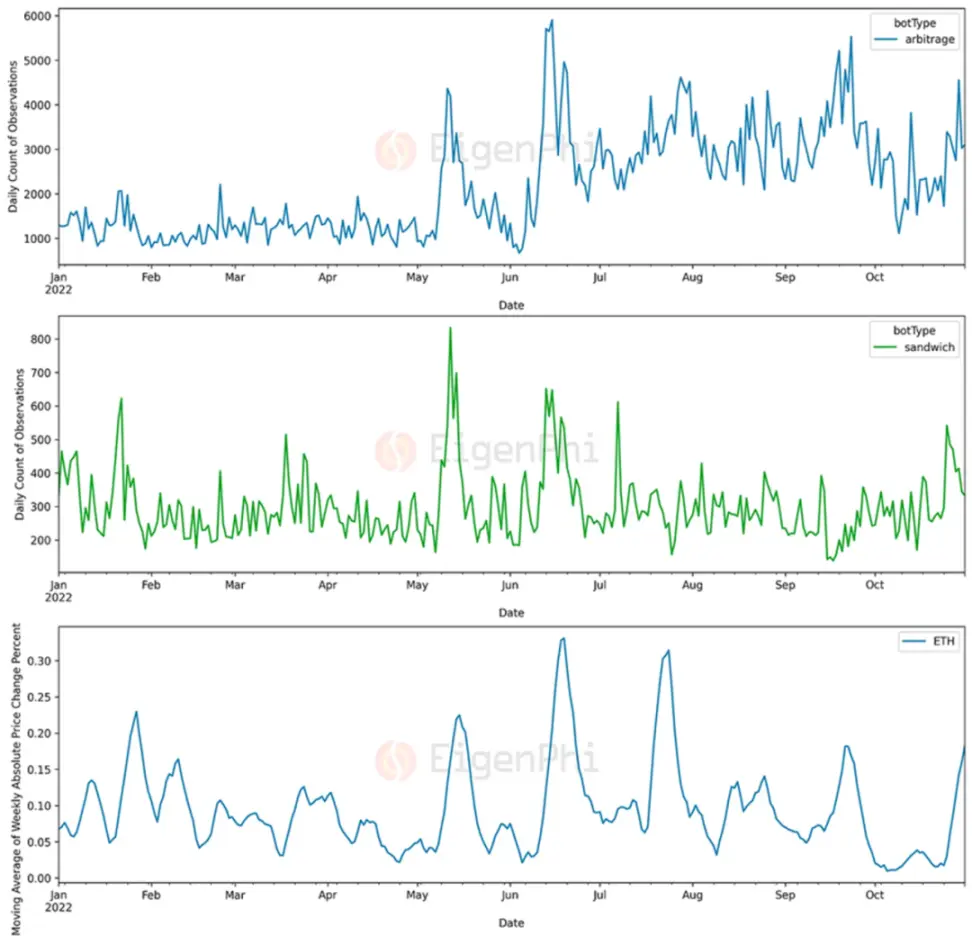
ETH’s 7-day price change percentage (volatility intensity) versus volume of arbitrage and sandwich activity, source: EigenPhi
There are several possible reasons why this phenomenon occurs:
- **Fluctuations in market prices can exacerbate price inconsistencies: **Significant fluctuations in the price of ETH may create temporary price inconsistencies between different exchanges. Arbitrage bots exploit these inconsistencies to profit, so arbitrage activity increases during times of large price movements.
- **Large price fluctuations may correspond to low market liquidity: **Price fluctuations are usually related to market liquidity. In less liquid markets, large orders can have a greater impact on market prices, providing opportunities for arbitrage and sandwich trading.
- Price fluctuations will stimulate trading activity: When ETH price fluctuations intensify, traders’ pursuit of potential profits will increase, thereby increasing market activity, which creates conditions for sandwich trading.
1.3 Mining pools with large transaction volumes are more susceptible to value extraction by sandwich bots
To observe which liquidity pools are more likely to participate in MEV activity, EigenPhi merged Uniswap V3 pool metadata and MEV activity parameters grouped by pool address in the report. The results show that among the top ten liquidity pools by trading volume, Sandwich Robot can obtain more than 80% of the profits. However, only 20% of sandwich trading activity occurs in these liquidity pools.
This means that liquidity pools with large trading volumes are easier for sandwich bots to extract value from. Because liquidity pools with large trading volumes involve more funds and transactions and have better depth, they bring huge profit margins to the limited exploitable slippage in sandwich attacks. However, it should be noted that this does not mean that liquidity pools with smaller trading volumes are not vulnerable to sandwich attacks.
1.4 Some other interesting observational conclusions
From the data presented in the EigenPhi report, we can also draw other interesting conclusions to help understand the occurrence of DEX MEV. For example, it can be seen from the distribution combination of the top 10 arbitrage that **space arbitrage involving a Uniswap V3 pool and another venue is the most common pattern. **The next two common patterns are triangular arbitrage involving one or two Uniswap V3 pools. Some single arbitrage transactions may involve more than 100 venues.
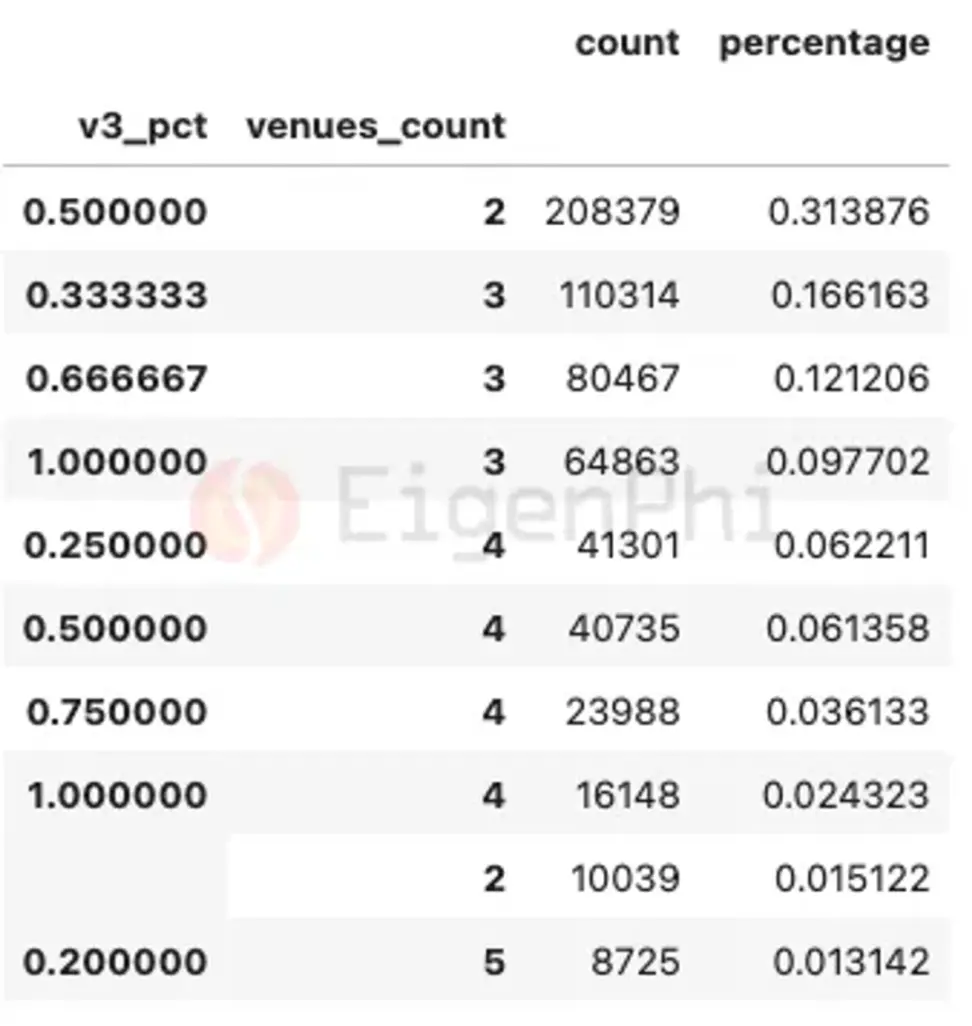
Distribution of the number of different venues for arbitrage models, source: EigenPhi
At the same time, the relationship between the total profit of the sandwich attack and the total number of activities shows that profitability and activity are positively correlated, and most profitable robots have the ability to successfully submit transactions more than 1,000 times. (A clerical error in EigenPhi’s report was ‘100’). This means that the more ‘hard-working’ the sandwich robot is, the more it earns. **
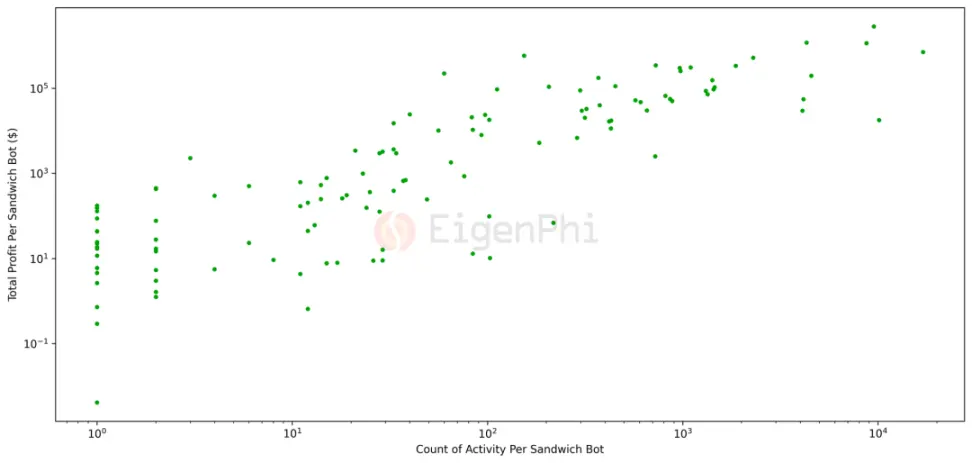
Dot plot of Sandwich Bot attack frequency and profit, source: EigenPhi
2.DODO - Where Does High Volume Come From?
DODO focuses on stablecoin trading, and its active market making strategy brings excellent depth to the stablecoin pool. The market capitalization is only $42 million, but it has consistently ranked among the top three in DEX trading volume. MEV on DODO has two characteristics:
- MEV contributed a high amount of trading volume to DODO, accounting for approximately 60% of the total trading volume;
- Most of the MEV on DODO comes from 1inch routing.
2.1 MEV contributed a high amount of transaction volume to DODO, accounting for approximately 60% of the total transaction volume
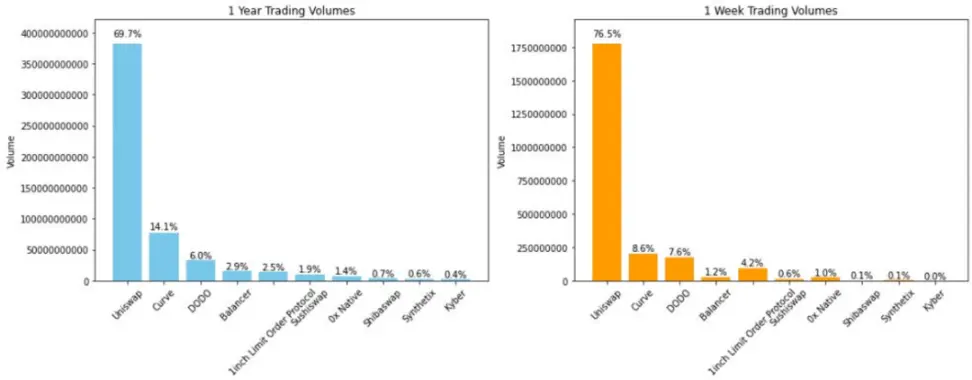
In comparison, Uniswap has a market capitalization of $41 billion. **In other words, DODO achieved 8.6% of Uniswap’s trading volume when its market capitalization was 1% of Uniswap. **The reason is that the MEV of DODO liquidity is used to cause trouble.
 *
*
Trading volume distribution of top DEX in the past year and week, source: EigenPhi
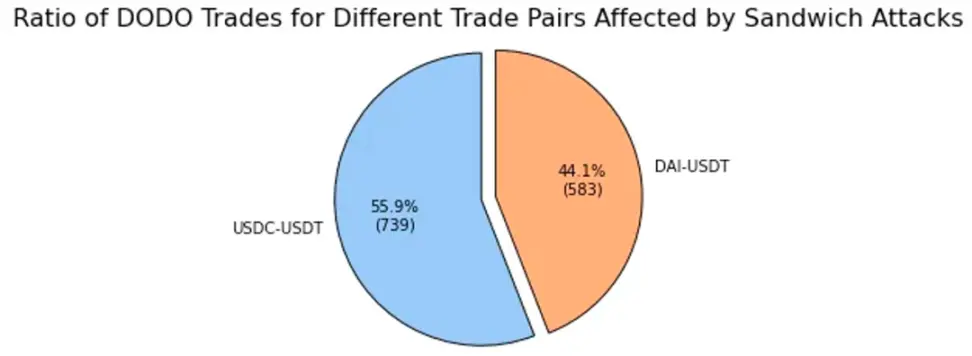
Data from Dune shows that DODO’s main trading pair on the ETH chain is stablecoins. From the general conclusion, we can understand that mining pools with large transaction volumes are more likely to have value extracted from them by sandwich bots. This is consistent with DODO’s data. The stablecoin pool has become the main place for MEV attack activities in DODO. According to EigenPhi’s research in the “DODO: Where Does High Volume Come From?” report: the total number of transactions subject to sandwich attacks on DODO reached 1,322, with USDC-USDT transactions accounting for 55.99% and DAI-USDT transactions accounting for 44.01%.
 *
*
Pie chart of share distribution of trading pairs affected in sandwich attacks, source: EigenPhi
Looking at the trading volume distribution of these two stablecoin pairs, approximately 60% of the trading volume comes from sandwich transactions. Because the sandwich attack requires large transactions to cause liquidity deviation, although Victim Volume only accounts for about 2% of the share, the front-run and back-run efforts made for this contribute to USDC-USDT and DAI-USDT. 60% of the transaction volume.
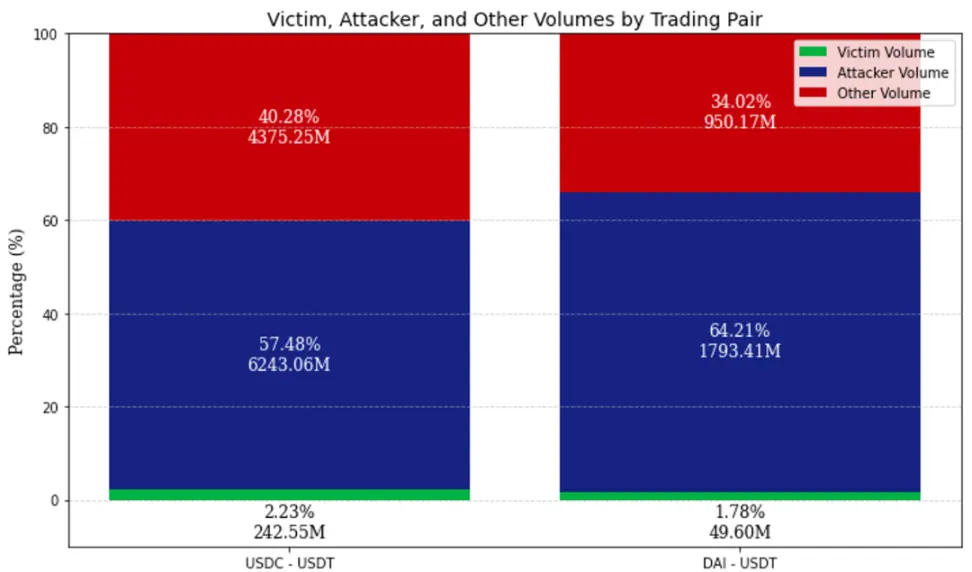
Distribution of trading volume in USDC-USDT and DAI-USDT trading pairs, source: EigenPhi
2.2 Most of the MEV on DODO comes from 1inch routing
**DODO’s front-end transactions are usually protected by slippage. Transactions exceeding the slippage cannot be completed. The slippage of stable currency pairs is 0.01% by default. **But why does such a high MEV transaction volume still occur?
According to Eigenfi’s data, it can be found that more than half of the transactions of addresses with more than 20 victim txn interact with the 1inch aggregator for routing transactions, as shown in the figure below. As an aggregator, 1inch does not directly provide liquidity for users to complete transactions, but routes orders to liquidity settlement in other DEXs. Its Fusion mode provides three options:
- Fast mode: suitable for users who want orders to be executed immediately, which means lower prices;
- Fair mode: users wait briefly in exchange for a more attractive price;
- Auction mode: Users auction orders and wait up to ten minutes for the best price.
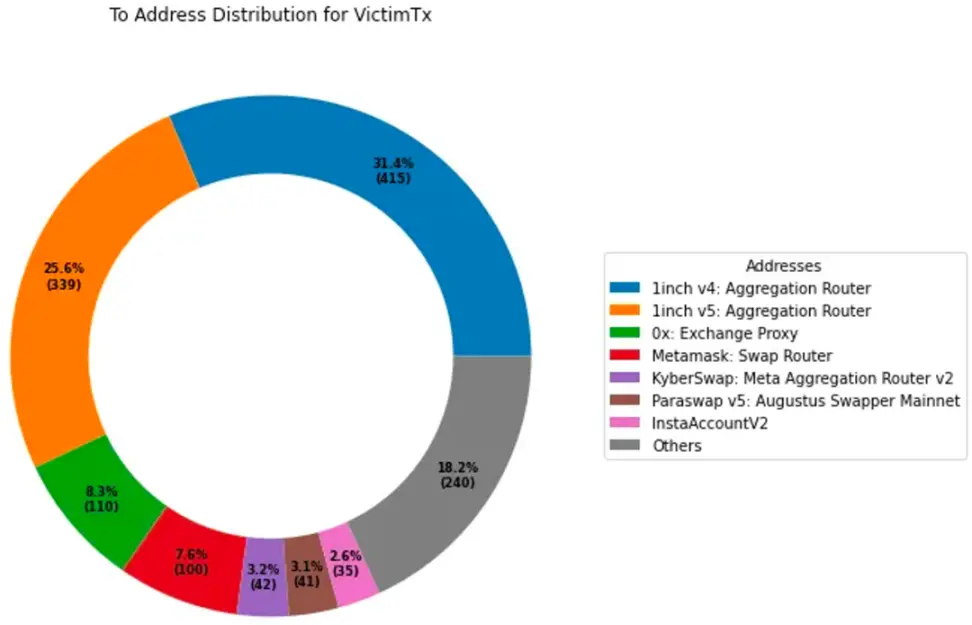
Route distribution of address interactions that have been attacked more than 20 times, source: EigenPhi
Simply put, the 1-inch Fusion mode may achieve fast transactions at the expense of large slippage, slowing down the waiting time for users to trade. Although DODO’s front-end has strictly protected users’ slippage, it uses a default slippage tolerance of 0.01% for stable coins and a default slippage tolerance of 0.5% for mainstream currencies such as BTC and ETH. However, 1-inch routing does not protect users from slippage, which is the fundamental reason why 1-inch aggregator transactions are in danger.
In traditional slippage settings, most DEXs adopt fixed slippage values, such as the 0.3% provided by Uniswap. This static setting has certain limitations, and the occurrence of transaction reversals will bring frustration and potential losses to users. On the other hand, during periods of less volatility, this setting may be too high, leaving the trade vulnerable to MEV attacks.
The "Dynamic Slippage" launched by the DODO front-end uses time series model prediction to achieve the best slippage tolerance. Help users mitigate potential losses during the exchange process while maintaining a high success rate. Leveraging the ARIMA model, a proven and robust time series predictor, **Dynamic Slippage has demonstrated 98% accuracy in backtesting. **
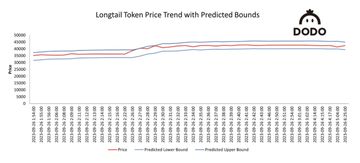
“Dynamic slippage” diagram: the boundary between long-tail asset prices and predictions, source: @DODO
3.PancakeSwap - Uniswap of BNB Chain
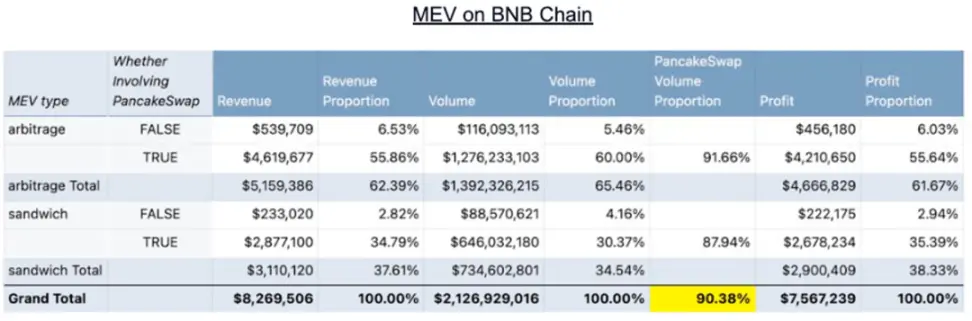
PancakeSwap has always been the DEX second only to Uniswap in trading volume, with a market share of approximately 15%. On the BNB chain, Pancake is an absolute giant, monopolizing about 90% of the market share. This is consistent with EigenPhi’s statistical MEV data. **More than 90% of the total MEV on the BNB chain comes from activities involving PancakeSwap. **The salient features of MEV on PancakeSwap are:
- Pancakeswap v3 has a significantly smaller proportion of MEV in the BNB chain;
- Sandwich attacks in Pancakeswap v3 are very rare.
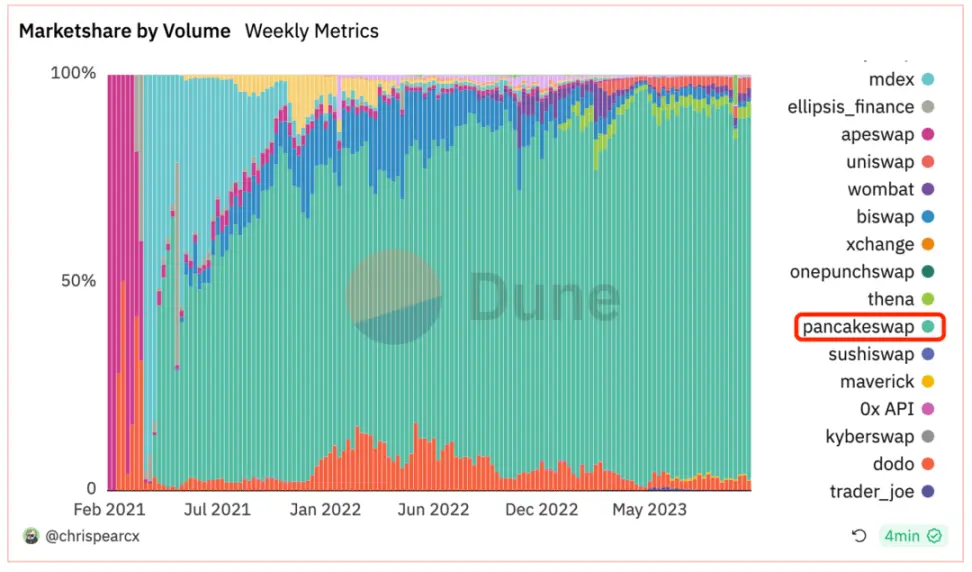
Market share of different protocols on the BNB chain, source: Dune
 *
*
MEV’s income distribution, proportion and share of Pancakeswap on the BNB chain, source: EigenPhi
3.1 Pancakeswap v3 has a significantly smaller MEV ratio on the BNB chain
Panacakeswap’s dominant position in the BNB chain is just like Uniswap’s in the Etherum chain, and the mechanism design of the two is not completely different. It is difficult for us to naturally infer that the performance of Pancakeswap v3 on the BNB chain will be consistent with the performance of Uniswap V3 on the Etherum chain.
However, according to EigenPhi’s data in “PancakeSwap V3’s Ascendancy in the MEV Market - A Comprehensive Study”, the number of arbitrage attacks in Pancakeswap v3 on the BNB chain only accounts for 7.65% of the total transactions, and the number of sandwich attacks only accounts for 1.92% of the total transactions. In contrast, Uniswap V3’s MEV transaction volume ratio on the Etherum chain has remained relatively stable at around 50% to 60%. There are two possible explanations for this phenomenon:
- Basic facilities of the chain. **When comparing the MEV transaction ratio of PancakeSwap V3 on the BNB chain and the ETH chain. It was found that the MEV ratio is 9.4% on the BNB chain and 30.3% on the ETH chain. This means that the ETH chain and the BNB chain have different MEV ecosystems.
- **The richness of the protocol. **PancakeSwap is the main protocol on the BNB chain, while on the ETH chain, the protocols are more diverse and richer, which provides more MEV opportunities.
- **MEV middlemen. ** On Uniswap, sandwich attacks are the main source of MEV, while on PancakeSwap they are rare. Intermediary services like Flashbots make the MEV extraction process much simpler on Ethereum. However, such services are not mature enough on BNB Chain.
- **MEV infrastructure. **Ethereum has introduced mechanisms such as MEV-Boost and MEV-Boost Relay to encourage more validators to join. These facilities make the MEV extraction process for verifiers more efficient. Ethereum has over 820k validators, while BNB Chain only has 29.
- **Influence of transaction volume. **From the universal conclusion of Uniswap, we can know: **Under the same conditions, the proportion of MEV activity is highly correlated with large transaction volume. **Higher volume deals are more likely to generate MEV opportunities and greater MEV volume and MEV revenue. When comparing the transaction volume of each transaction on the two chains, it can also be clearly noticed: the transaction volume on the ETH chain is approximately 10 times that of BNB.
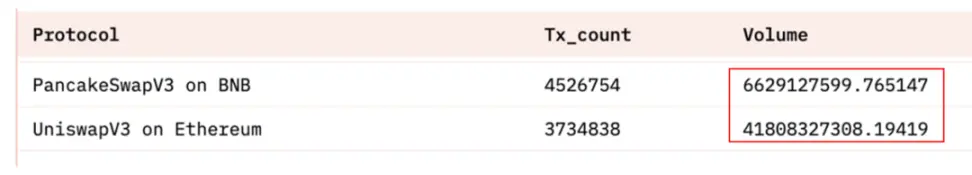
Comparison of transaction volume of PancakeSwapV3 on BNB chain and UniswapV3 on Ethereum, source: Dune
3.2 Pancakeswap v3 sandwich attack is very rare
EigenPhi’s report also shows that compared to PancakeSwap V2, V3’s sandwich attacks are very rare, and its revenue only accounts for 2.32% of the total sandwich revenue. The difference may come from the mechanical characteristics of V3:
- **Transaction Fee Adjustments:**PancakeSwap V3 introduces four different transaction fee tiers (0.01%, 0.05%, 0.25% and 1%), compared to V2’s single fee level of 0.25%. Liquidity providers may choose different fee tiers based on market conditions and their own risk tolerance. This dynamic change may result in a more complex trading environment, making MEV opportunities unstable as liquidity and trading patterns may change over time.
- **Improved Smart Routing: **Brings overall improvements to the trading engine by adding split routing functionality and the ability to utilize all possible liquidity in the protocol. The new smart router intelligently finds the best transaction routes by leveraging the liquidity of PancakeSwap V3, V2 and StableSwap, with multi-hop and split routing capabilities. By optimizing trade routing and leveraging multiple liquidity sources, PancakeSwap V3 may reduce the potential profitability of a single trade. Because transactions are conducted across multiple pools, this may make potential MEV opportunities more complex and difficult to exploit. Smart routing will also leverage the liquidity provided by market maker integrations to provide traders with the best deals. Users can select or disable certain liquidity sources, which provides users with more flexibility. This avoids potential front-running or back-running behavior of some pools.
4.Curve - Haven of arbitrage for the Clever
Launched in 2020 and known as StableSwap, Curve’s unique price curve differs from the constant product formula curve, allowing its pool to suffer less slippage in the stablecoin AMM market. Curve has a robust ecosystem that allows users to exchange stablecoins with other DEX protocols with lower fees and slippage. Curve’s main businesses include:
- Exchange of stable coins: classic liquidity pools include 3pool, LUSD/3Crv, etc.;
- Stable pegged assets: For example, Curve supports ETH’s PoS and synthetic assets, stETH, frxETH, etc.;
- Unstable pegged assets: After Curve V2, users can redeem BTC, ETH and USDC in Curve’s Tricrypto pool.
This also makes the MEV occurring on Curve behave differently:
- The income from sandwich attacks and arbitrage bots accounts for 73% of Curve pool income, and arbitrage is active;
- 80% of the profit of MEV robots is earned by 20% of the robots;
- Arbitrage opportunities are related to the intensity of market price fluctuations, while sandwich attacks are not related to market price fluctuations.
4.1 The income from sandwich attacks and arbitrage robots accounts for 73% of the Curve pool income, and arbitrage is active
Curve’s 3Pool, also known as Tri-Pool, provides a large amount of liquidity (approximately $3.4 billion) for three of the top stablecoins in DeFi. This deep liquidity and Curve’s optimization allow 3Pool to generally provide the most capital efficient path to the exchange of USDT, USDC, and DAI compared to other decentralized exchanges such as Uniswap or SushiSwap, which is particularly useful for arbitrageurs and traders. Very beneficial to the investor. According to data from EigenPhi, revenue from sandwich attacks and arbitrage bots account for 73% of Curve pool revenue. Compared with the 25% ratio in Uniswap, MEV activity on Curve can be said to be quite active.
At the same time, Curve has a large and rich trading pair pool of linked assets, and these pools often generate huge arbitrage opportunities. EigenPhi counts the daily income of arbitrage and sandwich robots, as shown in the figure below. When stETH decoupled on June 13, 2022, the arbitrage robot generated considerable profits.
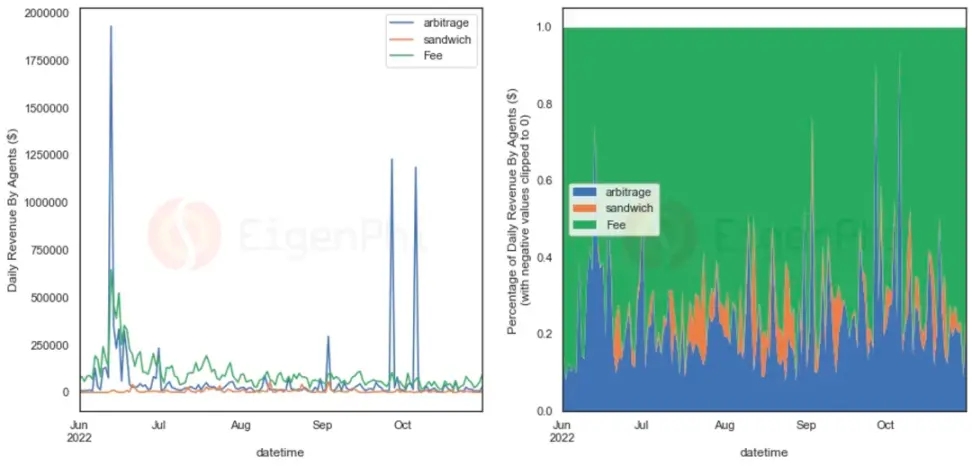
Line charts and proportions of sandwich attacks, arbitrage revenue and fee revenue over time in the Curve protocol, source: EigenPhi
80% of the profit of 4.2 MEV robots is earned by 20% of the robots
In the report “10M Revenue Drain in 5 Months: MEV impact on Curve”, EigenPhi drew a box plot of the revenue distribution of arbitrage and sandwich robots, as shown in the figure below. As can be seen from the figure: the revenue generated by MEV robots exhibits a fat-tailed distribution. Compared with the normal distribution, the fat tail means that the probability of extreme events is higher, and “smart” high-profit robots contribute most of the revenue.
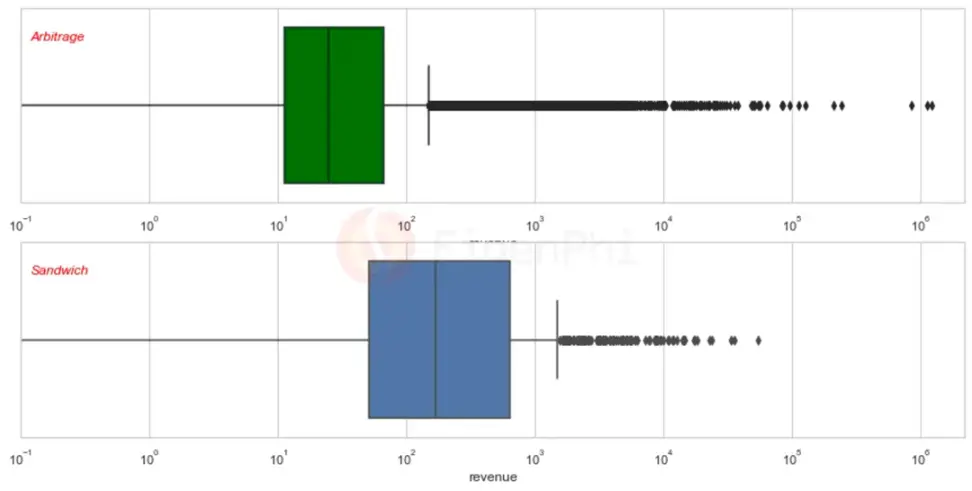
Box plot of income distribution for arbitrage and sandwich (bars in box plot represent quartiles, middle line represents median), source: EigenPhi
According to more detailed data from EigenPhi, it can be found that the top 25% of arbitrage robots account for more than 94% of the revenue, and the top 25% of the sandwich robots account for 87.8% of the revenue. The most profitable sandwich bot launched only 14 sandwich attacks, generating over $46,000 in total profit on the Curve stETH pool using just 2 transactions.
4.3 Arbitrage opportunities are related to the intensity of market price fluctuations, while sandwich attacks have nothing to do with market price fluctuations
When EigenPhi observed the activity of arbitrage and sandwich bots in a report using the frequency of seven-day price fluctuations of ETH, BTC, and CRV, they found that the occurrence of arbitrage trading opportunities was relatively correlated with the intensity of market price fluctuations. However, the opportunities for sandwich bots appear to be independent of the market’s price fluctuations. This is not the same as the universal conclusion obtained by Uniswap (its correlation coefficient is 0.6), which may mean that even in volatile market conditions, sandwich robots that are not smart enough still cannot complete the attack.
This finding is mutually confirmed with 4.2. Combined with the fact that the income of arbitrage robots in 4.1 is much higher than that of sandwich attacks, it is not difficult to infer that compared to Uniswap, sandwich attacks in the Curve pool are more difficult, and highly skilled arbitrage robots have unparalleled room for display in Curve.
One possible reason is that Curve provides multi-asset liquidity pools like 3pool and Tricrypto pool, which may make performing a sandwich attack on Curve more complex compared to Uniswap’s simple liquidity pool structure. Multi-asset pools may introduce additional variables and dynamics that may make it difficult for attackers to predict and manipulate prices effectively. This can also be seen in the fat-tailed distribution of MEV revenue. High-profit robots at the head contribute the vast majority of MEV revenue.
Another reason is that Curve contains a larger stablecoin pool, which means that the sandwich opportunity will be less dependent on the market’s price fluctuations. A large and rich pool of linked asset trading pairs provides opportunities for arbitrage.
There is a bright future: DEX MEV’s solution
As can be understood from the above, there may be huge differences in the distribution of MEV in different DEXs. Different mechanisms, businesses, and technologies all affect the distribution and scale of MEV. Whether it is the infrastructure on the chain, the optimization algorithm, or the mechanism innovation of DEX itself, the market is looking for solutions to overcome MEV. We have tried to summarize the following 5 types of solutions.
1.Private PRC node
A necessary condition for MEV is permissionless visibility of the public memory pool. Transactions through private RPC nodes can be routed directly to the block proposer (proposer), thus effectively avoiding the influence of the public memory pool and executing transactions before malicious front-runners.
PropellerRPC is a plug-and-play RPC solution. After receiving the user’s transaction, the specially set up PropellerSolver will start the algorithm to automatically search for possible backruns. If possible backruns are found, PropellerRPC will bundle the original tx and send it privately to the “honest” builder, and backruns all profits returned to users. Because RPCs are submitted privately to block builders, searchers cannot preempt or get caught in the middle of a transaction. When improper behavior of builders is monitored, such as builders reordering tx at the expense of users, these builders will be included in the “dishonest” blacklist.
MEV-Share is an open source protocol that provides a framework for users, wallets, and applications to internalize the MEV created by their transactions. Specifically, it is implemented through a so-called orderflow auction. It allows users to selectively share data about their deals with searchers, who then bid to have those deals included in bundles. Users can choose how to redistribute searcher bids, such as to themselves, validators, or other parties. MEV-Share is trustworthy, neutral, permissionless to searchers, and does not favor any one block builder. Designed to reduce the centralizing impact of exclusive orderflow on Ethereum while enabling wallets and other order flow sources to participate in the MEV supply chain. Users can submit transactions to Flashbots MEV-Share nodes to earn MEV refunds from MEV-share.
The essential difference between PropellerRPC and MEV-Share is that one uses an algorithm, and the search may backrun and return profits to users; the other uses an auction method to involve all searchers and return profits to users through full competition. The core of MEV prevented by both is to bypass the public memory pool and send users’ transactions privately to slow down MEV. Most DEXs have integrated private RPC nodes for users to enable and choose.
2. Mechanism Innovation—Order Packaging Auction
The user does not need to send a transaction to submit a transaction, but the user is required to send a signed order. All open orders are packaged into a Batch and handed over to the solver to find the optimal solution. The optimization path comes from off-chain Coincidence of Wants (CoW) on the one hand, and relies on on-chain liquidity on the other. The Dutch auction method selects the best solution, and third-party payment Gas is submitted on behalf of the user. Batch auctions allow transactions within a batch to have the same unified clearing price, so there is no need for miners to reorder transactions.
There are many benefits of order packaging: reducing the chance of orders being rushed or being attacked by sandwiches, improving prices, increasing available liquidity and optimizing transaction routing. For detailed demonstration, please refer to our other report “CowSwap’s DEX form of future Intent?” 》. But this approach has two obvious disadvantages:
- **It is difficult to determine which of Solvers’ different solutions is optimal. **For a single order, it is obviously simple to maximize the user’s income. But if there are multiple users in a transaction, it is difficult to judge the solution between solvers. For example, one solution may be good for A, but not so good for B and C; but another solution may be good for B, but not so good for A and C. The market is not yet sure whether there is a decentralized and reliable standard for judging solvers’ solutions.
- CoWSwap proposes a “maximizing surplus” strategy, choosing a solution that can create the largest overall surplus for all participating users to process packaged orders. This approach is based on the principle of collective optimality rather than individual optimality. In actual operation, solvers consider all orders through algorithmic optimization and try to find an overall optimal match. This may involve completing complex “demand coincidences” across multiple orders to find an overall most efficient trading combination, so that Maximize the total satisfaction of all users. It can be used as a reference for research and study.
- **The waiting time will be longer than the execution time. **For inactive targets, large price fluctuations may occur during the waiting process due to the influence of the AMM curve. However, for participants who conduct large-amount transactions, especially those who do not need to complete transactions immediately, such as DAO, this method provides a better option. It allows these users to trade with better price execution and reduced market impact, while potentially gaining better slippage protection and fee optimization from batch processing. This mechanism can provide significant financial benefits to users who seek cost-effectiveness and can tolerate longer settlement times. This is also the reason why 1/3 of DAO’s transaction volume occurs on CoWSwap (source: Dune).
3. Mechanism innovation - outsourcing orders
CoW, UniswapX, 1inch fusion, etc. all hope to solve the MEV problem through mechanism innovation. If Uniswap is used as the industry benchmark for DEX, outsourcing order solutions may even be a trend. Because it is much more convenient to hand over the execution of the order flow to a professional filler. The user signs the transaction order, and the execution logic is pulled from the chain to the off-chain. The counterparty executes the transaction and has a pre-guaranteed transaction result, which is guaranteed by the smart contract verification guarantee.
Specifically, UniswapX outsources the complexity of routing to third-party fillers. These fillers compete to use on-chain liquidity (such as Uniswap v2 or v3) or their own private liquidity deposits to execute users’ transactions while paying gas for the users. Anyone can become a third-party filler on UniswapX exchange, and Dutch auction pricing value guarantees the best price. CoWSwap packages transactions, ranks the solver’s solutions, and grants the execution rights of the transaction. 1inch is similar to UniswapX, except that the resolver allows solving in chronological order.
Especially after Uniswap v4 is launched, due to the special nature of Hook, a large number of pools with the same currency pairs will appear. Without powerful tools, it would be nearly impossible for users to find the best route on their own when faced with the complex mathematics of AMM. So the way to outsource orders is to actually outsource routing and execution to the market and say, whoever gives me the best execution can trade.
The difficulty with this approach is ensuring that these solvers/fillers behave as expected.
- One solution is to introduce a reputation mechanism: through monitoring, when they misbehave, they are cut off from the order flow and have to pay a penalty to be relisted.
- Another solution is to create a highly competitive market. In this market, user orders can be executed permissionless, meaning anyone can participate. By leveraging MEV-Share, permissionless collaboration between users or order flow providers and MEV Searcher can be facilitated while protecting privacy and commitment. In the long run, this permissionless execution will greatly increase the competitiveness of the market, thereby providing users with better prices.
Another difficulty is: how to benchmark the best execution?
- The first line of defense, and one that is always guaranteed, is the limit price you set in your order. The second line of defense is EBBO (Exchange Best Bid and Bid) to obtain the best price visible on the chain, that is, taking into account the quotes from DEXs such as Uniswap, Balancer, etc.
- Due to the existence of private memory pools, providing optimal execution may be limited by memory pool access rights. In order to solve this problem, you can consider implementing SUAVE. This plug-and-play architecture aims to provide a common memory pool and block building network for all blockchains. In the process of building blocks (block building), the chain will be All pending information is taken into account.
4. Slippage optimization
In order to avoid failed transactions, DEXs often set higher default slippages. For example, Uniswap provides a default slippage of 0.3%. However, static slippage settings have limitations. If the slippage is too small, the transaction may fail, and if the slippage is too large, it may cause losses to the user. Under certain market conditions, such static settings can lead to severe trading drawdowns, causing frustration and potential losses to users.
DODO’s latest dynamic slippage based on time series prediction model can recommend appropriate slippage to avoid user losses while ensuring the success rate. It utilizes the ARIMA model, a proven and robust time series predictor with dynamic slippage that has demonstrated 98% accuracy in backtesting. Designed to help users reduce potential losses during the exchange process while maintaining a high success rate.
Even for long-tail currencies known for their “unpredictability”, 95.8% of actual prices closely conformed to the predicted confidence intervals. Performance was even better when tested under more stable market conditions, with 97.2% of actual prices staying within the predicted confidence intervals. Demonstrating the flexibility of its model, it can adapt seamlessly to different market sentiments.
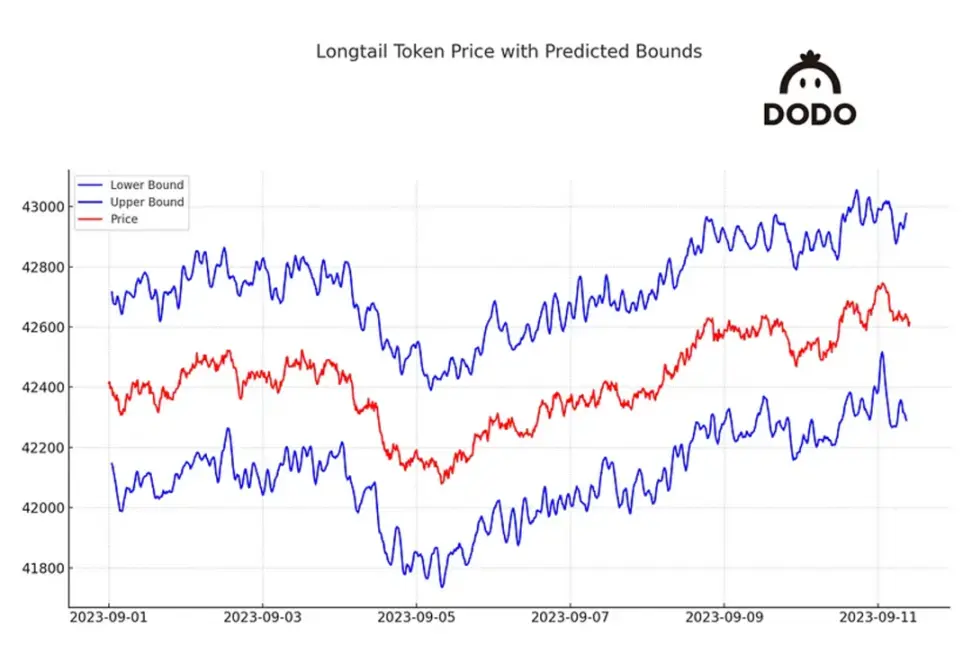
“Dynamic slippage” diagram: price prediction and actual trend of long-tail currencies during market fluctuations, source: @DODO
Sushiswap has launched the function of automatically detecting “taxed tokens” (taxed tokens are tokens with transaction “taxes”, that is, additional fees when buying, selling, or transferring tokens). If the UI displays “Low Slippage: This transaction may not succeed due to price changes or transfer fees” as shown below, it may be a taxable token. At this point the token’s tax percentage needs to be added to the original tolerance.
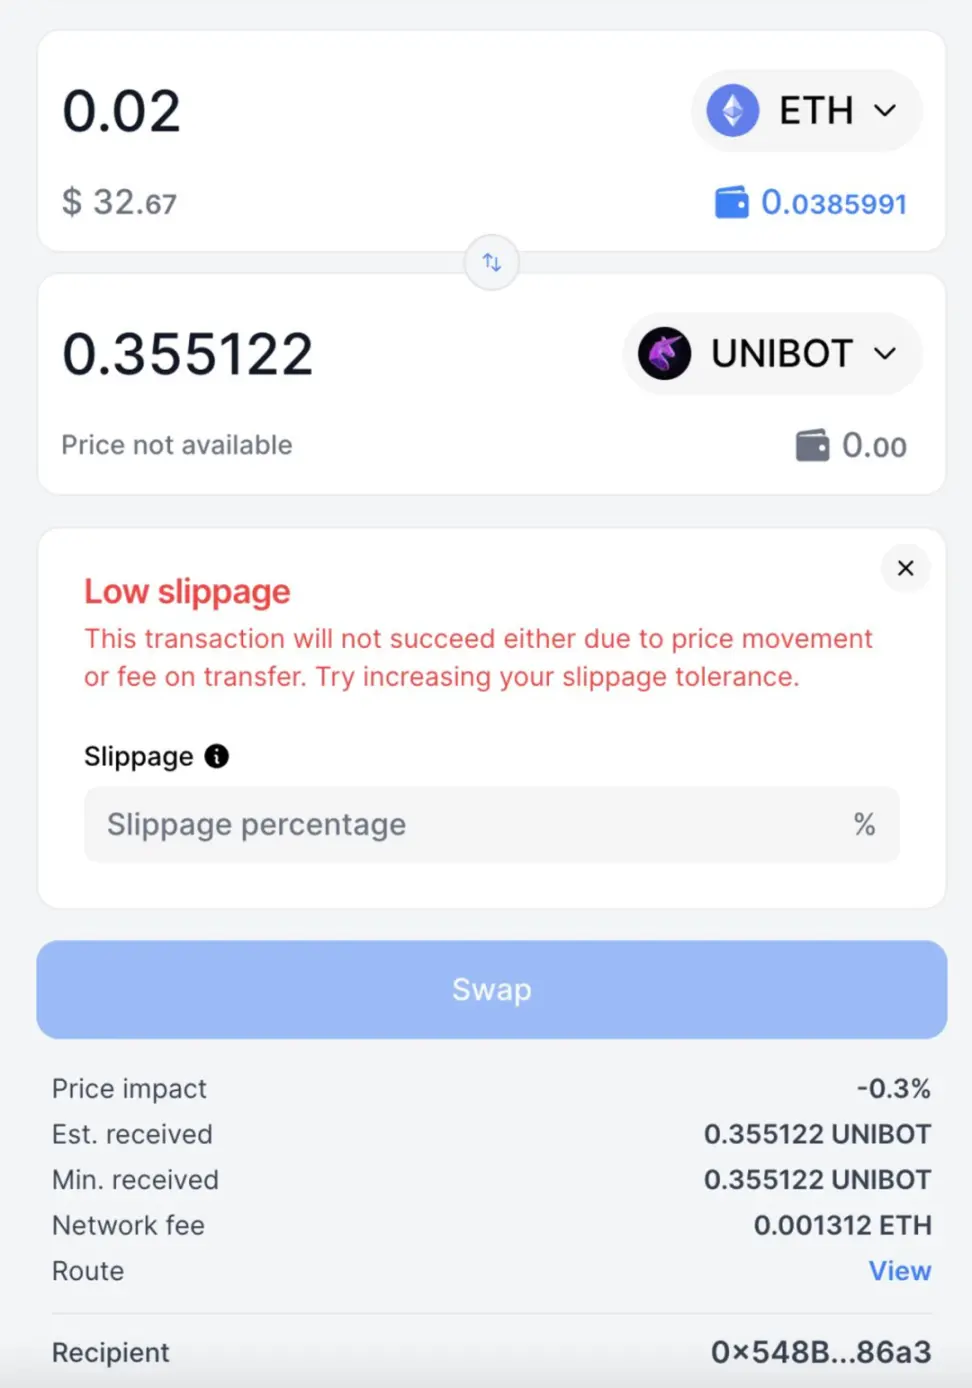
Lower slippage trading taxed tokens may result in failed trades, source: SushiSwap
5.Transparency
DEX routes orders to private nodes instead of public trading pools. **While protecting users, it also brings systemic risks. **Flashbots strives to be permissionless for all market participants. Users can choose where order flow is sent and to which builders when using Flashpots Protect.
The difficulty with this approach is how to eliminate the cat-and-mouse game with searchers from the system design, i.e. without spending a lot of time, investment and resources to identify when someone is actually misbehaving in the system. It’s a system that doesn’t require supervision, that doesn’t require constant human resources in the system to know if it’s working properly.
Written at the end
The MEV cake from the Black Forest exudes an alluring aroma. The profit of DEX MEV in the past 30 days has reached millions of dollars, which means that the losses to users are still relatively large. After explaining the MEV process in detail, we also came up with the necessary conditions for MEV (taking the sandwich attack as an example): 1. Trigger a liquidity shift; 2. Sequence transactions; 3. Ensure that the slippage range is not exceeded. In transaction ordering, miners need to pay fees to bribe miners to ensure that Back-run follows Victim, maximizing profits while ensuring that it is not preempted and exploited by other MEV bots. Bribing miners is a major/major expense for MEV Bot, and triggering liquidity deviations without exceeding the slippage range after the attack also poses highly difficult computational requirements for MEV bot. The remaining costs are incurred in hardware facilities to ensure that bundled transactions can be broadcast to nodes around the world in a short time.
A closer look at the causes of MEV in DEX shows that they are related but not identical. Taking Uniswap as a benchmark, there are some universal conclusions. For example, the greater the market volatility, the higher the frequency and profit of sandwich attacks and arbitrage attacks; the profit amount of a pool with larger transaction volume tends to be greater; MEV’s income is positively related to the “effort” of the MEV bot. However, each DEX has its own characteristics. Based on this, each has evolved a unique distribution in the occurrence of MEV. For example, Curve has a multi-currency pool and a wealth of linked asset trading pairs, so arbitrage is particularly profitable in Curve, and it is not easily affected by market fluctuations, making arbitrage difficult. Another example is that DODO focuses on the trading of stable currency pairs. It uses active market making to provide excellent liquidity depth, allowing MEV’s sandwich attack to take advantage of it, contributing 60% of DODO’s total trading volume. Comparing PancakeSwap’s performance on BNB and Etherum proves that the mechanical characteristics of DEX are not the only variable that affects MEV distribution. The infrastructure of the public chain and the number of protocols will also change the MEV distribution of the DEX. For example, the Etherum chain has richer protocols than the BNB chain, providing more options for MEV attacks. In comparison, the occurrence of MEV is more intense. The MEV on Etherum in Pancakeswap is higher than the BNB chain may also depend on Etherum having a more complete basic design, which provides tools for MEV.
Facing the above situation of DEX MEV, from DEX to infrastructure, the Web 3 world is actively seeking solutions. We have collected and compiled 5 types of solutions: private RPC nodes, order packaging auctions, outsourced orders, slippage optimization and transparency. Private PRC hopes to stifle MEV discovery by bypassing permissionless visibility into the public memory pool. Order packaging auctions and outsourcing orders are both mechanism innovations. The former packages and executes multiple open orders, and through demand coincidence and unified clearing price, it improves efficiency while preventing MEV bot from using transaction ordering to manipulate prices. The representative project is CoWSwap; the latter hands over orders to any solver without permission. After full competition in the market, the solution that is most beneficial to users is selected and implemented, and “involution” is used to slow down MEV bots from doing evil. The representative project is UniswapX. Slippage optimization is essentially product optimization. The representative project is DODO’s “Dynamic Slippage”, which intelligently recommends slippage while ensuring the success rate and allowing sandwich attacks to take advantage of it. Transparency is the vision of Flashbots. Through the design of the system, the user’s orders in the Black Forest are exposed to the sun, and normal operation is maintained in a self-supervised manner.
** Special thanks to the EigenPhi team for providing high-quality MEV data, and to EigenPhi researchers Yixin and Sophie for participating in article discussions. These data and suggestions are crucial to our analysis. *
References
mev/ethereum/tx/0x3f277f57dcaea592cd2bcddb135b45833b8b5462fd91b548576752400ced8bae

