In a recent development that has caught the attention of the market, Bitcoin (BTC) appears to be at a potential turning point. A crucial on-chain indicator, Inter-exchange Flow Pulse (IFP), that tracks the flow of Bitcoin between ious trading platforms, has just fallen below a critical point. This shift is seen as a correction mode for Bitcoin with the rising profitable BTC supply.
IFP’s Decline Signals A Market Top For BTC Price
Following the SEC’s approval of 11 Bitcoin Exchange Traded Fund (ETF) applications on Wednesday, January 10, Bitcoin’s price experienced a notable surge, increasing approximately 5% from $45,300 to a peak of $47,600. However, this initial spike was followed by a partial pullback, leading to a more stable trading pattern overnight.
Despite this volatility, Bitcoin’s value did manage to climb above the $49,000 threshold later on. This rise, though, was short-lived as the market witnessed an exit of short-term holders around this price level, leading to significant selling pressure. According to data from Coinglass, this resulted in a total market liquidation of around $82 million for Bitcoin, with a substantial $47 million of this being attributed to long position liquidations.
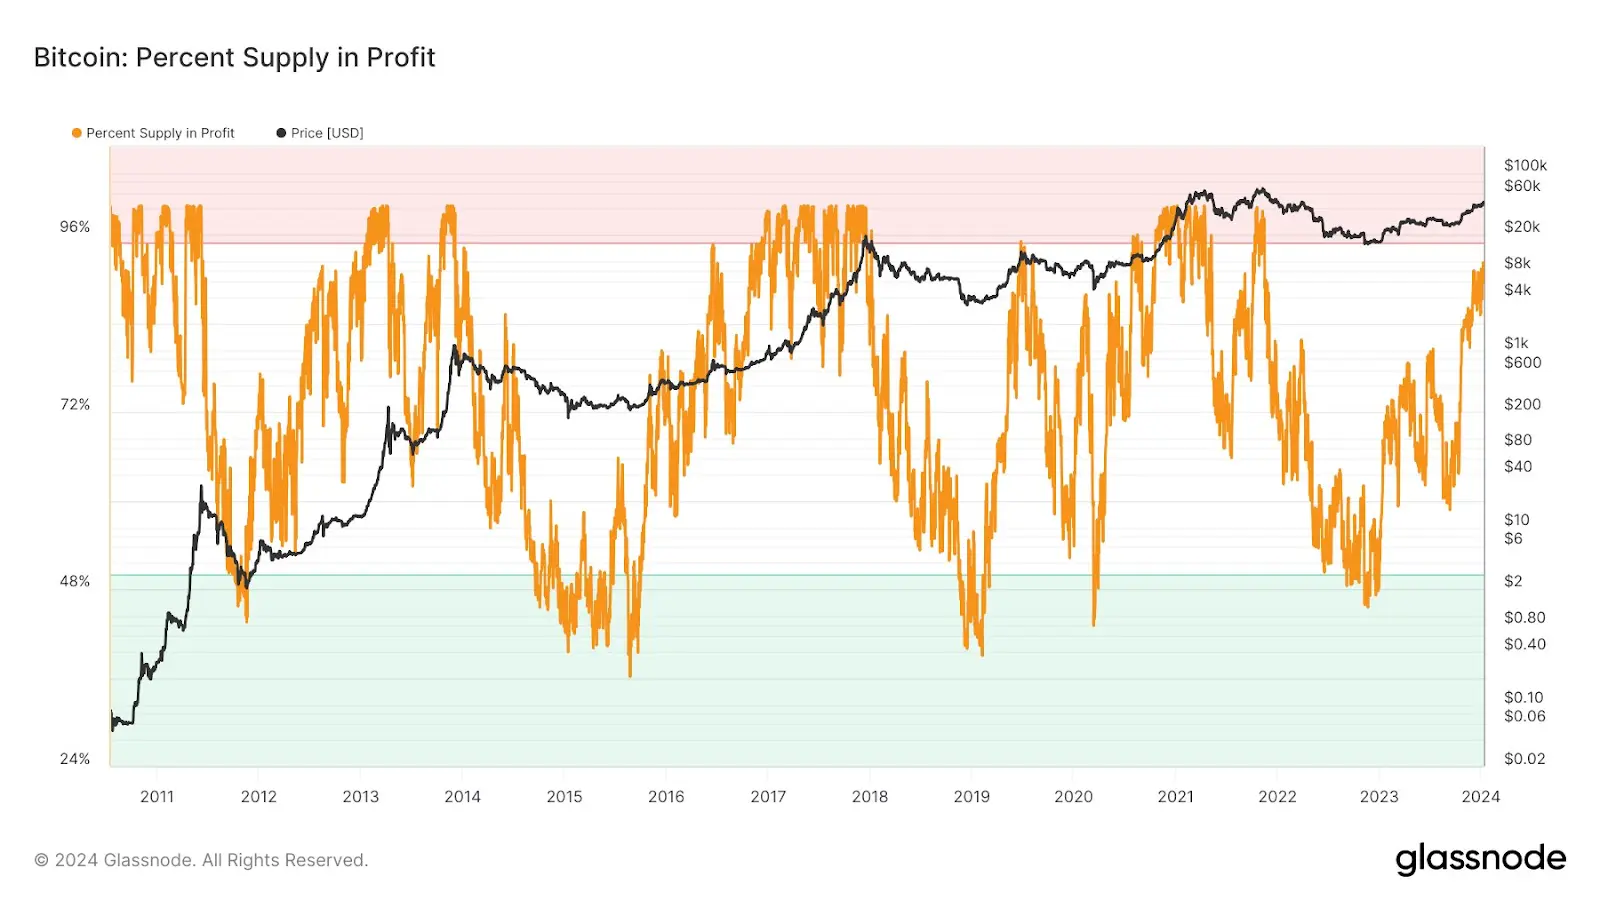 According to several market analysts, there’s a rising concern of a significant correction for the BTC price as holders are already in a high profit margin. According to a prominent crypto analyst, Crypto Rover, 94% of all Bitcoin supply is in profit. This figure is significant as it suggests that the majority of Bitcoin holders could sell their holdings for a profit, which may add selling pressure and contribute to a bearish market sentiment.
Additionally, another analyst, Ali Charts, states that the Inter-exchange Flow Pulse (IFP), that tracks the flow of Bitcoin between ious trading platforms, has just fallen below its 90-day average. When this metric experiences an increase, it indicates that investors are currently moving a larger quantity of coins from spot to derivative exchanges, signaling a willingness to engage in riskier ventures. Conversely, lower values of this metric imply that there is currently minimal capital being channeled into derivative exchanges.
As a result, the current reverse in the IFP chart suggests that Bitcoin price might have reached its top and is now preparing for a correction.
In the midst of excitement over Bitcoin ETFs, there’s been speculation about a potential drop in Bitcoin’s price following ETF approvals. However, current viewpoint suggests that Bitcoin might actually rally by 10% above $50,000 before a minor pullback. However, there’s a 40% chance of a drop toward $42K before any upward surge.
What’s Next For BTC Price?
Bitcoin surpassed the key level of an ascending triangle pattern, signaling the beginning of a new uptrend phase. However, sellers strongly defended further surges and BTC price declined from $49K heavily. As of writing, Bitcoin trades at $45,906, declining over 2.9% from yesterday’s rate.
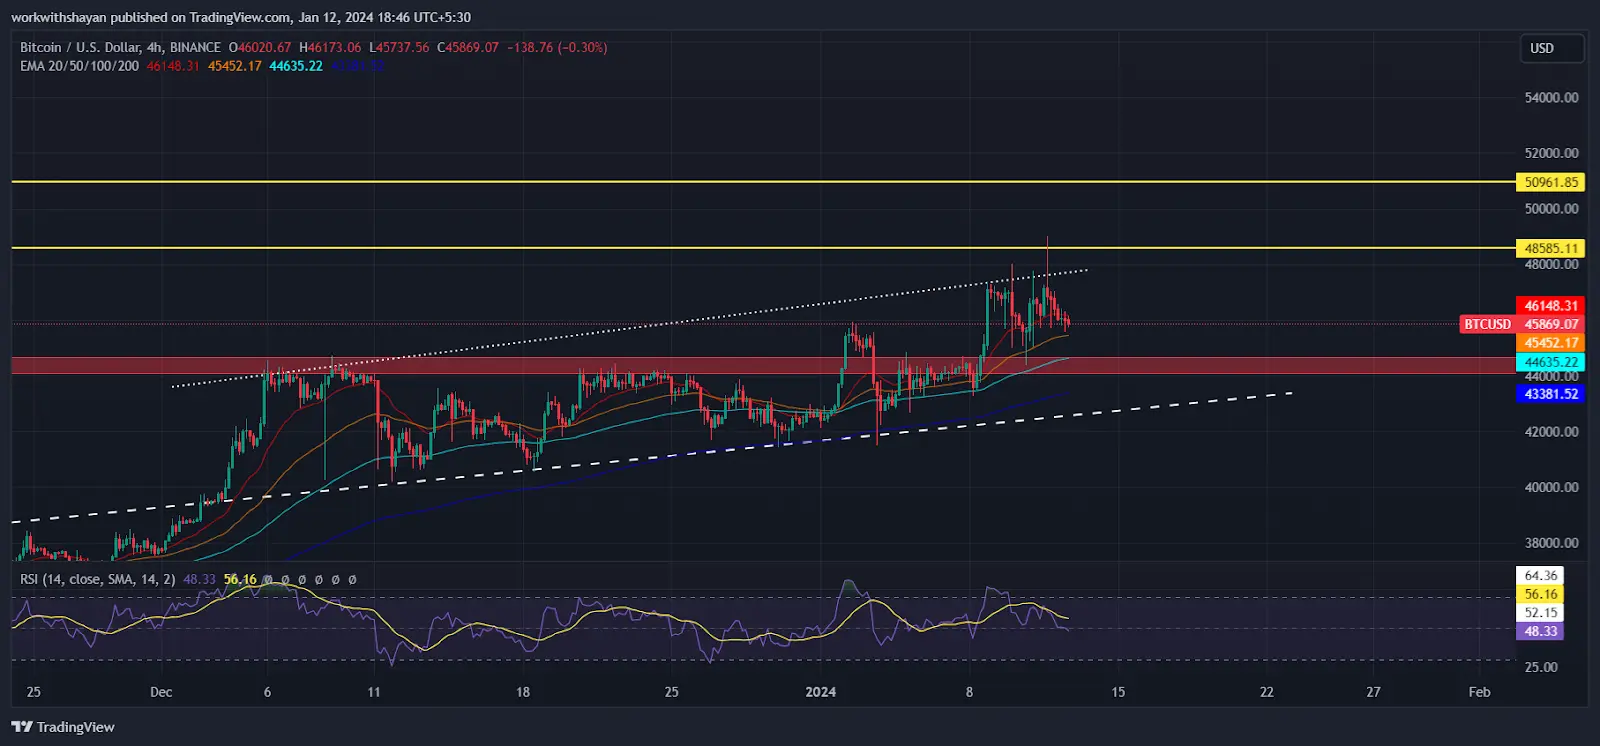 However, bulls are actively attempting to push the price above the critical resistance point of $48,500, aiming to catch aggressive sellers off guard. Should they succeed, the BTC price might face a significant buying demand, potentially surging toward the resistance zone of $50K-$52K.
However, bears will strongly defend a surge above the 20-day EMA on the 4-hour price chart. If the BTC price continues to remain below the EMA20 level, we might see the BTC price declining toward $44,200. In such a case, Bitcoin might test buyers’ patience at $42,000. However, this level might witness a strong buying demand, rebounding the price immediately.
Disclaimer: The information on this page may come from third parties and does not represent the views or opinions of Gate. The content displayed on this page is for reference only and does not constitute any financial, investment, or legal advice. Gate does not guarantee the accuracy or completeness of the information and shall not be liable for any losses arising from the use of this information. Virtual asset investments carry high risks and are subject to significant price volatility. You may lose all of your invested principal. Please fully understand the relevant risks and make prudent decisions based on your own financial situation and risk tolerance. For details, please refer to
Disclaimer.
