Cardano (ADA) is currently trading around $0.264 on March 21, just above a dense liquidation zone. If the price adjusts downward by about 4% to $0.253, the market could see up to $9.93 million in long positions forced to close.
On-chain data shows selling pressure has eased somewhat as the network’s realized loss has significantly narrowed from March’s lows. This suggests the “giving up” phase may be over. However, the current derivatives structure still carries short-term downside risk.
Sellers Still Hold the Advantage
According to Santiment data, Cardano’s realized profit/loss index has remained negative from February 19 to March 20, with losses ranging from -6.56 million to -47.38 million ADA.
Notably, the deepest low occurred on March 8 at -44.28 million ADA, coinciding with the price bottom when ADA hit $0.2547. Since then, this indicator has improved markedly, now at only -10.04 million ADA — a roughly 77% reduction.
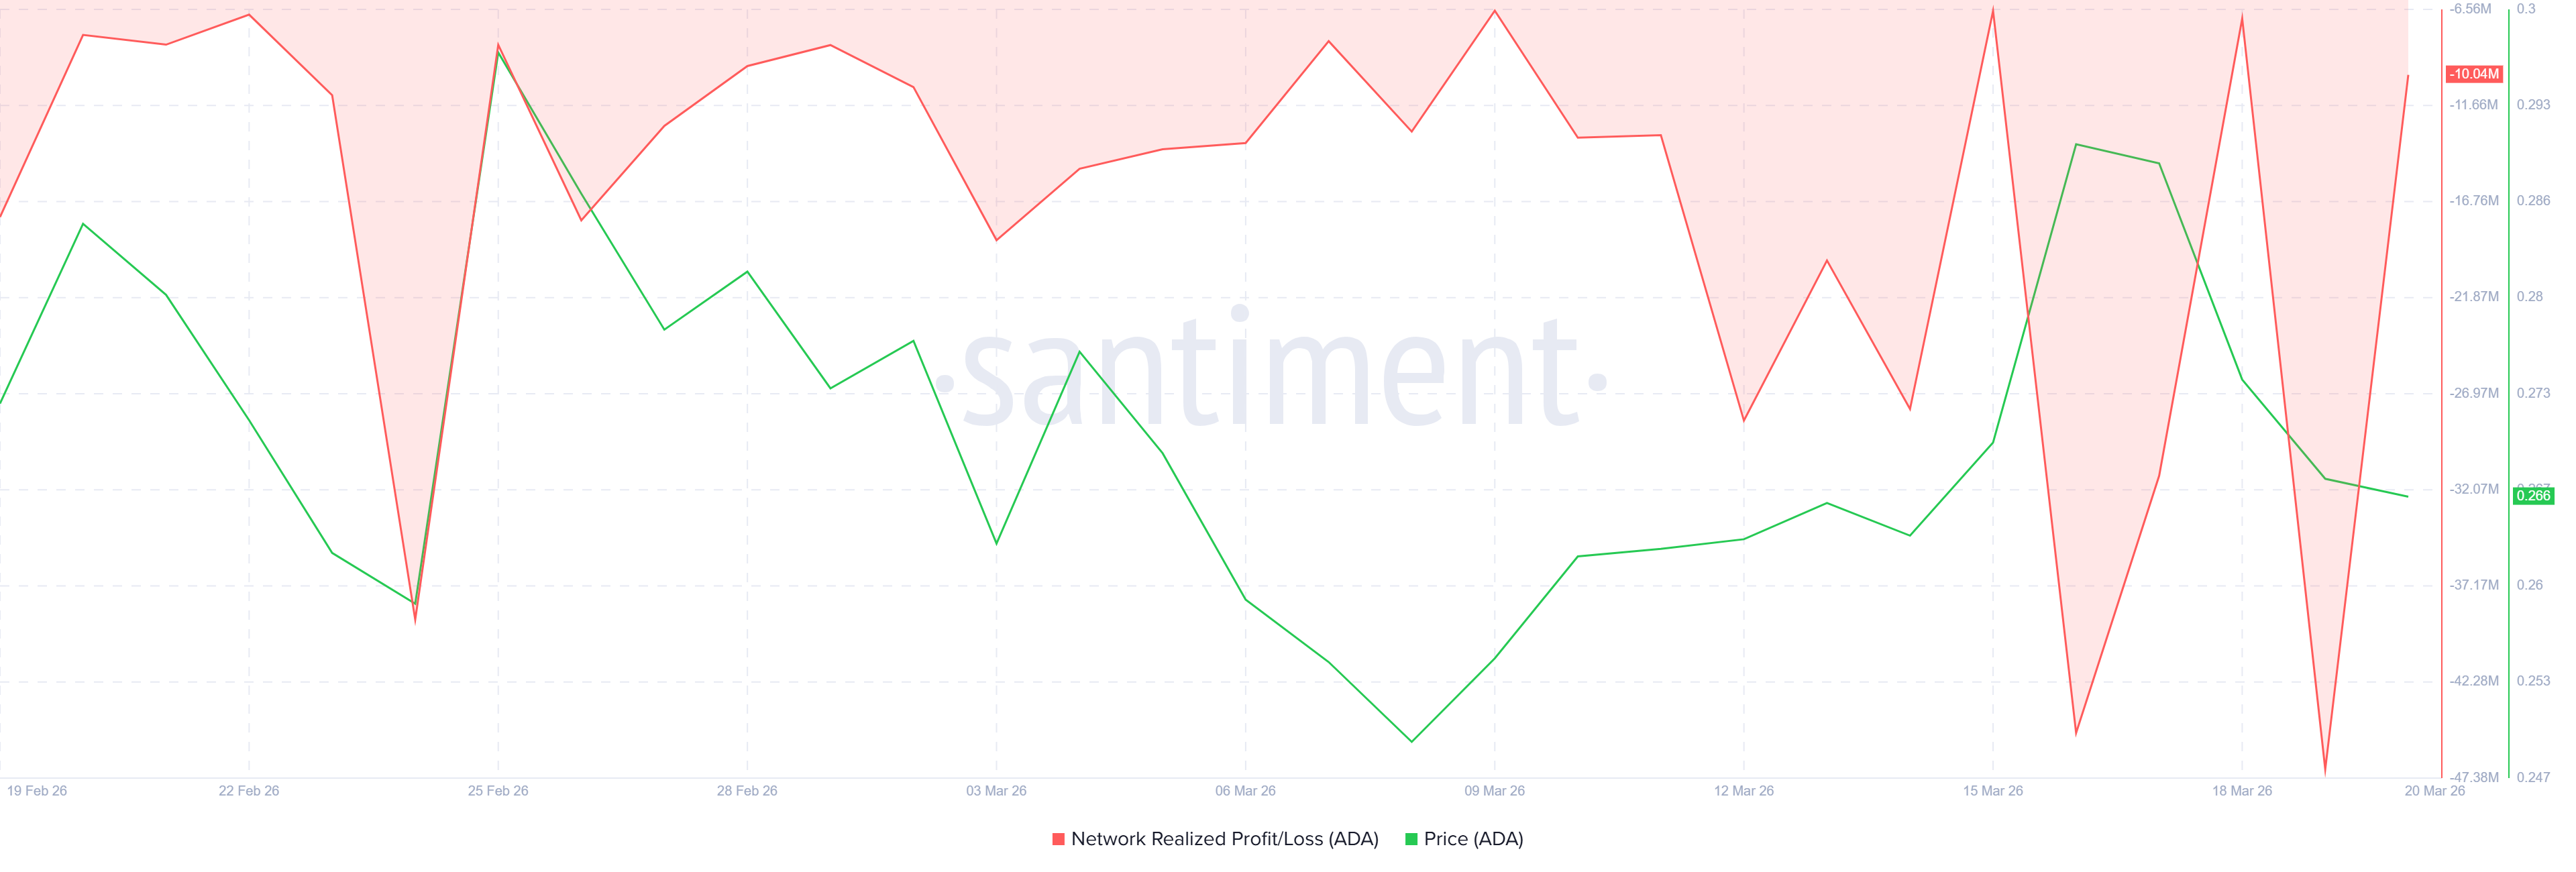 Cardano’s Realized Profit/Loss | Source: Santiment However, the fact that it hasn’t turned positive indicates the market is still in a net distribution phase. Investors continue to cut losses rather than take profits, weakening buying momentum and maintaining downward pressure until the “shakeout” completes.
Liquidation Risks Weigh on Long Positions
The liquidation map shows pressure concentrated below the current price, with a dense cluster of long liquidations from $0.275 down to $0.253. At the $0.254 level, the total value of positions at risk of liquidation approaches $9.93 million.
Conversely, short liquidations are concentrated above $0.277, reaching about $20.89 million at the $0.300 region.
This creates a typical “liquidity squeeze point,” with ADA’s price trapped between two opposing liquidation zones. However, the nearest — and most easily triggered — cluster is below.
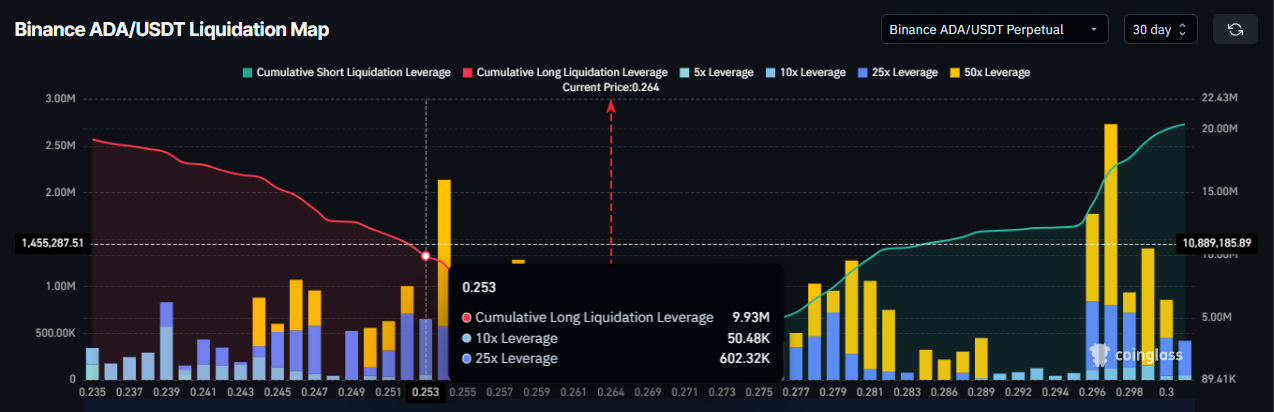 Cardano Liquidation Map | Source: Coinglass In this context, market makers tend to push the price toward the $0.253 area, requiring only about a 4.1% correction without a deep breakdown that would break the trend.
On the other hand, to sweep short liquidity, the price needs to rise nearly 5%, and more importantly, close firmly above the resistance at $0.2856 — a level that has repeatedly rejected recent recoveries.
Resistance Zone Continues to Limit Upside
Currently, ADA is trading at $0.2641, while the Parabolic SAR indicator is at $0.2532 — confirming the short-term uptrend remains valid. However, the price is stuck within a key resistance zone from $0.2856 to $0.3004.
Since late January, all attempts to break through this zone have failed. Most recently, from March 15 to March 17, ADA rose to $0.2920 but quickly reversed and fell back below $0.2856, reinforcing this area’s role as resistance.
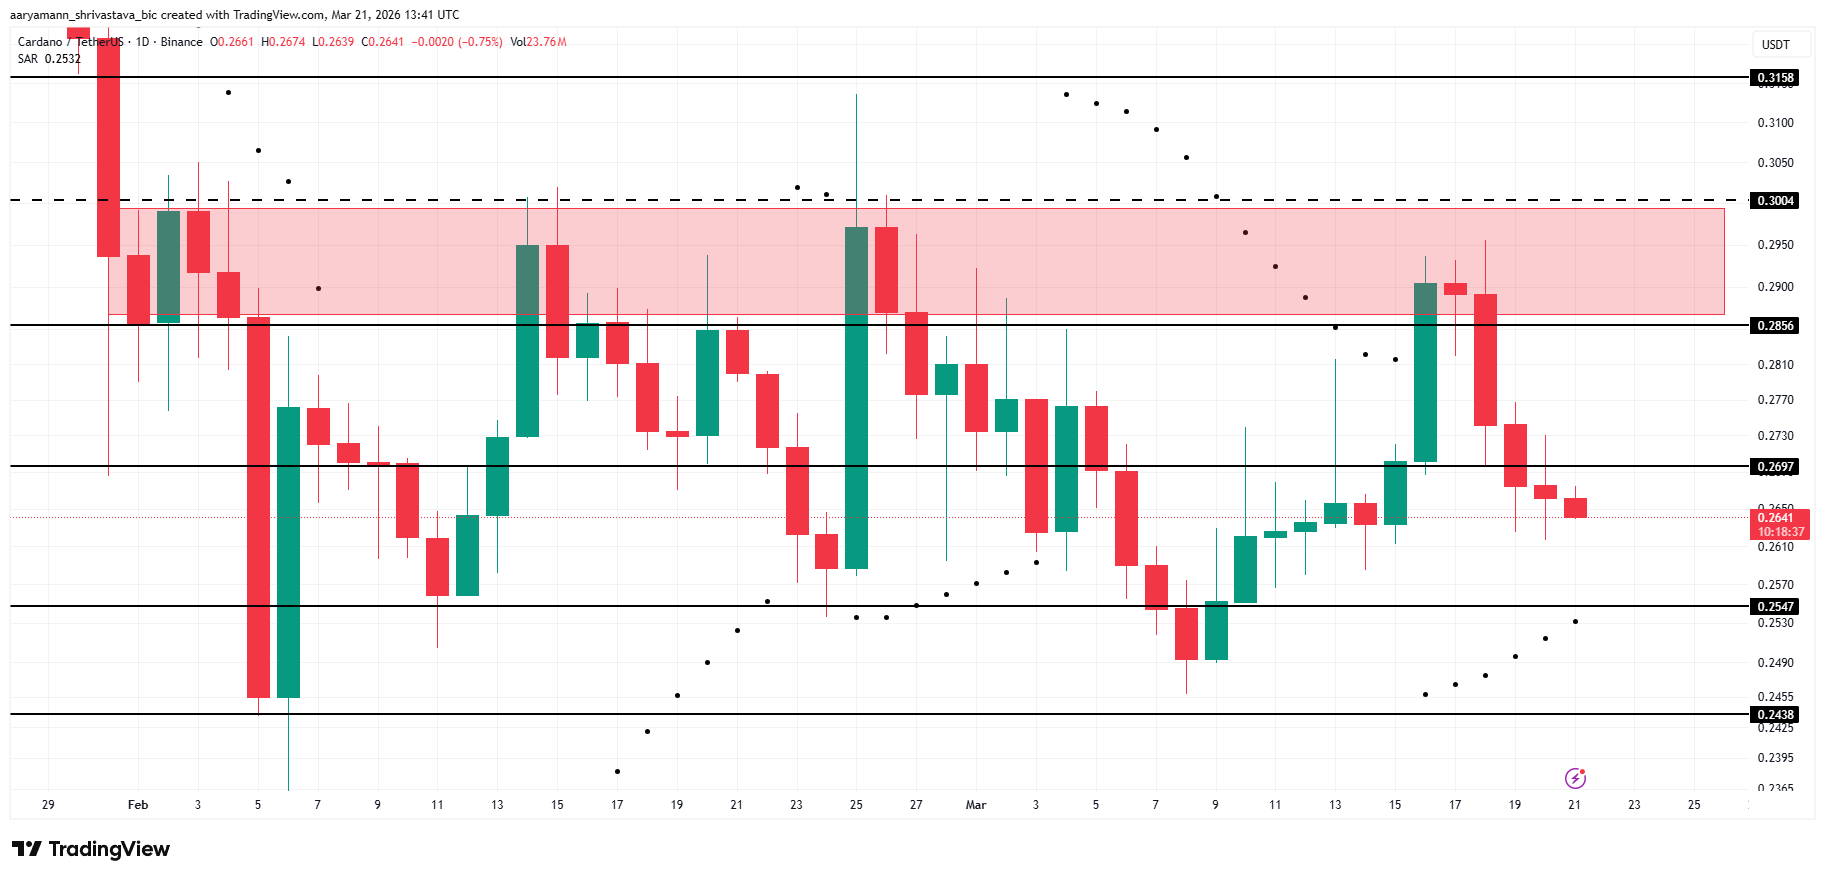 Cardano Price Analysis | Source: TradingView Below, notable support levels are at $0.2697, $0.2547, and deeper at $0.2438. The $0.253 target from the liquidation map lies between the last two support zones, indicating that a long liquidation sweep could lead to testing the $0.2438 level again.
To regain control, buyers need a clear daily close above $0.2856. This would turn the resistance zone into support, paving the way for a rally toward $0.3004 and further to $0.3158. Meanwhile, the Parabolic SAR at $0.2532 should be maintained as a solid support base.
Disclaimer: The information on this page may come from third parties and does not represent the views or opinions of Gate. The content displayed on this page is for reference only and does not constitute any financial, investment, or legal advice. Gate does not guarantee the accuracy or completeness of the information and shall not be liable for any losses arising from the use of this information. Virtual asset investments carry high risks and are subject to significant price volatility. You may lose all of your invested principal. Please fully understand the relevant risks and make prudent decisions based on your own financial situation and risk tolerance. For details, please refer to
Disclaimer.
