Bitcoin (BTC) is maintaining a recovery momentum around the $67,000 level at the time of the recording on Tuesday, as selling pressure has weakened amid Donald Trump considering withdrawing from the Middle East without reopening the Strait of Hormuz. Derivatives markets have started sending bullish signals, evidenced by an increase in open interest for Bitcoin futures contracts, the long/short ratio tilting toward the bulls, and the funding rate staying in positive territory. Meanwhile, altcoins such as River (RIVER), Sky (SKY), and Chiliz (CHZ) have stood out with leading gains over the past 24 hours, moving in sync with the broader market’s recovery rhythm.
Early recovery signals in the Bitcoin derivatives market
Bitcoin is gradually drawing back the attention of retail investors as strong inflows into derivatives products aim to take advantage of leverage, amid expectations that Middle East tensions are easing. Data from CoinGlass shows that open interest in Bitcoin futures has risen by nearly 2% over the past 24 hours, to $49.70 billion, reflecting that new capital is actively participating and accumulating positions.
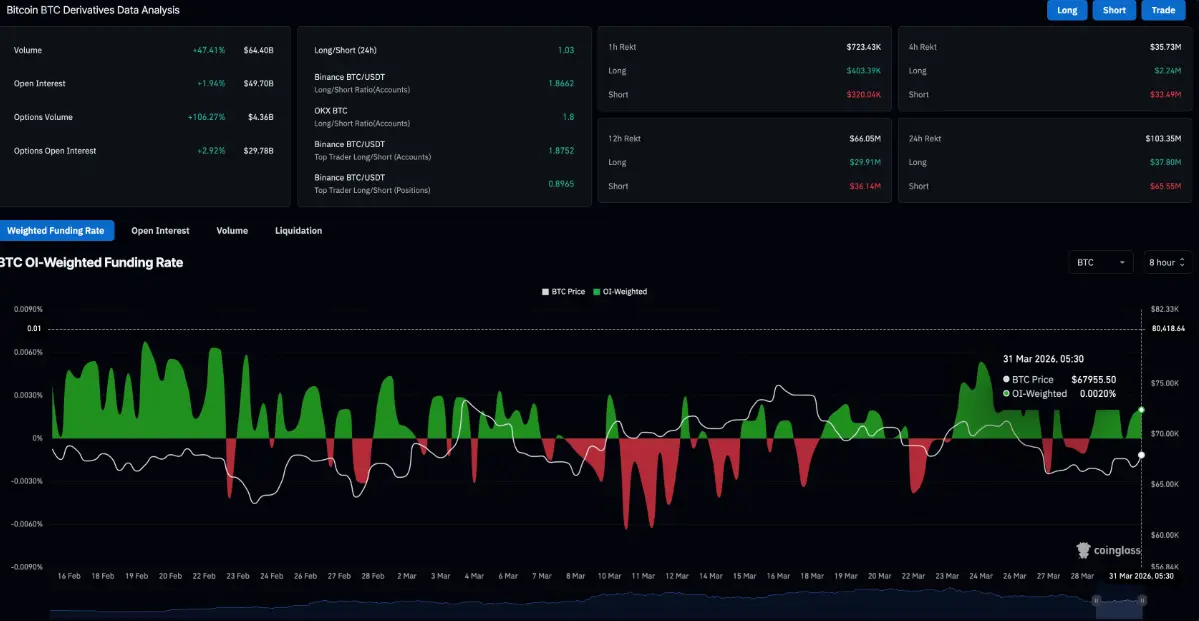
This uptrend is reinforced by the long/short ratio remaining at 1.03, indicating that the bulls clearly hold the upper hand. At the same time, the positive funding rate of 0.0020% shows that traders are willing to pay fees to hold long positions, thereby reflecting expectations that prices will continue to move higher.
In another development, the total liquidation value in the Bitcoin derivatives market reached $103.35 million over the past 24 hours, with short positions accounting for $65.55 million alone—an element that continues to strengthen bullish sentiment in the market.
Top coins surged: River, Sky, and Chiliz extend the recovery streak
River is up 3% at the time of writing, following the previous session’s breakout of 16%. Even so, the short-term trend still leans slightly downward as price remains below the 50-day EMA at $18.32, reflecting weakness in the medium-term momentum. If the price can close above this level, it is likely that the price will target the 50% Fibonacci level of the decline from $87.59 to $7.26, corresponding to $25.22.
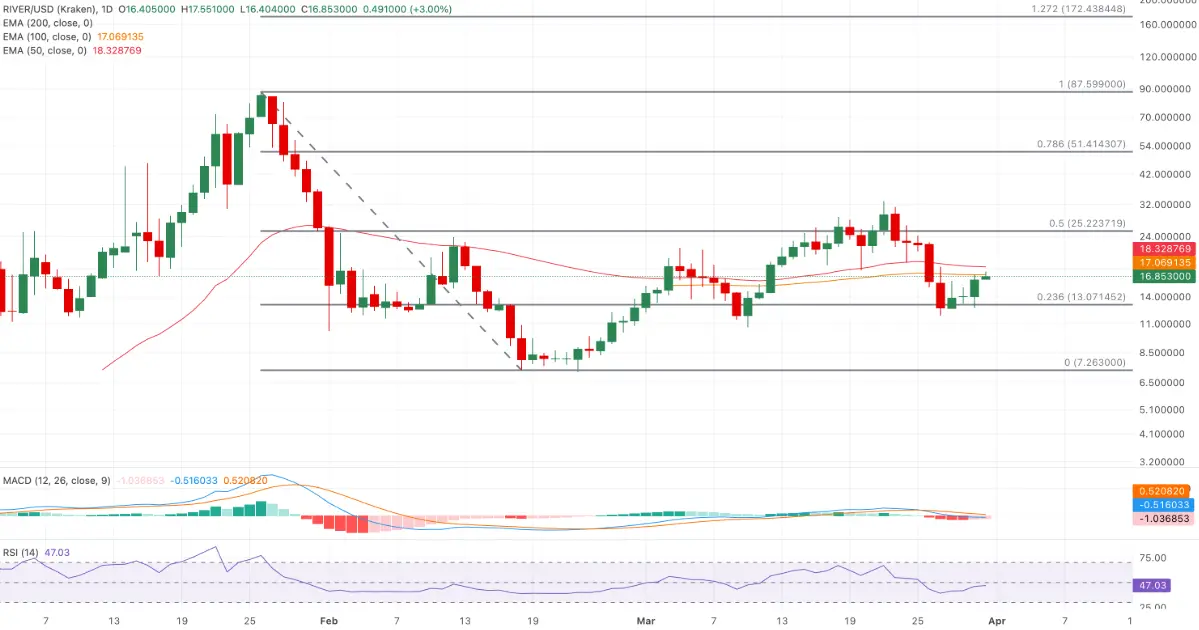 Daily RIVER/USDT chart | Source: TradingView
From a technical perspective, the MACD line of the MACD indicator is still below the signal line, with a negative histogram, indicating that downward pressure has not fully ended. The RSI is hovering around 47, below the neutral level of 50, reinforcing a mildly negative state rather than a strong sell-off. In the event of a pullback, the nearest support level is identified at the 23.6% Fibonacci level of $13.07.
Daily RIVER/USDT chart | Source: TradingView
From a technical perspective, the MACD line of the MACD indicator is still below the signal line, with a negative histogram, indicating that downward pressure has not fully ended. The RSI is hovering around 47, below the neutral level of 50, reinforcing a mildly negative state rather than a strong sell-off. In the event of a pullback, the nearest support level is identified at the 23.6% Fibonacci level of $13.07.
Sky is up more than 7% on Tuesday, marking the fourth consecutive day of recovery within the rising price channel on the daily timeframe. The nearest resistance level is around Pivot R2 at $0.08262; if the price closes above this threshold, the rally could be extended along the upper trendline, roughly $0.08500.
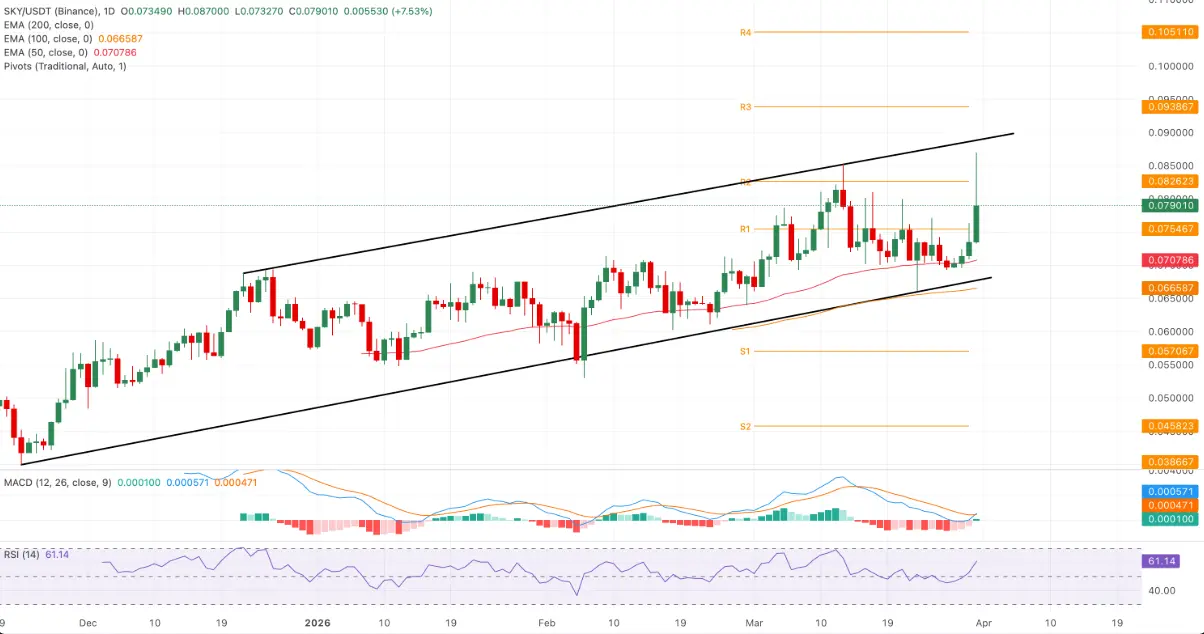 Daily SKY/USDT chart | Source: TradingView
The technical signals are leaning toward a positive scenario, as the MACD has just crossed above the signal line near the $0 mark, showing that upward momentum is gradually improving after the short-term correction. At the same time, the RSI stays at 61, having escaped the neutral accumulation zone, reflecting that buying pressure is gradually taking the lead but has not yet entered an overbought state.
Daily SKY/USDT chart | Source: TradingView
The technical signals are leaning toward a positive scenario, as the MACD has just crossed above the signal line near the $0 mark, showing that upward momentum is gradually improving after the short-term correction. At the same time, the RSI stays at 61, having escaped the neutral accumulation zone, reflecting that buying pressure is gradually taking the lead but has not yet entered an overbought state.
On the other hand, the 50-day EMA at $0.07078 acts as an important support. If the price closes below this level, the uptrend would weaken, increasing the risk of a correction toward the $0.06700 area.
Meanwhile, Chiliz continues to maintain a positive recovery pace on Tuesday, extending the up move by 6% recorded earlier. However, the upward trend is encountering significant resistance at the 50% Fibonacci level of the decline from $0.0643 to $0.0310, corresponding to $0.0446. If it breaks above this level, the price could extend the rally to the $0.0550 area, corresponding to the 78.6% Fibonacci level.
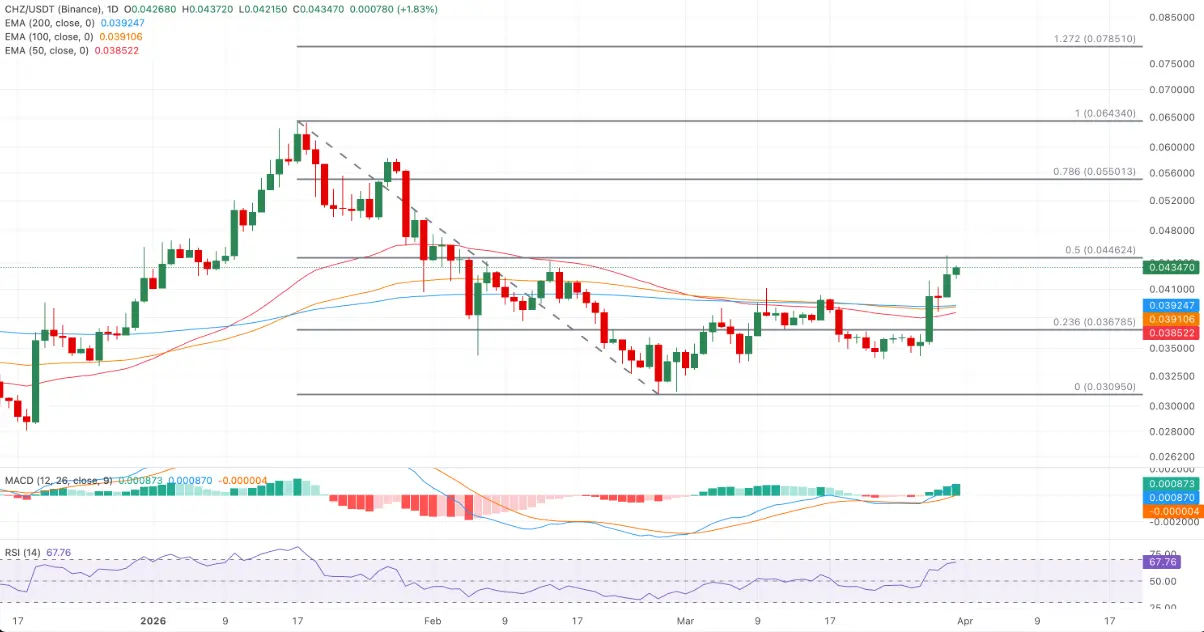 Daily CHZ/USDT chart | Source: TradingView
For technical indicators, the MACD line has crossed above the signal line and remains in positive territory, while the histogram continues to expand, reflecting that rising momentum is gradually being strengthened. The RSI is currently at 68, not yet falling into the overbought zone, but it still indicates that demand remains stable.
Daily CHZ/USDT chart | Source: TradingView
For technical indicators, the MACD line has crossed above the signal line and remains in positive territory, while the histogram continues to expand, reflecting that rising momentum is gradually being strengthened. The RSI is currently at 68, not yet falling into the overbought zone, but it still indicates that demand remains stable.
On the other hand, the nearest support zone is concentrated around the cluster of the 50-, 100-, and 200-day EMAs in the $0.0390 area; below that is the 23.6% Fibonacci level at $0.0367, which serves as an important buffer zone if correction pressure increases.
Disclaimer: The information on this page may come from third parties and does not represent the views or opinions of Gate. The content displayed on this page is for reference only and does not constitute any financial, investment, or legal advice. Gate does not guarantee the accuracy or completeness of the information and shall not be liable for any losses arising from the use of this information. Virtual asset investments carry high risks and are subject to significant price volatility. You may lose all of your invested principal. Please fully understand the relevant risks and make prudent decisions based on your own financial situation and risk tolerance. For details, please refer to
Disclaimer.
