Trade
Basic
Futures
Futures
Hundreds of contracts settled in USDT or BTC
TradFi
Gold
Trade global traditional assets with USDT in one place
Options
Hot
Trade European-style vanilla options
Unified Account
Maximize your capital efficiency
Demo Trading
Futures Kickoff
Get prepared for your futures trading
Futures Events
Participate in events to win generous rewards
Demo Trading
Use virtual funds to experience risk-free trading
Earn
Launch
CandyDrop
Collect candies to earn airdrops
Launchpool
Quick staking, earn potential new tokens
HODLer Airdrop
Hold GT and get massive airdrops for free
Launchpad
Be early to the next big token project
Alpha Points
Trade on-chain assets and enjoy airdrop rewards!
Futures Points
Earn futures points and claim airdrop rewards
Investment
Simple Earn
Earn interests with idle tokens
Auto-Invest
Auto-invest on a regular basis
Dual Investment
Buy low and sell high to take profits from price fluctuations
Soft Staking
Earn rewards with flexible staking
Crypto Loan
0 Fees
Pledge one crypto to borrow another
Lending Center
One-stop lending hub
VIP Wealth Hub
Customized wealth management empowers your assets growth
Private Wealth Management
Customized asset management to grow your digital assets
Quant Fund
Top asset management team helps you profit without hassle
Staking
Stake cryptos to earn in PoS products
Smart Leverage
New
No forced liquidation before maturity, worry-free leveraged gains
GUSD Minting
Use USDT/USDC to mint GUSD for treasury-level yields
More
通讯员
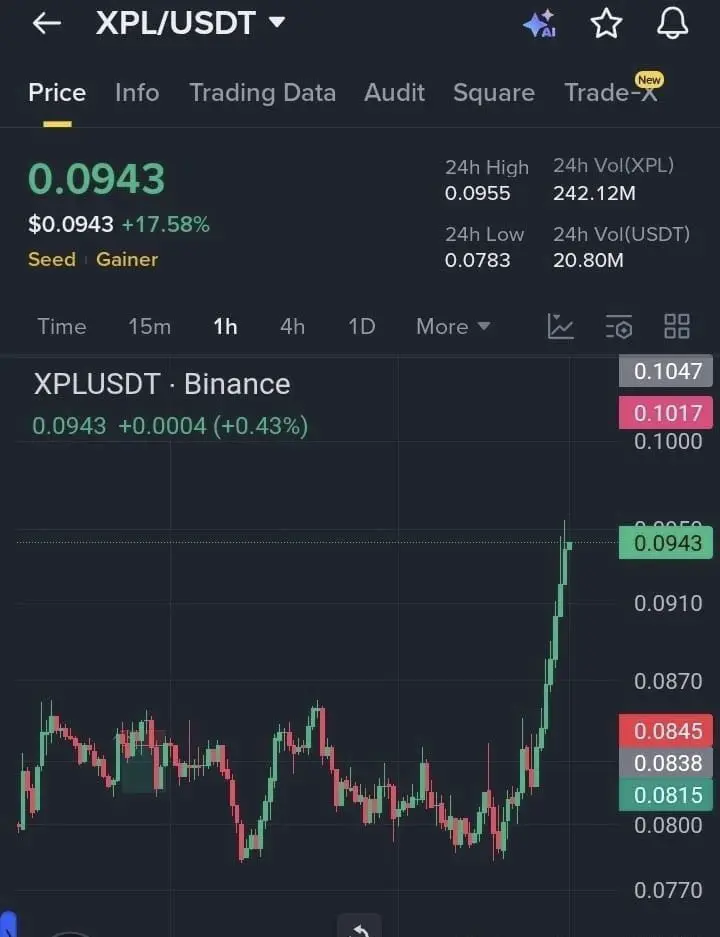
$XPL Crazy! 🚀
Entry: $0.0935 - $0.0945 🟩
Target 1: $0.1015 🎯
Target 2: $0.1050 🎯
Target 3: $0.1120 🎯
Stop Loss: $0.0875 🛑
Massive accumulation confirmed. Trading volume is exploding. Bullish momentum is undeniable. This is not a drill. The bull market is sprinting. Join now, don’t wait too long. The chart is screaming opportunity. This is your chance to make significant gains. Don’t get left behind.
Disclaimer: Risk is your own. $XPL #Gate广场发帖领五万美金红包
XPL19,59%
- Reward
- like
- Comment
- Repost
- Share
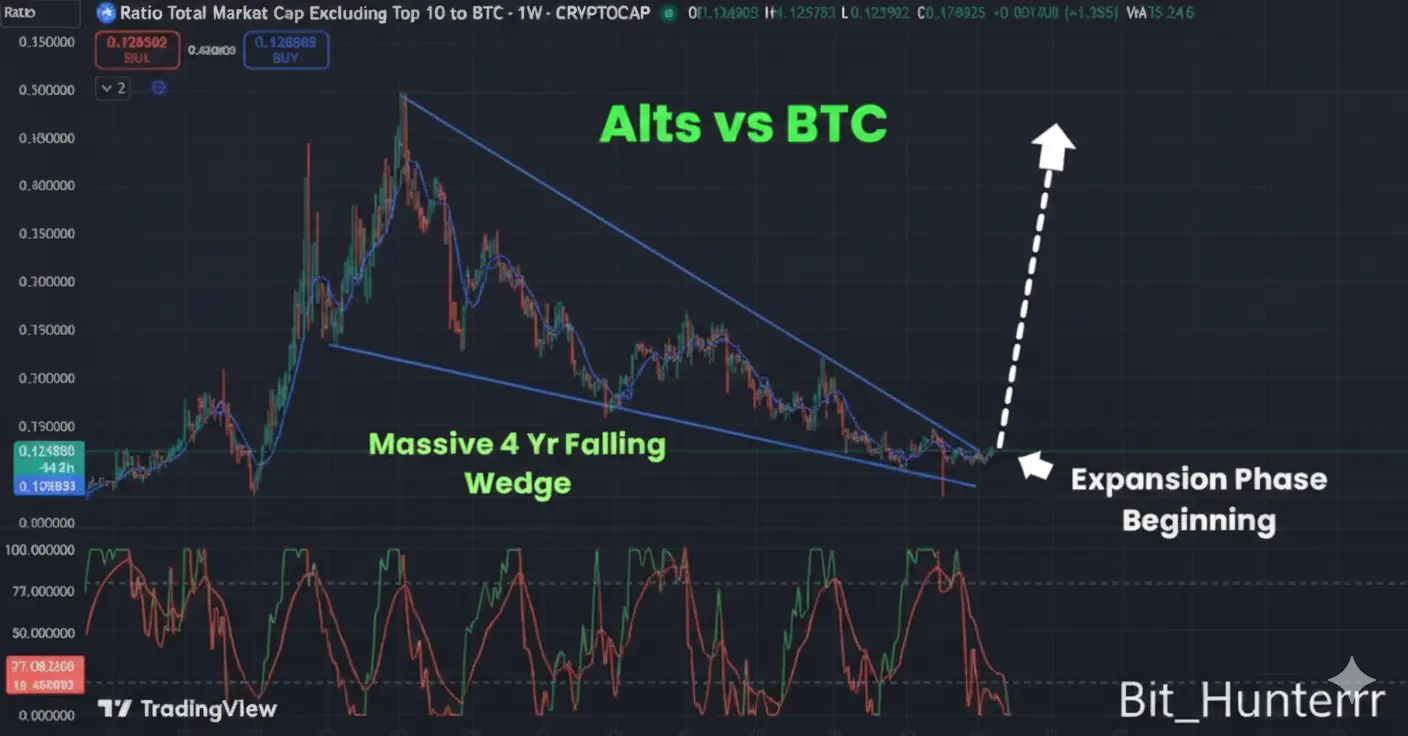
Alts vs BTC Falling Wedge 🔥
If 126K marked the BTC cycle top, then when macro liquidity rotates, it will chase asymmetric upside in alts like $TNSR , $BERA , and $0G .
History shows the potential:
- 2017 → Alts ran 10x–100x
- 2020–21 → TOTAL2 surged ~+1800%
Right now, sentiment is dead. Replies are full of disbelief—and that’s exactly what signals we’re near the bottom. Retail always shows up late, at the top. $TNSR $BERA $OG
- Reward
- like
- Comment
- Repost
- Share
Brothers, take a few minutes to seriously read the BTC post. Wishing everyone a Happy New Year and great wealth in 2026!#我在Gate广场过新年
$BTC "The Book of Changes" (I Ching) Hexagram 44 "Gou" (Coming Upon) states: "There is wind in the sky, Gou; later, it issues commands to the four directions." The upper trigram Qian represents Heaven, and the lower trigram Xun represents Wind. Wind spreads across the world, penetrating everywhere, symbolizing an unexpected encounter. However, this "meeting" is not all joy— the hexagram clearly states: "A young woman, do not take her," implying that those who
$BTC "The Book of Changes" (I Ching) Hexagram 44 "Gou" (Coming Upon) states: "There is wind in the sky, Gou; later, it issues commands to the four directions." The upper trigram Qian represents Heaven, and the lower trigram Xun represents Wind. Wind spreads across the world, penetrating everywhere, symbolizing an unexpected encounter. However, this "meeting" is not all joy— the hexagram clearly states: "A young woman, do not take her," implying that those who
View Original
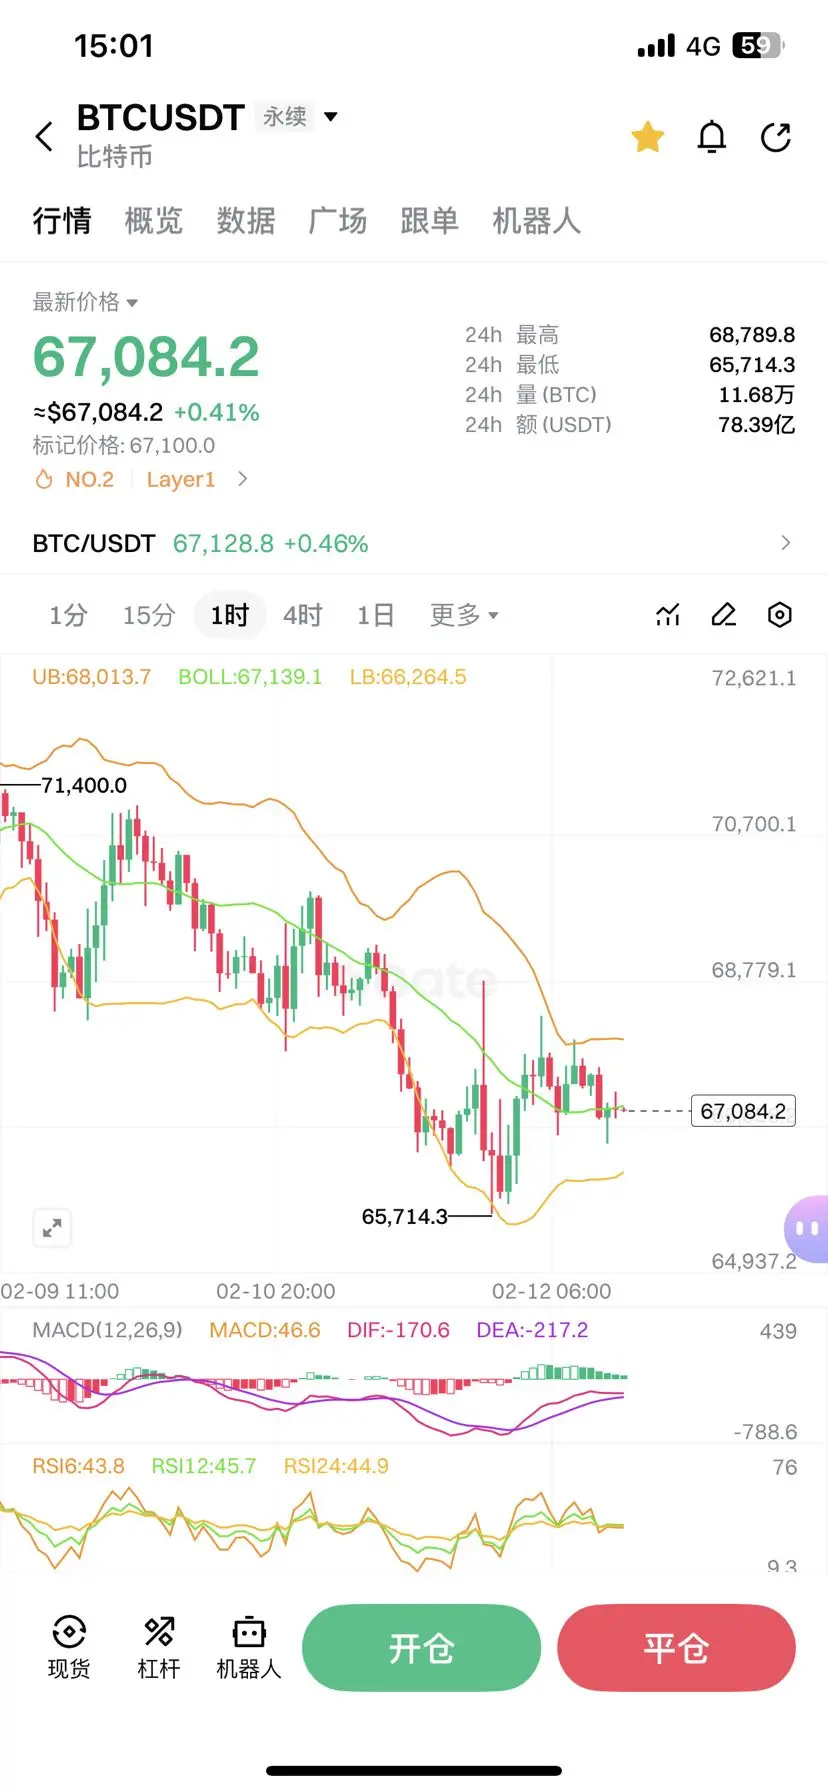
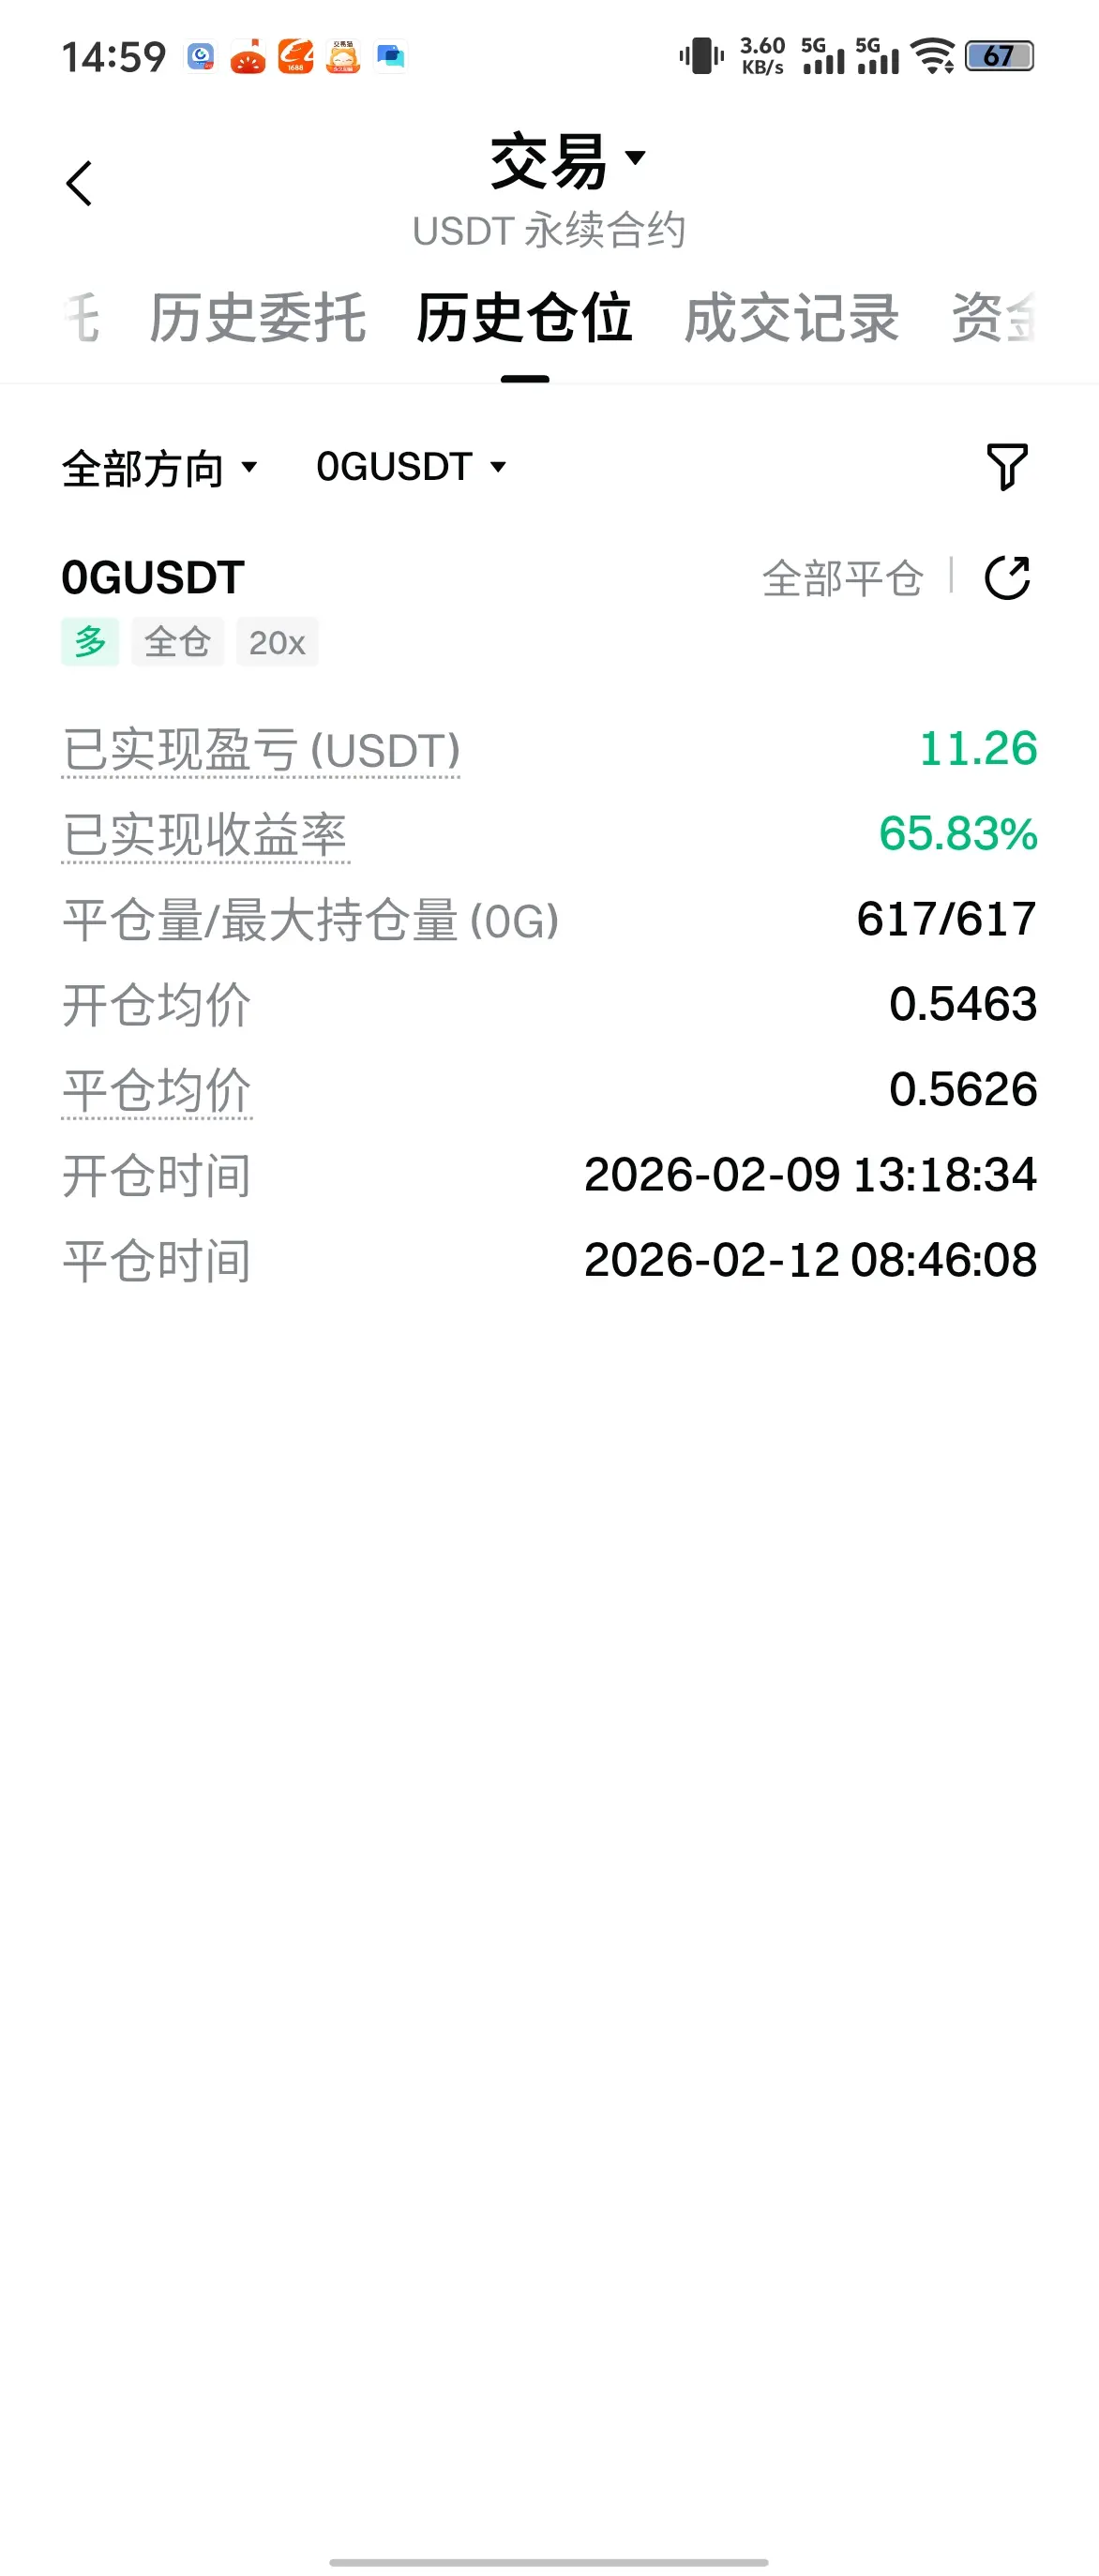
[The user has shared his/her trading data. Go to the App to view more.]
- Reward
- 1
- Comment
- Repost
- Share
骋骋
骋骋
Created By@ChainStrategyStudyGroup-
Listing Progress
0.00%
MC:
$2.42K
More Tokens
In a bear market, all the news-based rebounds are just paper tigers.
Woke up to the sky falling again, BlackRock is also here to scam, this circle is completely rotten.
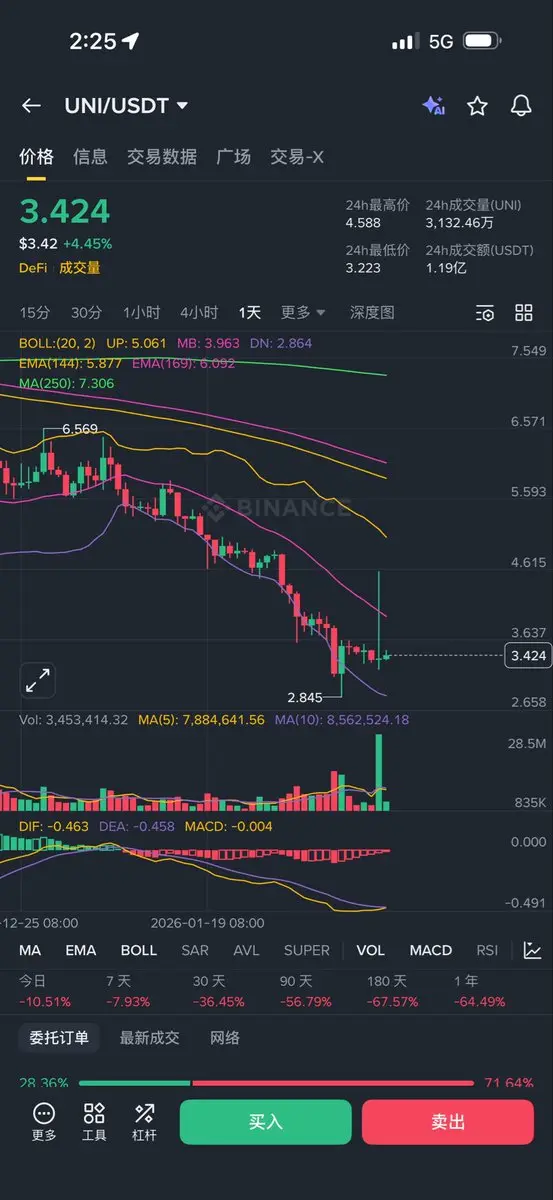
To trade successfully, you need to learn to sell the news. Yesterday, BlackRock announced a 40% increase in purchases of UNI.
Today, UNI's gains have already been wiped out, leaving only a long lightning rod. The liquidity in the bear market is still too poor.
Chasing after news usually results in being buried. Every piece of good news in a bear market is premeditated harvest.
Are you okay if you bought $uni yesterda
View OriginalWoke up to the sky falling again, BlackRock is also here to scam, this circle is completely rotten.
To trade successfully, you need to learn to sell the news. Yesterday, BlackRock announced a 40% increase in purchases of UNI.
Today, UNI's gains have already been wiped out, leaving only a long lightning rod. The liquidity in the bear market is still too poor.
Chasing after news usually results in being buried. Every piece of good news in a bear market is premeditated harvest.
Are you okay if you bought $uni yesterda

- Reward
- like
- Comment
- Repost
- Share
#AIBT Those with coins, please hold on tight and stay steady while waiting for AIBT to take off.
View Original


- Reward
- like
- Comment
- Repost
- Share
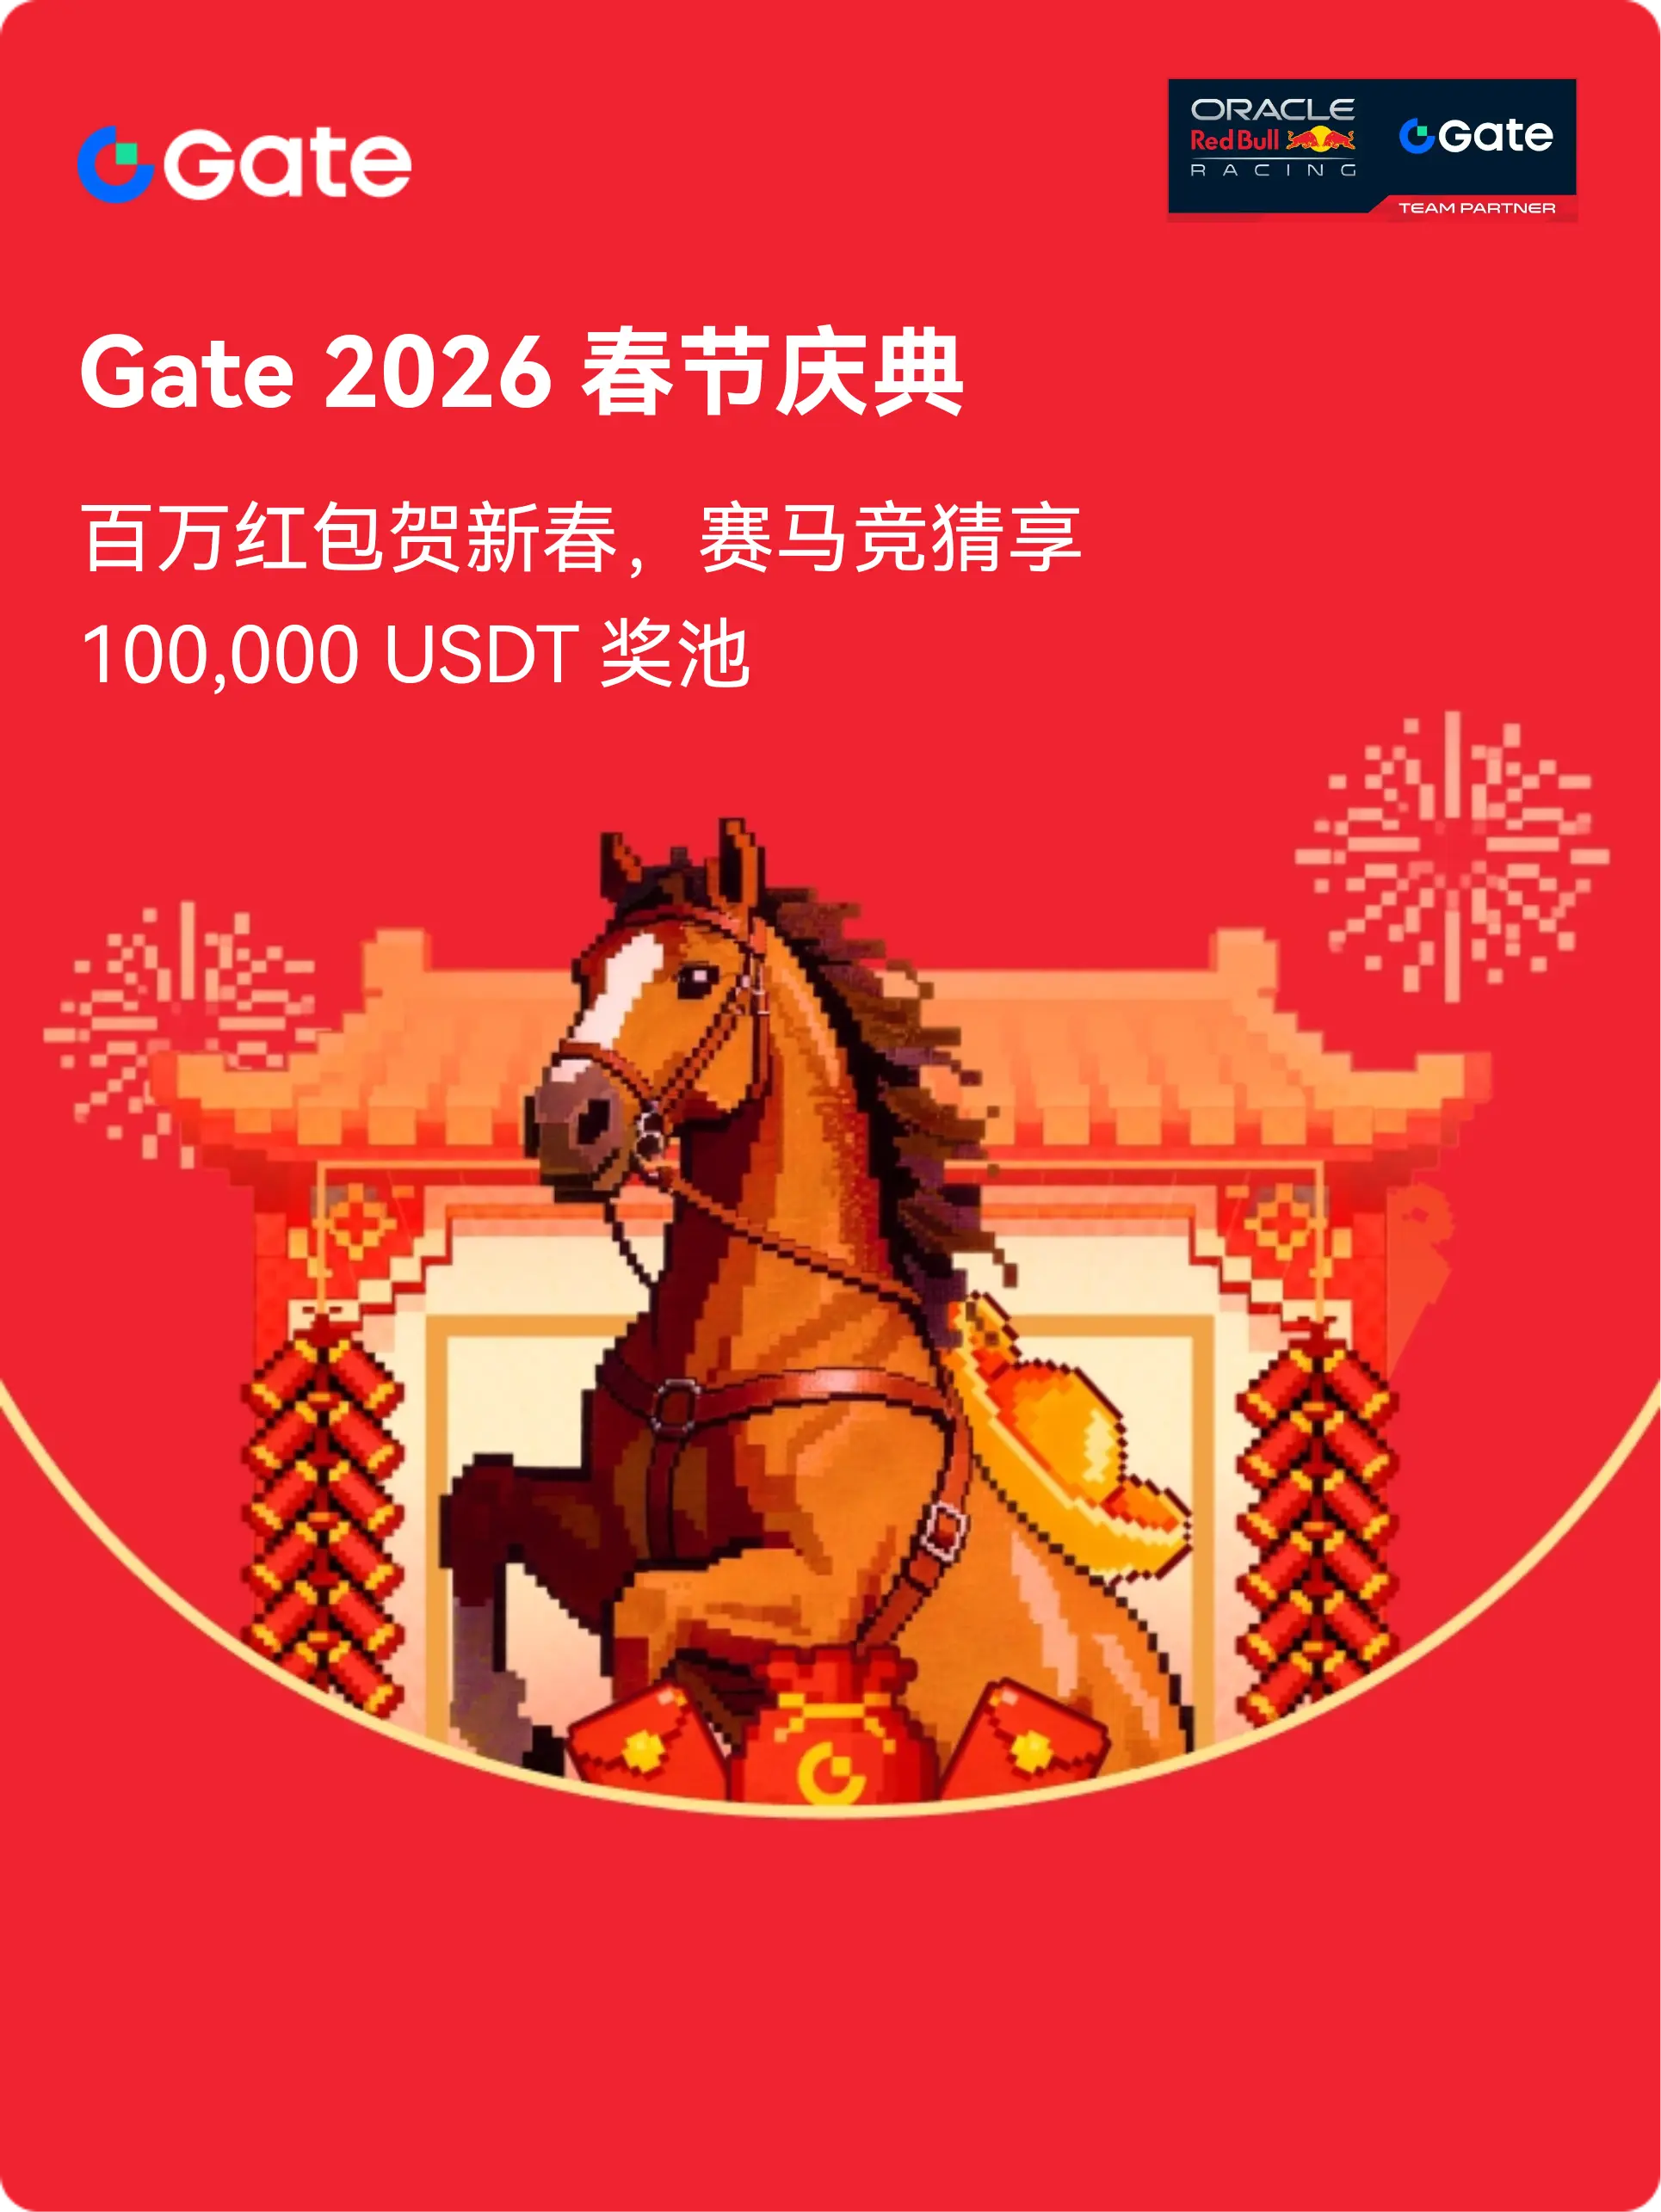
Participate in horse racing betting, complete tasks to earn horse racing tickets, and enjoy a million red envelope rain daily, sharing a prize pool of 100,000 USDT at the Gate 2026 Spring Festival Celebration. https://www.gate.com/competition/year-of-horse-2026?ref_type=165&utm_cmp=7EQB9Jba&ref=VLRBAW9BBW
View Original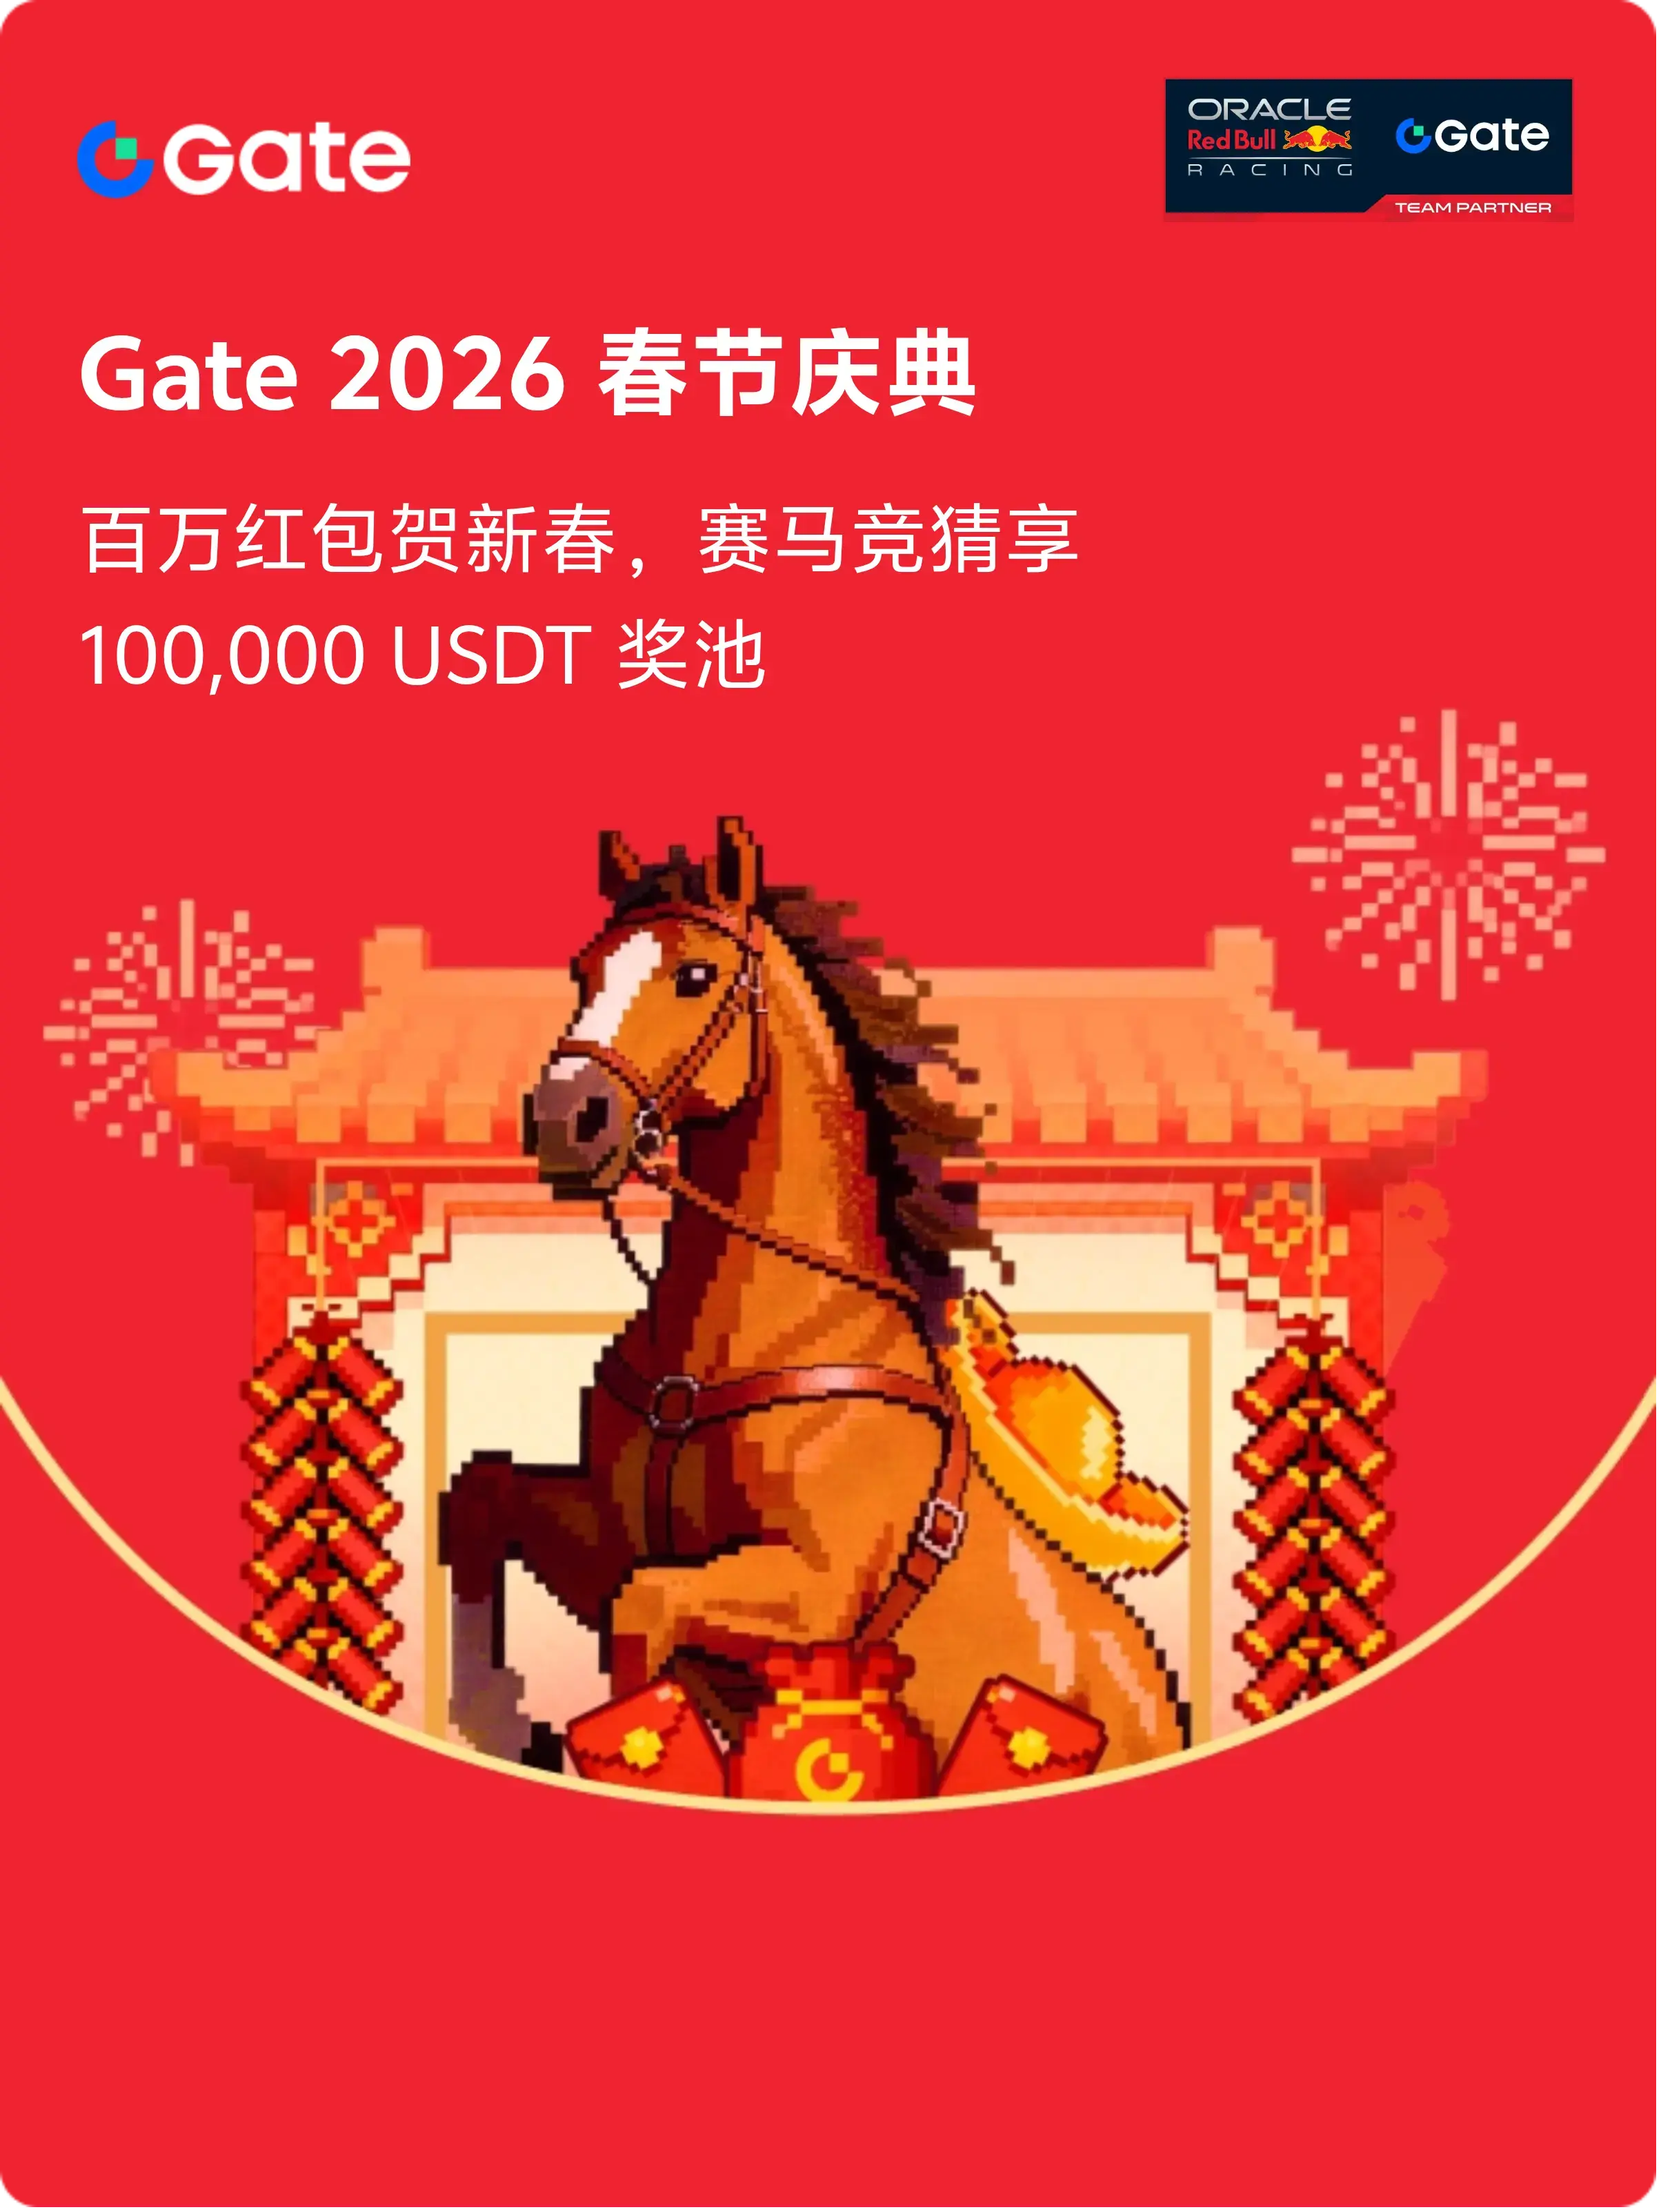
- Reward
- like
- Comment
- Repost
- Share
#Gate广场发帖领五万美金红包
Participate in horse racing betting, complete tasks to earn horse racing tickets, and enjoy a million red envelope rain daily, sharing a prize pool of 100,000 USDT at the Gate 2026 Spring Festival Celebration. https://www.gate.com/competition/year-of-horse-2026?ref_type=165&utm_cmp=7EQB9Jba&ref=VVHGAFFYVA
View OriginalParticipate in horse racing betting, complete tasks to earn horse racing tickets, and enjoy a million red envelope rain daily, sharing a prize pool of 100,000 USDT at the Gate 2026 Spring Festival Celebration. https://www.gate.com/competition/year-of-horse-2026?ref_type=165&utm_cmp=7EQB9Jba&ref=VVHGAFFYVA
- Reward
- like
- Comment
- Repost
- Share
- Reward
- 1
- 3
- Repost
- Share
DriedConfusion :
:
Sold out at noon too, sold at 7.177View More
We never really saw a bull market in #BTC barely a decompression from 2022 dump
Alts were always losing wrt to #BTC
Alts were always losing wrt to #BTC
- Reward
- like
- Comment
- Repost
- Share
- Reward
- like
- Comment
- Repost
- Share
Market structure:Short-term consolidation continues without confirmed breakout
167
- Reward
- like
- Comment
- Repost
- Share
Gm and happy Thursday ☕️
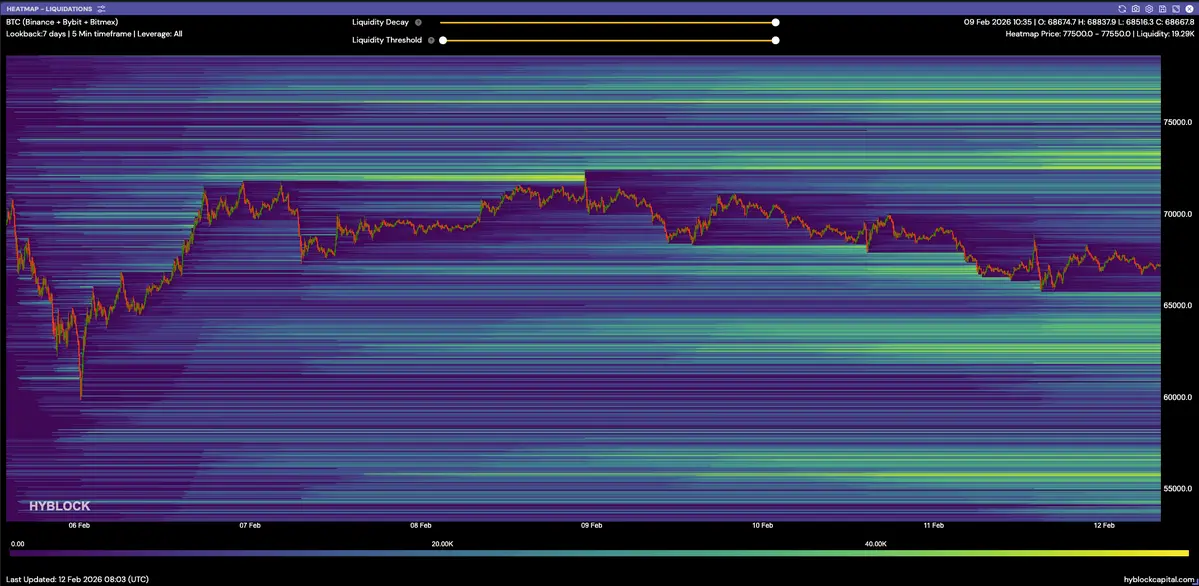
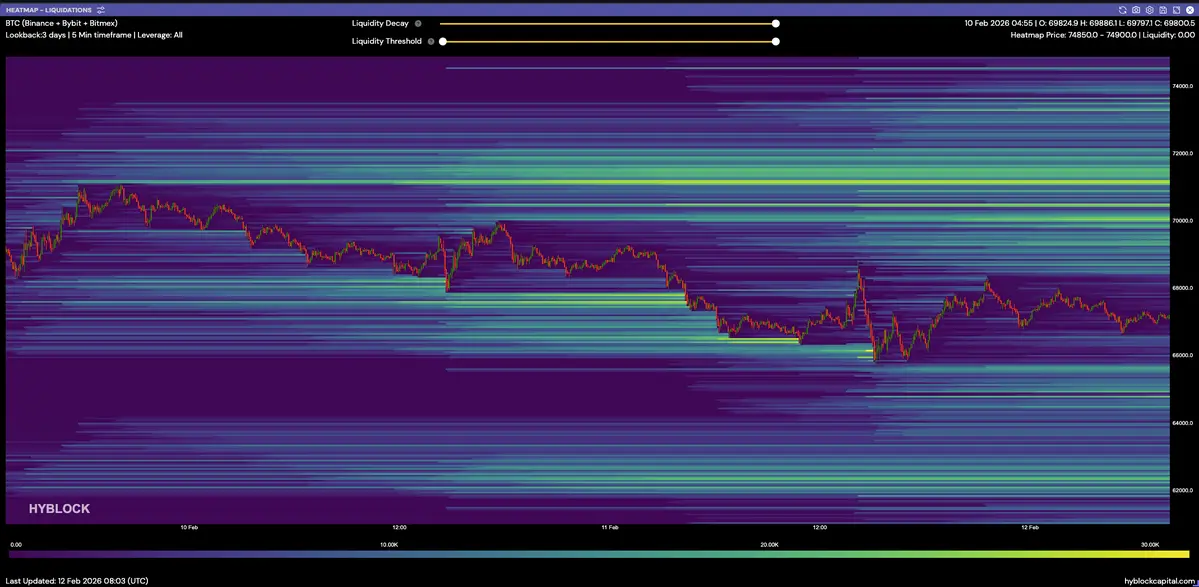
$BTC Update & Hyblock Heatmaps
Bitcoin is slowly trending down and no longer in a compression below resistance.
This is post-distribution phase, and the market is deciding whether this zone becomes a base or a pause before continuation.
From here:
Stabilization and consolidation at this level would be a first sign of strength.
Failure to hold opens the door to a deeper sweep into the next lower liquidity pools.
Have a great day and see you soon!
- Reward
- like
- Comment
- Repost
- Share
cgod
陈神之路
Created By@GateUser-8953e191
Listing Progress
0.00%
MC:
$2.41K
More Tokens
GM chat <3
Woke up to a ton of DMs about the Xeet cards, let me wake up first and we’ll sort it out.
Didn’t expect this much interest.
I’ll prioritise friends and people I’ve built real connections with, then we’ll form a solid squad.
Woke up to a ton of DMs about the Xeet cards, let me wake up first and we’ll sort it out.
Didn’t expect this much interest.
I’ll prioritise friends and people I’ve built real connections with, then we’ll form a solid squad.

- Reward
- like
- Comment
- Repost
- Share
Most founders hide their burn rate until they're 60 days from zero.
Then they panic raise at whatever terms they can get..
The uncomfortable truth: if you can't explain where every dollar went last quarter, you're not ready to ask for more.
Transparency isn't optional there.
Lesson in that for many.
Then they panic raise at whatever terms they can get..
The uncomfortable truth: if you can't explain where every dollar went last quarter, you're not ready to ask for more.
Transparency isn't optional there.
Lesson in that for many.
- Reward
- like
- Comment
- Repost
- Share
Join the horse racing predictions, complete tasks to earn horse racing tickets, enjoy daily million Gift Coins giveaways, and share a 100,000 USDT prize pool—all at the Gate 2026 Spring Festival Celebration. https://www.gate.com/competition/year-of-horse-2026?ref_type=165&utm_cmp=7EQB9Jba&ref=XgNAUVAK

- Reward
- like
- Comment
- Repost
- Share
BTC Micro Trend Analysis on Lower Timeframes
0
- Reward
- like
- Comment
- Repost
- Share
Participate in horse racing betting, complete tasks to earn horse racing tickets, and enjoy a million red envelope rain daily, sharing a prize pool of 100,000 USDT at the Gate 2026 Spring Festival Celebration. https://www.gate.com/competition/year-of-horse-2026?ref_type=165&utm_cmp=7EQB9Jba&ref=AGDBU19C
View Original
- Reward
- like
- Comment
- Repost
- Share
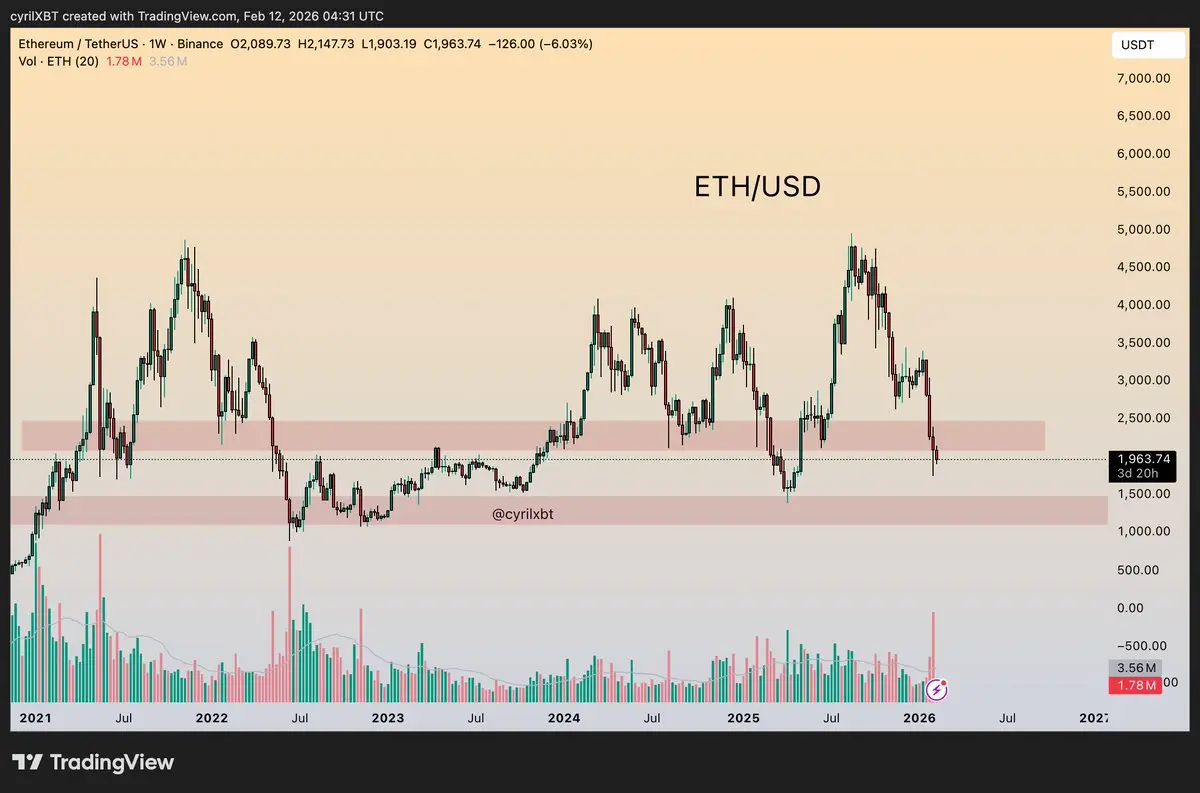
On February 12, according to Lookonchain monitoring, trader 0xC6F5 closed his ETH long position 9 hours ago, incurring a loss of $547,000.
However, just 2 hours ago, he opened a new long position with 9,366 ETH (worth $18.44 million) at 25x leverage. #Gate广场发帖领五万美金红包
However, just 2 hours ago, he opened a new long position with 9,366 ETH (worth $18.44 million) at 25x leverage. #Gate广场发帖领五万美金红包
ETH0,48%


- Reward
- 1
- 1
- Repost
- Share
DragonSoars :
:
111111111111111111111111111111$UNI / USDT –
This chart is defined by a single event: a sharp liquidity expansion from the 3.22 base into 4.57, followed by immediate rejection. That vertical candle is not trend continuation it’s liquidity being taken above a thin range.
After the spike, price sold off aggressively and has now compressed back around 3.40–3.45. That tells you two things:
first, late buyers at the highs are trapped; second, price is back inside the prior value area.
Structure on the 1H is neutral to weak. The impulse high at 4.57 stands as clear buy-side liquidity already cleared. Since then, we’ve seen lower
UNI3,19%
- Reward
- like
- Comment
- Repost
- Share
Load More
Join 40M users in our growing community
⚡️ Join 40M users in the crypto craze discussion
💬 Engage with your favorite top creators
👍 See what interests you
Trending Topics
View More6.05K Popularity
2.89K Popularity
1.41K Popularity
32.25K Popularity
246.69K Popularity
News
View MoreEspresso(ESP) will launch spot trading in the Gate Layer1 zone on February 12, with pre-market contracts synchronized and converted to standard perpetual contracts.
9 m
XRP Community Day ignites market expectations. With ETF funds backing, can the price break through $1.50?
10 m
Gate Launchpool Episode 360 is now live with Aztec(AZTEC). Stake BTC, USDT, or AZTEC to share airdrops of 2,587,500 AZTEC.
10 m
Gate founder Dr. Han delivers a speech at Consensus HK, exploring the evolution of Web3 driven by intelligence
20 m
Ju.com launches multi-currency 30-day fixed-term financial products, with an annualized rate of up to 15%
21 m
Pin