云澈趋势论
vip
Market Analyst
Futures Trading Strategist
On-chain Analyst
No content yet
Currently, although BTC has experienced a pullback, the rapid stabilization above the key support zone still demonstrates the resilience of the medium-term upward trend. In the afternoon, the price found strong buying support and rebounded in the 86500-86000 area (coinciding with the daily MA30 and the previous breakout platform), indicating solid bullish defense in this region. As long as this core support band is not broken with increased volume, the overall structure remains within a healthy trend consolidation.
From a technical indicator perspective, short-term bearish momentum shows signs
BTC-1.81%
View Original
post-image
  • Reward
  • Comment
  • Repost
  • Share
From a technical perspective, Ethereum successfully stabilized around $2,880 and then strongly broke through the recent consolidation range, currently standing above $2,955. The hourly chart shows the price moving along the upper band of the Bollinger Bands, with the MACD forming a golden cross above the zero line, and volume gradually increasing, indicating strong short-term buying momentum. If it can hold above $2,950, the next target will be the psychological levels of $2,980-$3,000.
The market structure shows positive signals, with the 4-hour chart forming a bullish "Morning Star" pattern,
ETH-4.33%
View Original
post-image
  • Reward
  • 2
  • Repost
  • Share
GateUser-3295427evip:
It's just a rebound. How strong can it be?
View More
From a technical perspective, after Bitcoin received strong buying support near $86,800, it has successfully broken above the $87,700 level. The hourly and 4-hour charts both show a bullish alignment, with MACD crossing upward and trading volume increasing, indicating that short-term rebound momentum is still ongoing. As long as the price remains above $87,500, there is potential for further testing of the resistance zone at $88,300-$88,800 in the short term.
Market sentiment is gradually recovering after the non-farm payroll data disturbance. The USDT premium has rebounded, and the funding ra
BTC-1.81%
View Original
post-image
post-image
  • Reward
  • Comment
  • Repost
  • Share
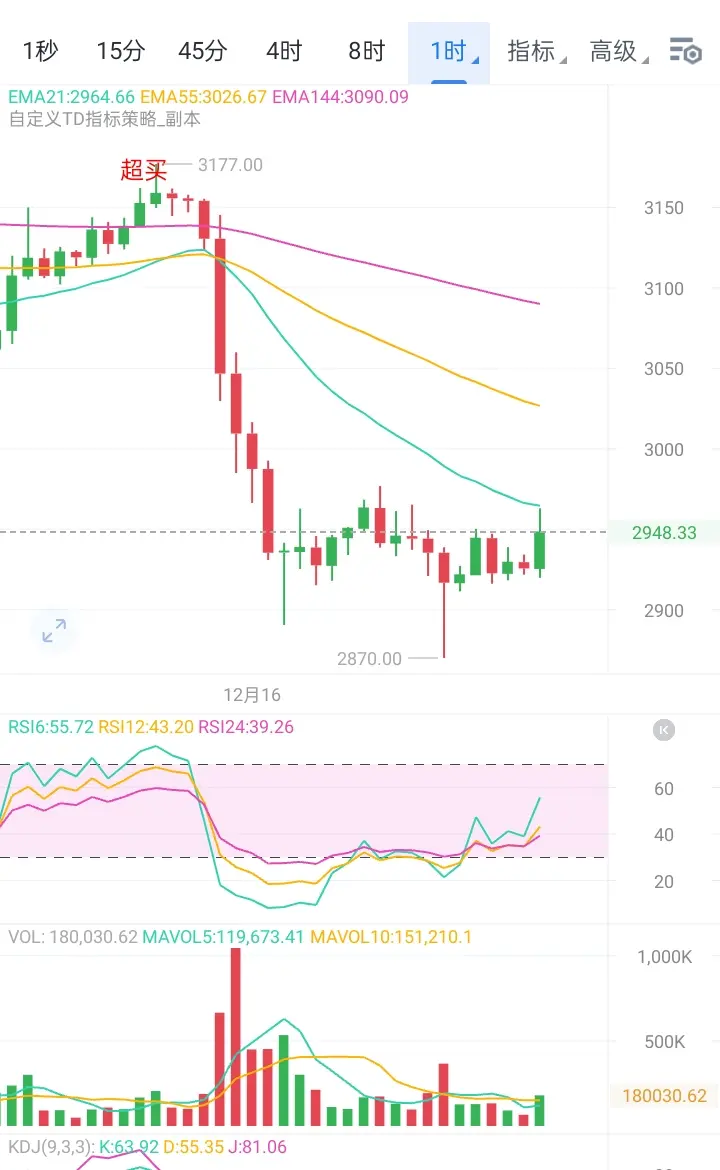
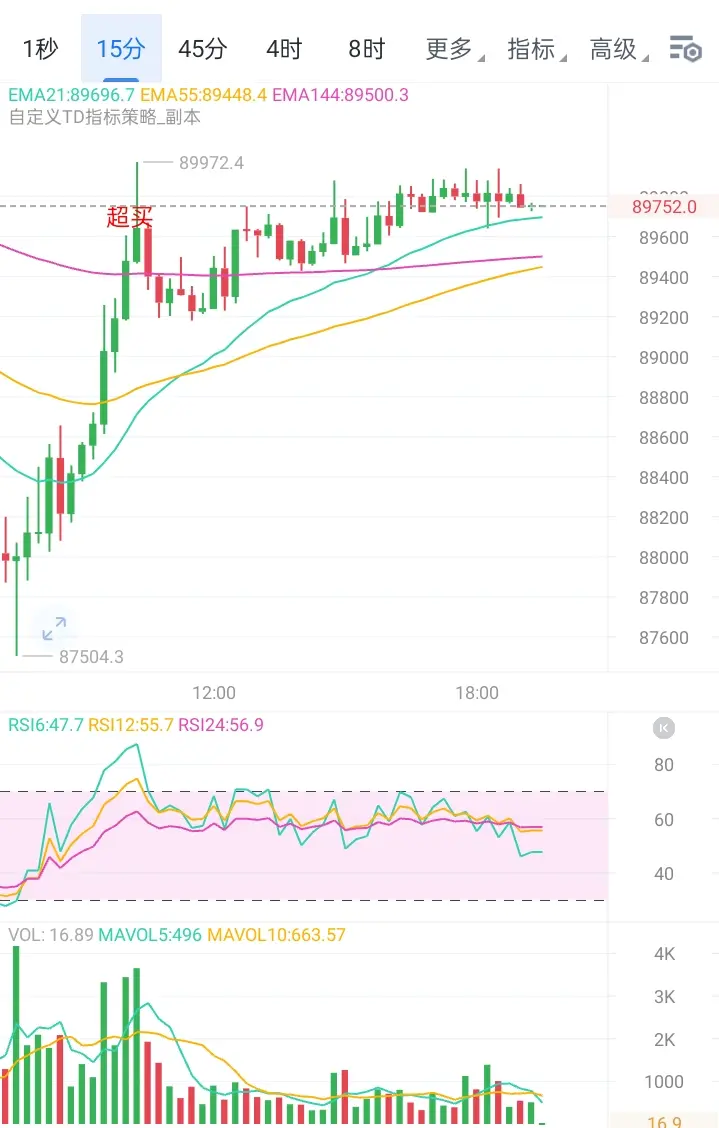
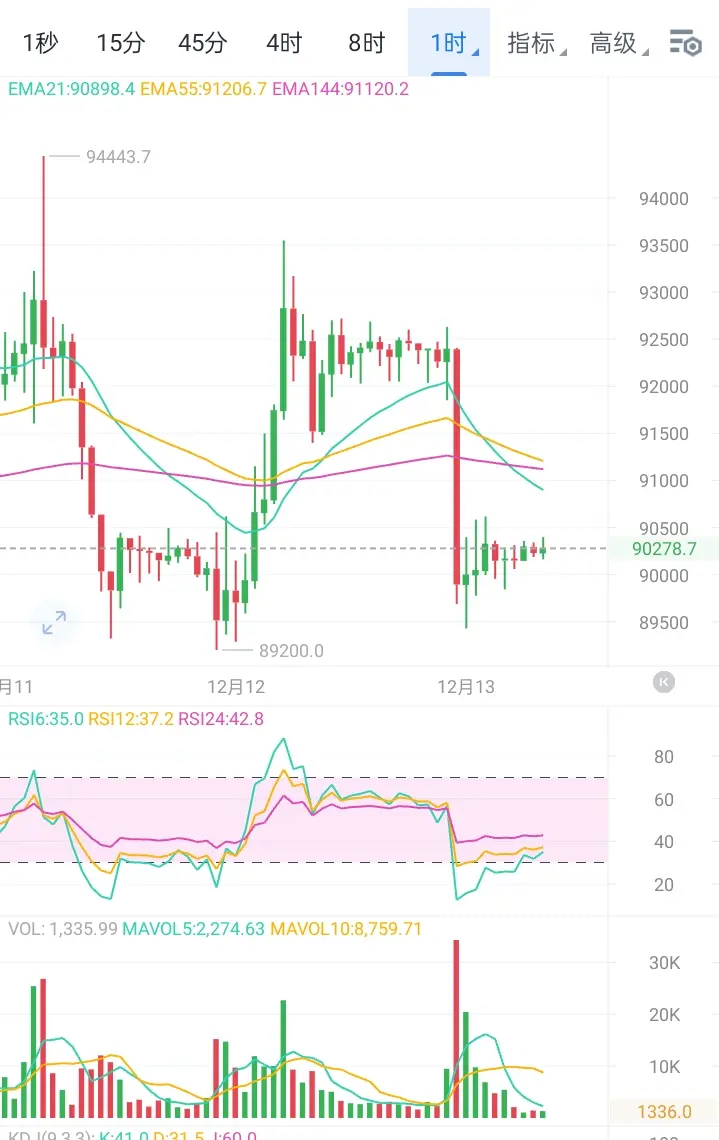
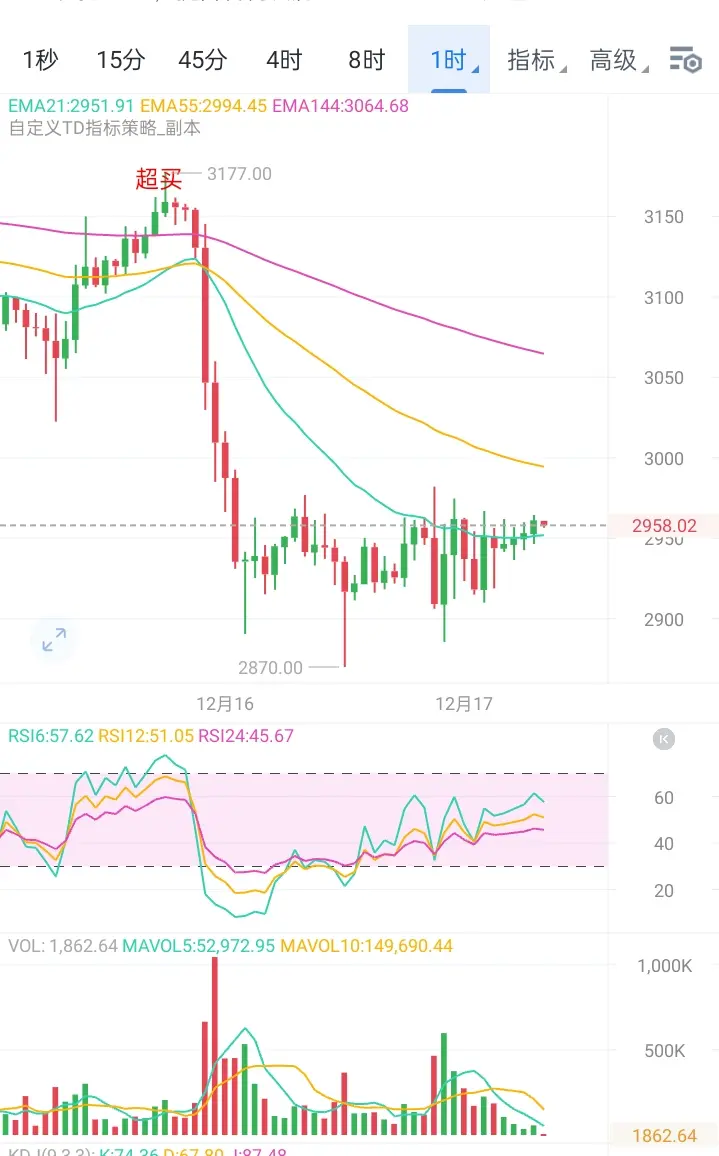
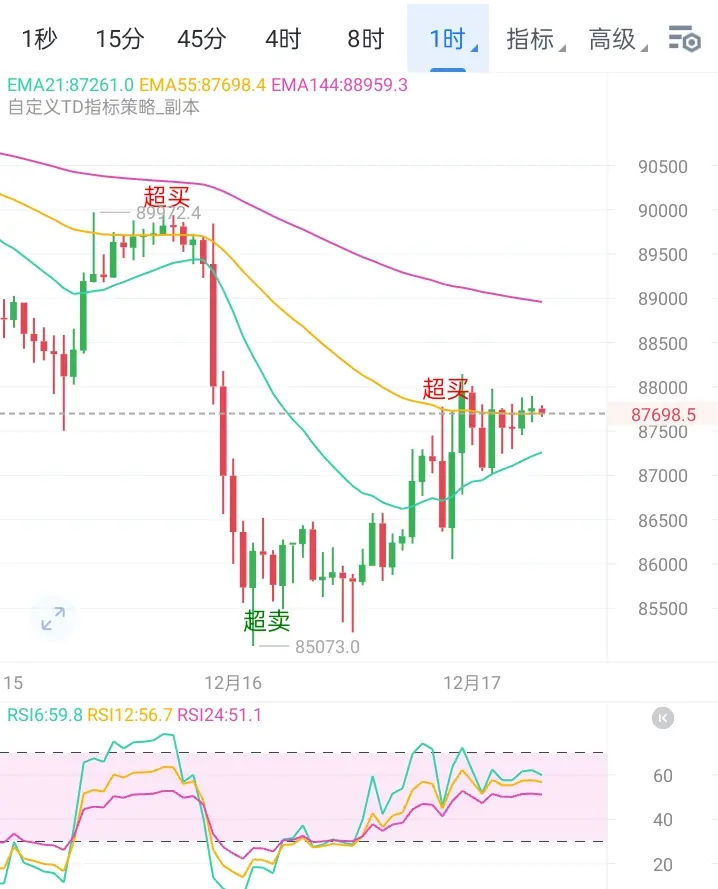
Based on the current market analysis, Bitcoin shows a slight rebound but remains under overall pressure with a volatile pattern. The daily chart has recovered after touching the lower Bollinger Band, but resistance above is evident. The Bollinger Bands' three lines are flattening, indicating weakening trend momentum; the 4-hour chart is still constrained by the middle Bollinger Band, and attention should be paid to the breakout around $89,000. If the price cannot stabilize effectively, it will likely continue to fluctuate within a range in the short term.
From a short-term technical perspectiv
BTC-1.81%
View Original
  • Reward
  • Comment
  • Repost
  • Share
Bitcoin sharply rebounded after dipping to $85,288 in the morning, currently back near $86,400, indicating strong support in this area. The quick V-shaped reversal suggests that the main buying interest remains active, with the hourly MACD showing a green histogram and the price above the short-term moving averages, reflecting a recovery trend.
The current key resistance zone is at 86,800-87,000. A volume-backed breakout would confirm a short-term trend reversal to bullish, with further targets potentially above 87,500. The support zone has shifted to 86,000-86,200. As long as the price remain
BTC-1.81%
View Original
post-image
  • Reward
  • Comment
  • Repost
  • Share
From a technical perspective, Ethereum quickly rebounded from the rapid decline below the 2900 USD round number after dropping sharply, reaching around 2965 USD. The daily chart shows a significant long lower shadow, clearly indicating strong bullish defensive forces in the 2900-2880 region. This level is not only a key platform from the previous upward trend but also a psychological support level. The quick rebound in this area suggests that major market funds have not abandoned the current trend structure.
The steep decline starting from 3150 USD can be viewed as a one-time profit-taking rel
ETH-4.33%
View Original
post-image
  • Reward
  • Comment
  • Repost
  • Share
This rapid decline from the $89,800 level has shown signs of stabilization after reaching support near $86,500. This level is not only an important intra-day support point but also coincides with a support zone formed by multiple previous daily lows, indicating strong bullish defense expectations from a technical perspective. If the price can form a double bottom or a head and shoulders bottom with the right shoulder and is accompanied by reversal signals such as bullish engulfing or long lower shadows on the hourly chart, it could trigger a technical rebound targeting the resistance zone of $
BTC-1.81%
View Original
post-image
post-image
  • Reward
  • Comment
  • Repost
  • Share
Bitcoin prices are stuck before the key resistance level of $90,000, with bullish momentum clearly weakening and showing signs of fatigue. Market sentiment has shifted from an optimistic "buy the dip" to concerns about liquidation risks. Additionally, macroeconomic positives have faded, with short-term core pressure concentrated in the $91,000 to $92,000 range.
If the market weakens, Bitcoin will first test the central support zone of $88,000 to $89,000. Once broken, it could trigger a downward wave, further testing the $85,500 to $87,500 area, and possibly the critical neckline at $85,000.
#F
BTC-1.81%
View Original
post-image
  • Reward
  • Comment
  • Repost
  • Share
Bitcoin sharply rebounded after dipping to $87,500 in the morning, and has now strongly recovered to around $89,700. This dip confirmed the validity of the support below, and the price has formed a clear bullish pattern at a key level, indicating strong buying momentum and a market sentiment of "buying on dips."
$BTC
From a technical perspective, on the 4-hour chart, RSI has turned upward again above the 50 midline, and the MACD momentum histogram shows signs of re-expanding. Coupled with moderate volume increase, it indicates that buying pressure is recovering. The price has stabilized above
BTC-1.81%
View Original
post-image
  • Reward
  • Comment
  • Repost
  • Share
Early morning Bitcoin sharply fell below the key psychological level of $90,000, accelerating downward, with the lowest touching around $87,900. Although there was a slight rebound to near $88,200 afterward, the overall pattern shows a "volume-driven decline and a decrease in volume during the rebound," characteristic of a bearish volume-price relationship. This indicates heavy selling pressure in the market and a clear lack of buying support from bulls.
From a technical perspective, the price has formed a daily-level "lower high and lower low" bearish pattern, and continues to operate below t
BTC-1.81%
View Original
post-image
  • Reward
  • Comment
  • Repost
  • Share
Bitcoin and Ethereum Evening Operation Suggestions and Future Trend Analysis:
As of 12/14, the market is currently in a sideways correction phase. After reaching around 89,700, support held for a rebound. It is now fluctuating near 90,200. Over the weekend, it has been consolidating sideways, and a significant volatility is expected tonight in the early hours. Managing risk is necessary!
On the hourly level, there is considerable resistance. This resistance zone overlaps with multi-cycle resistance areas on the 2-hour and 4-hour charts. A breakout would require strong buying support. Support b
GT-2.01%
View Original
post-image
  • Reward
  • Comment
  • Repost
  • Share
From a technical perspective, the rapid decline in the early morning can be viewed as a concentrated test of the key support zone after the breakout. Bitcoin dipped from 92600 to 89500, just retesting the previously broken daily neckline level and the lower boundary of the channel, while Ethereum also touched the trend support band near 3040. This volume-expanding pullback not only digest the short-term overbought pressure but also forms a lower shadow at a critical level, laying a solid foundation for subsequent upward movement.
In terms of trend structure, the weekly upward pattern remains i
BTC-1.81%
View Original
post-image
  • Reward
  • Comment
  • Repost
  • Share
Based on the current market situation, Bitcoin has established a solid support at the lower boundary of the 92,000 range. Although the afternoon trading showed narrow fluctuations, it overall stabilized above the key defense level of 91,800, indicating that the bulls are actively defending the market in the ongoing battle between bulls and bears. Currently, the price is trading around 92,300, positioned slightly above the midpoint of the range. Short-term moving averages are gradually flattening and converging, trading volume is mildly shrinking during consolidation, which is a healthy technic
BTC-1.81%
View Original
post-image
  • Reward
  • Comment
  • Repost
  • Share
From the current market situation, Bitcoin has experienced a waterfall decline in the morning and the overall trend has shifted to a clear bearish pattern. The price's rebound has consistently been held back by the 90,000 USD level, and it has formed a narrow trading range below this level, indicating weak bullish momentum and a severe lack of market buying confidence. The slight pullback after the US stock market opened last night further confirms the exhaustion of the rebound momentum. The current price hovers around 89,700, with the focus gradually shifting downward.
Technically, the 1-hour
BTC-1.81%
View Original
post-image
  • Reward
  • Comment
  • Repost
  • Share
  • Trending TopicsView More
  • Pin
Trade Crypto Anywhere Anytime
qrCode
Scan to download Gate App
Community
  • 简体中文
  • English
  • Tiếng Việt
  • 繁體中文
  • Español
  • Русский
  • Français (Afrique)
  • Português (Portugal)
  • Bahasa Indonesia
  • 日本語
  • بالعربية
  • Українська
  • Português (Brasil)