别当我財
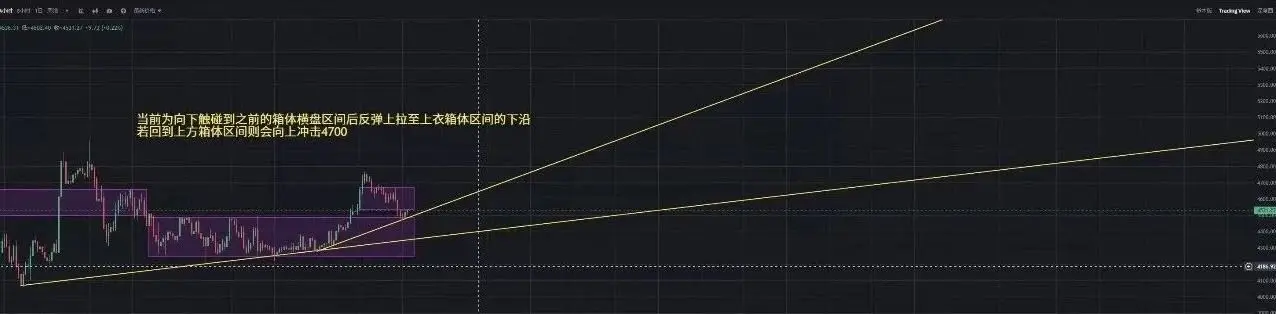
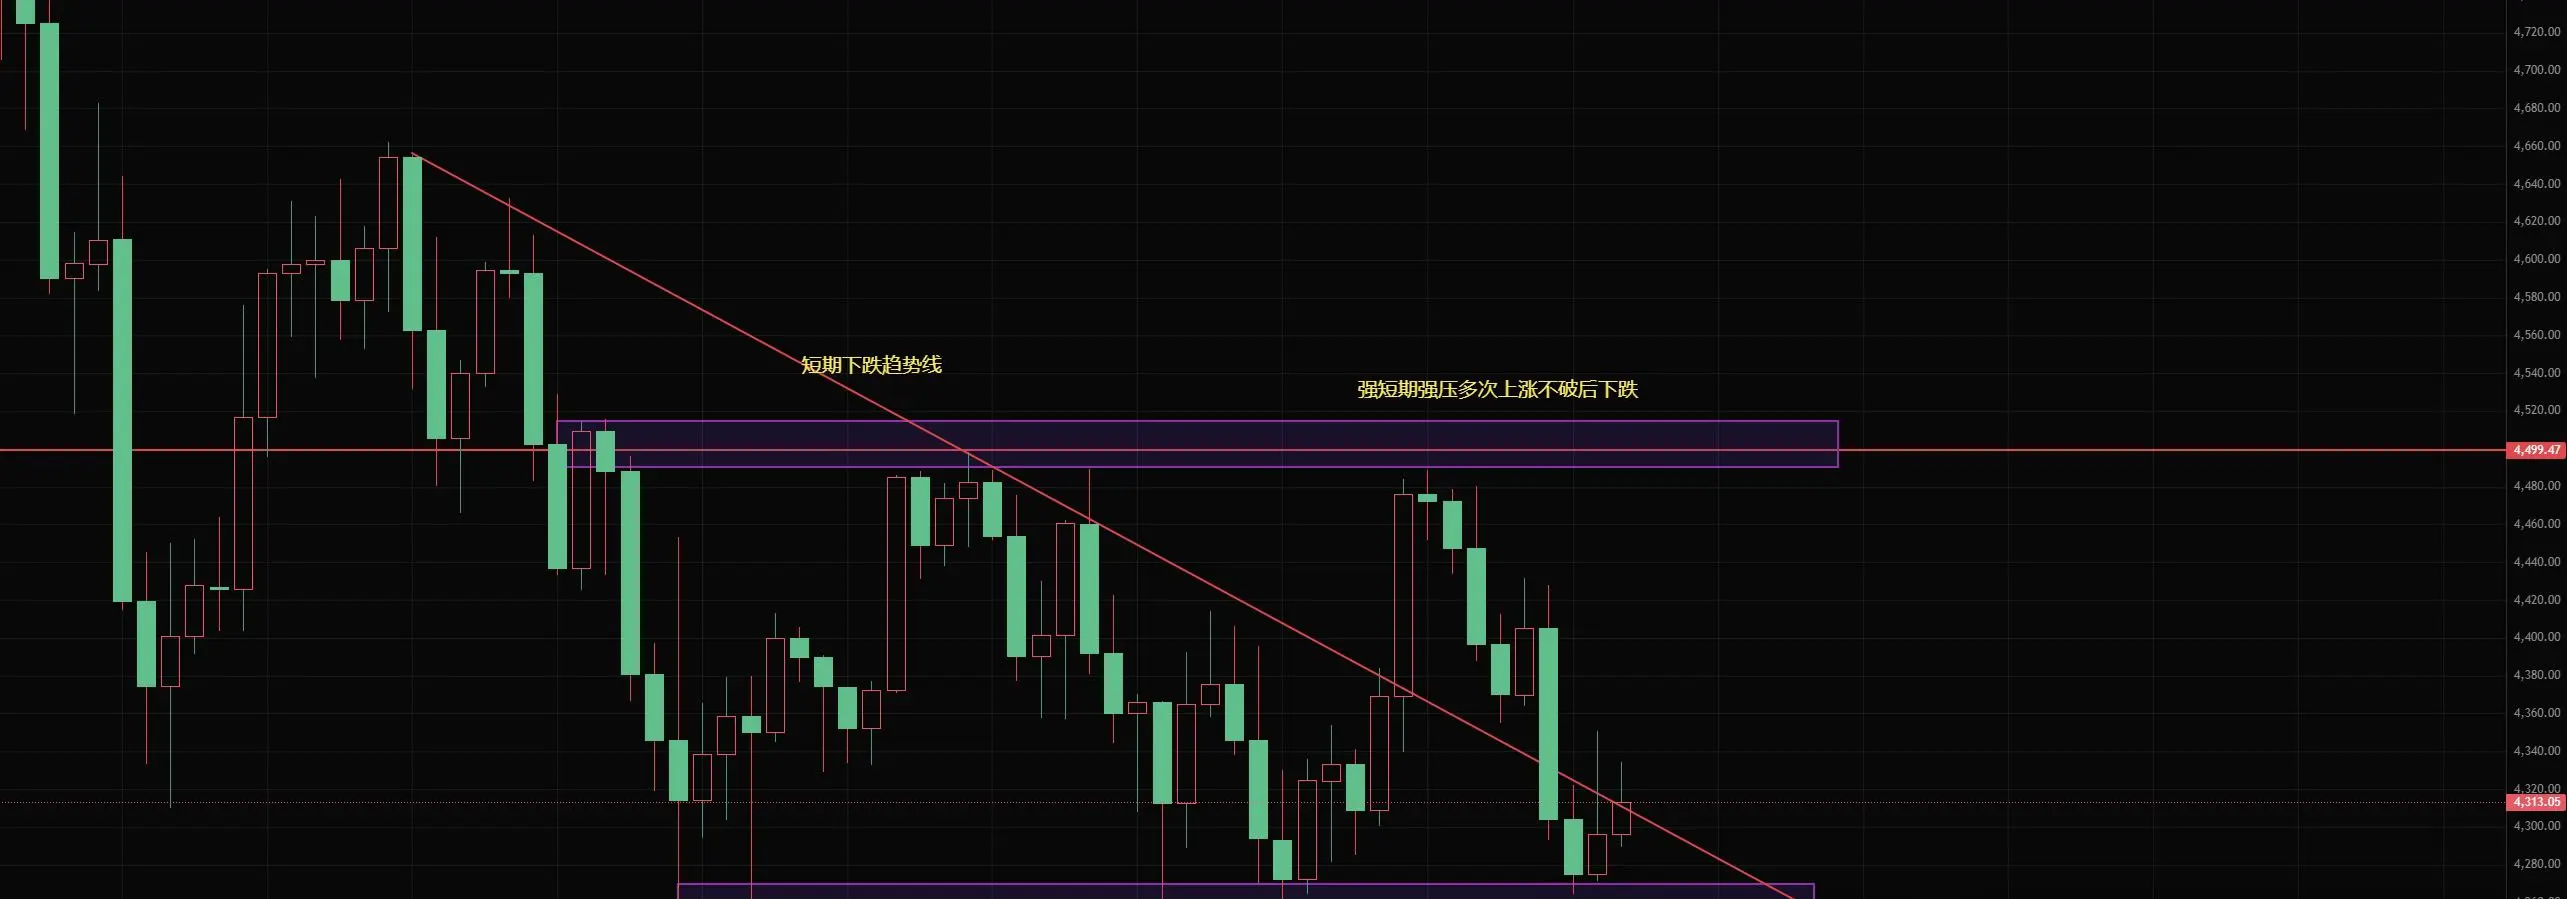
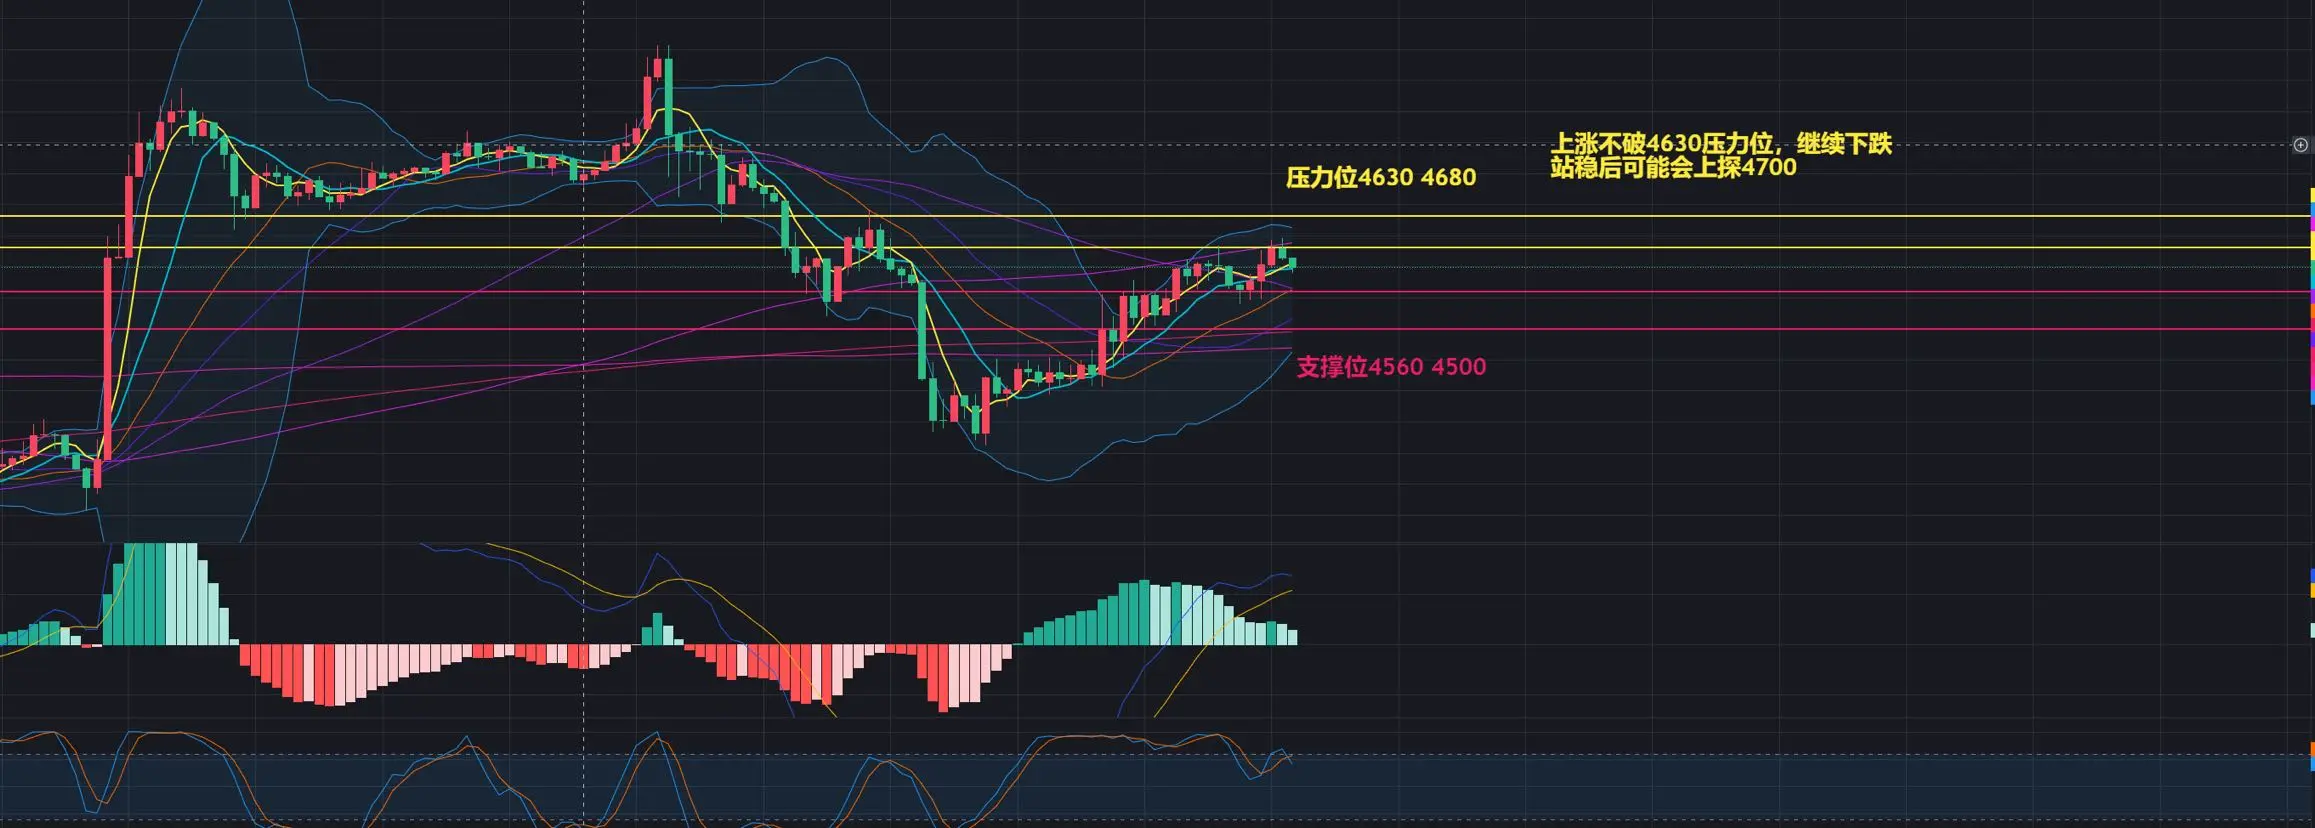
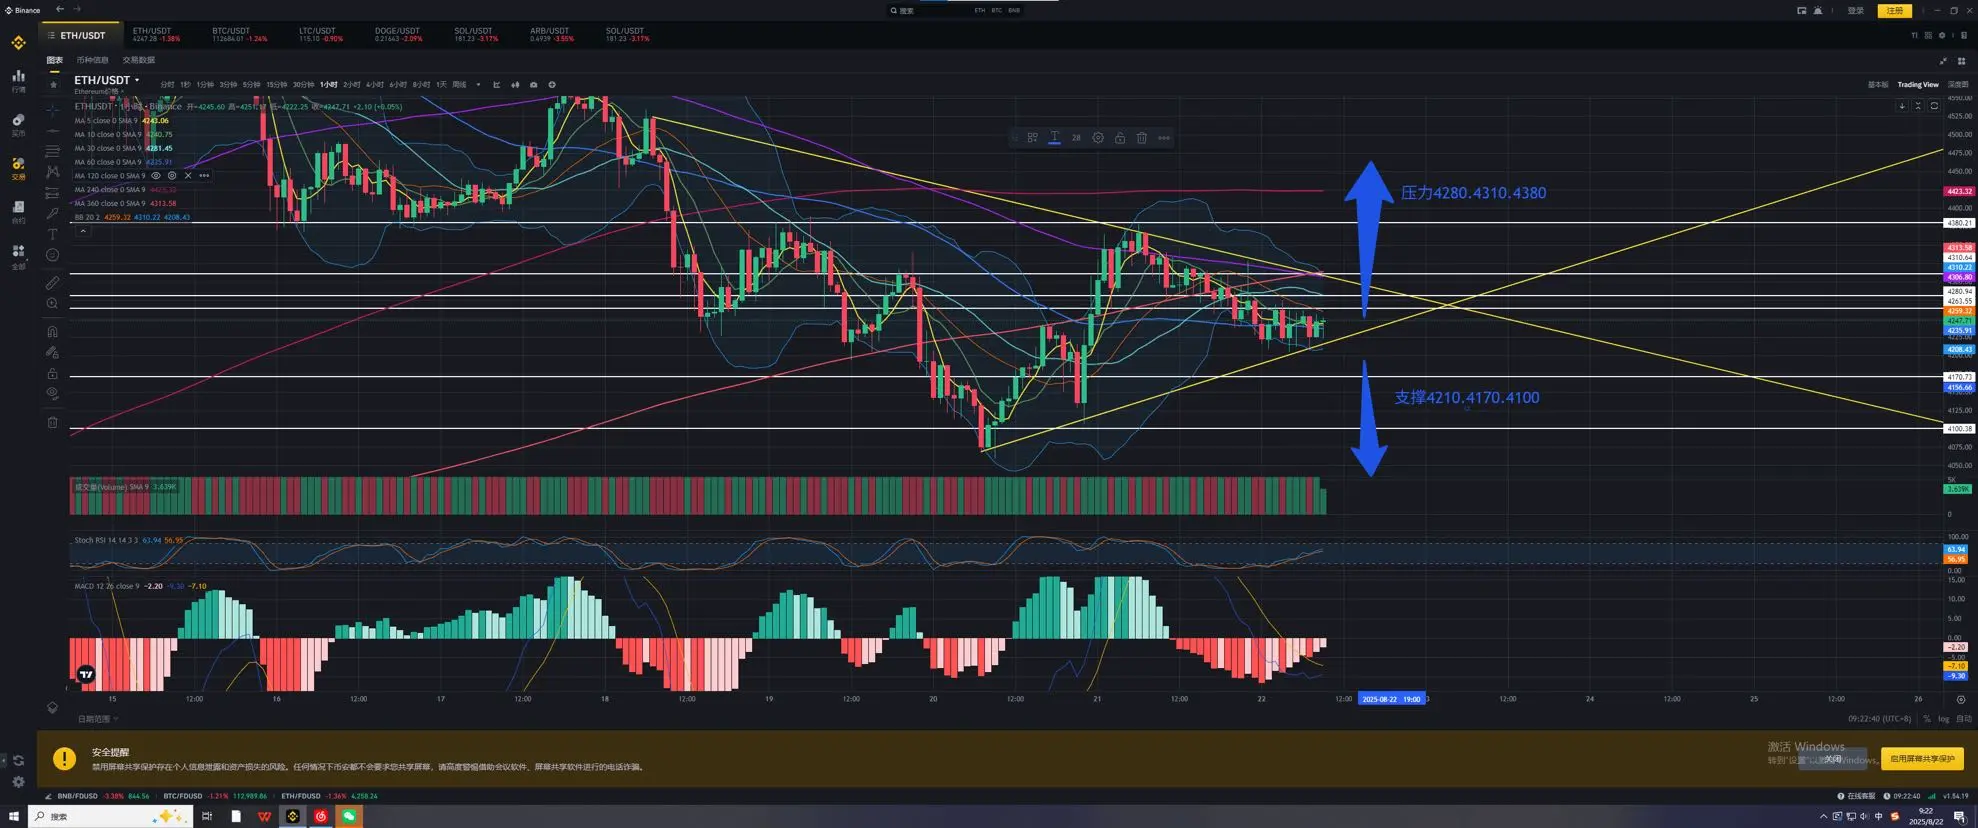
The current 4-hour chart is in the pullback phase after a pump. If it does not hold above during the fall, the 4-hour ma5 will continue to fall. The Bollinger Bands are opening up, with the upper band moving up, the middle band moving down, and the lower band moving down.
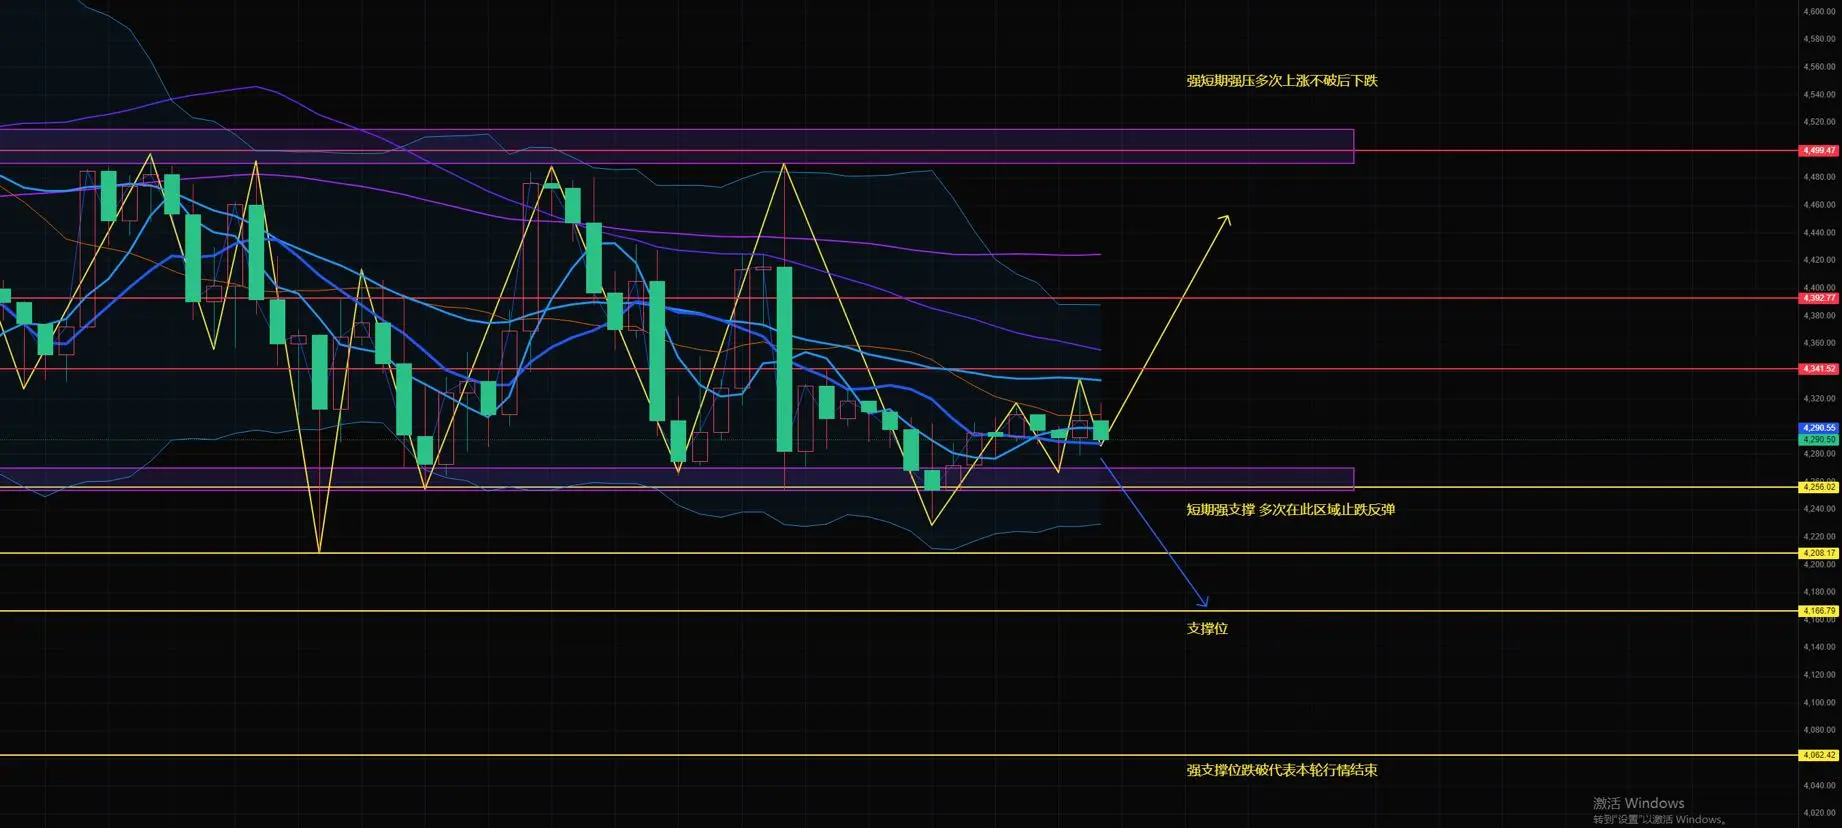
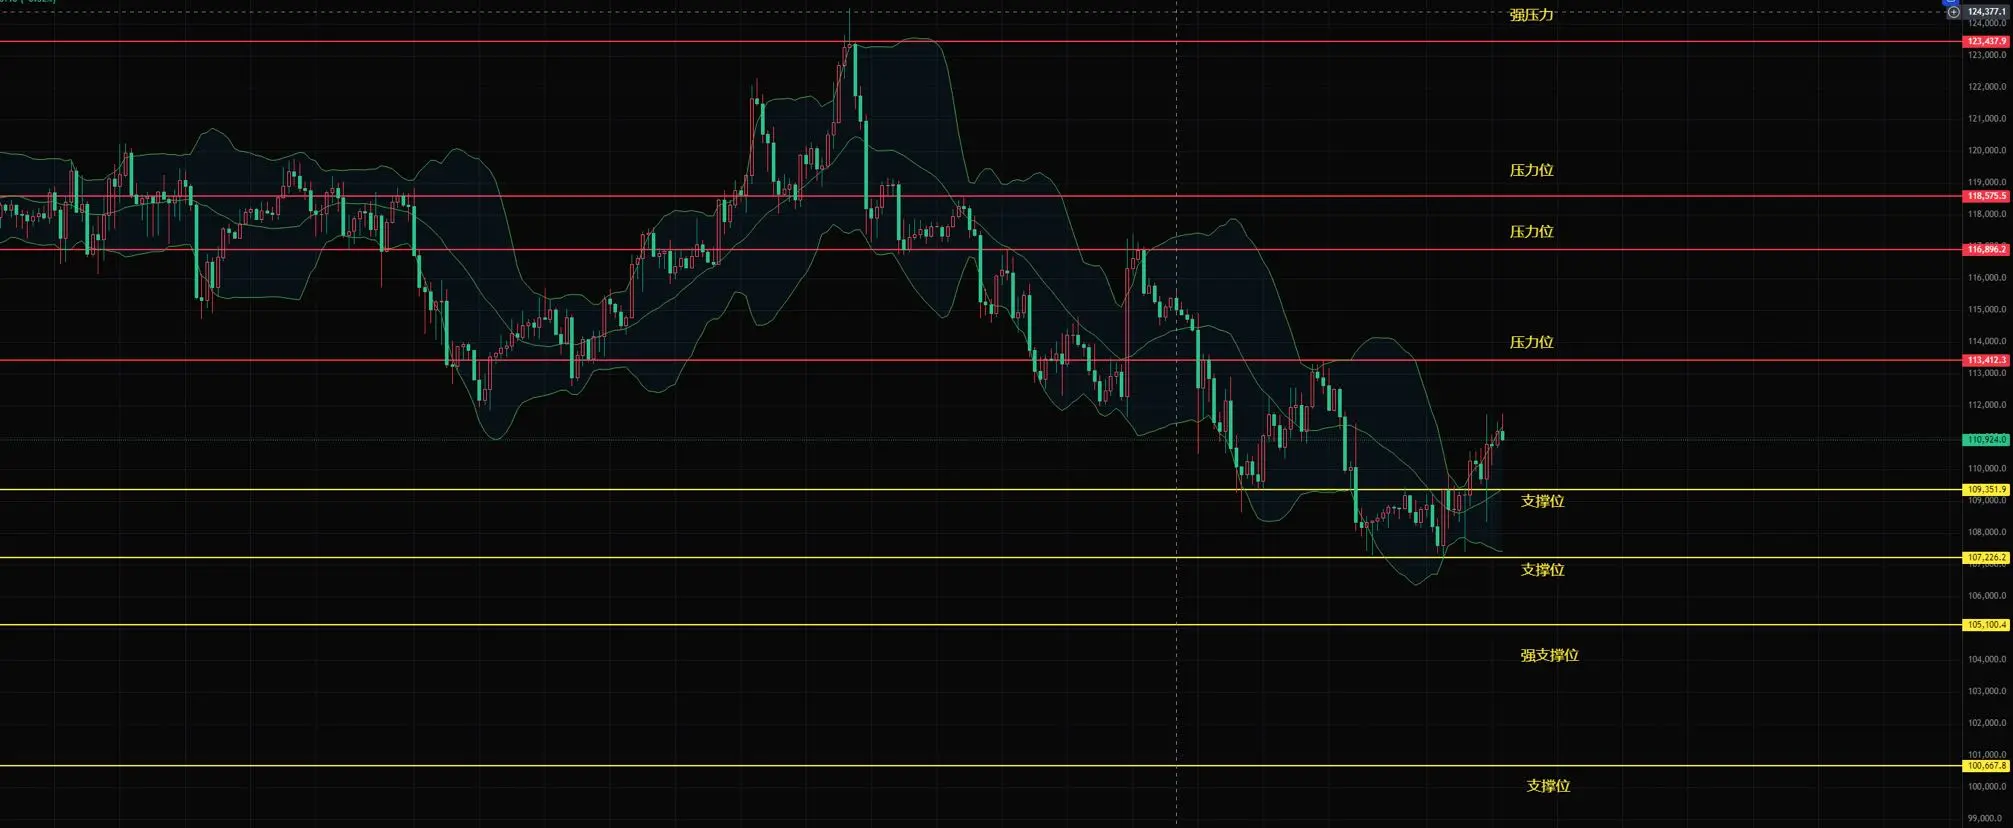
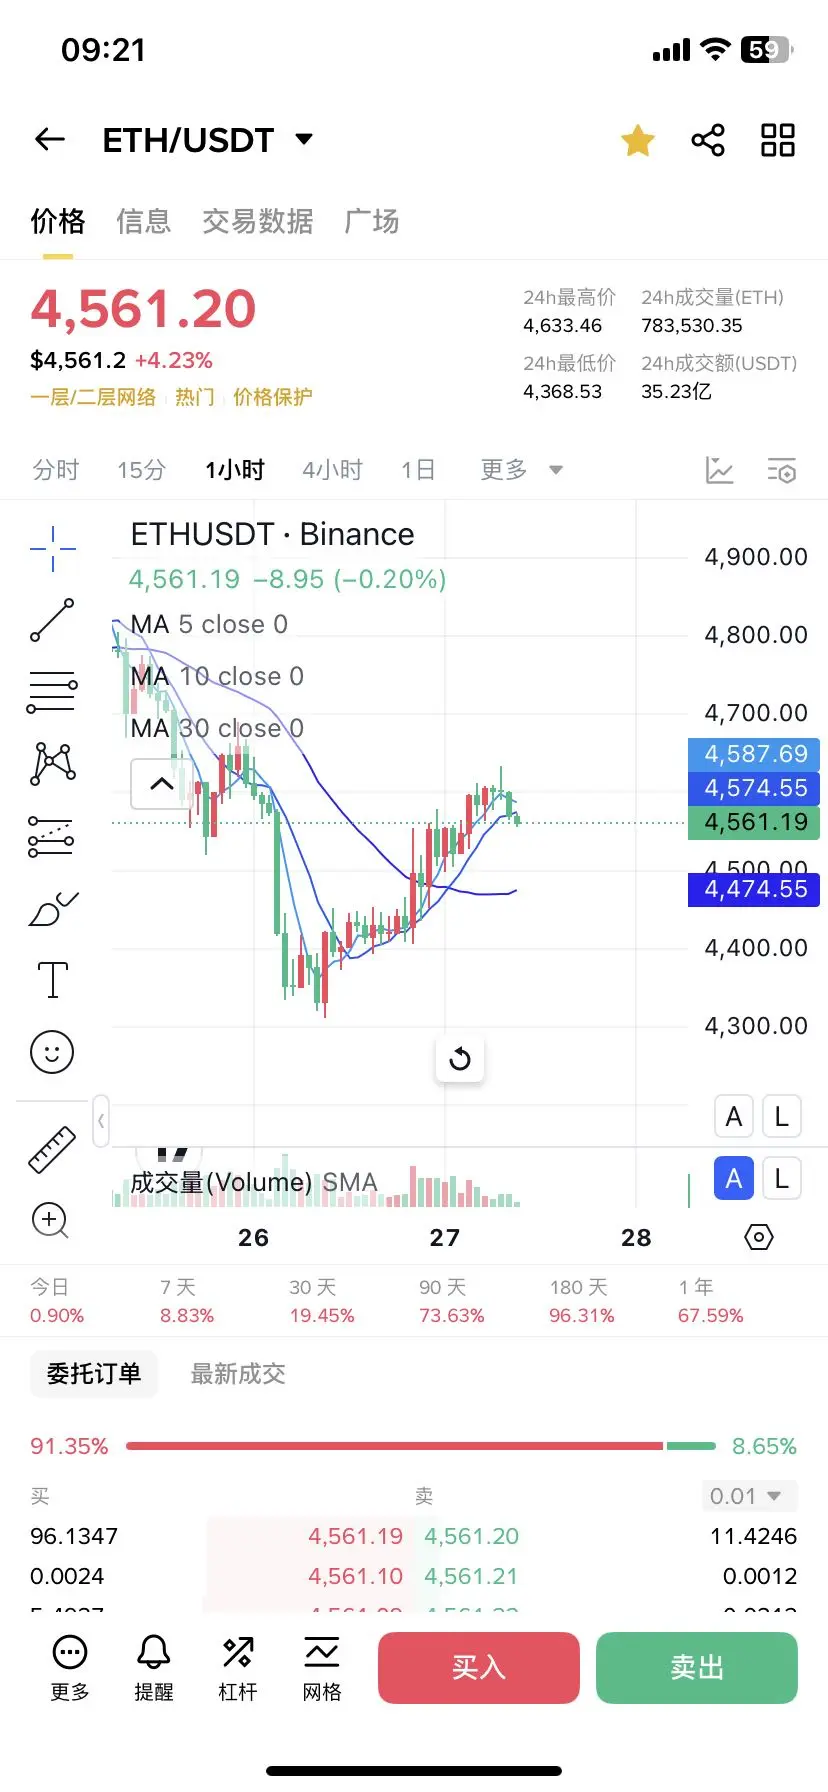
The three lines correspond to prices 127, 125, 124.
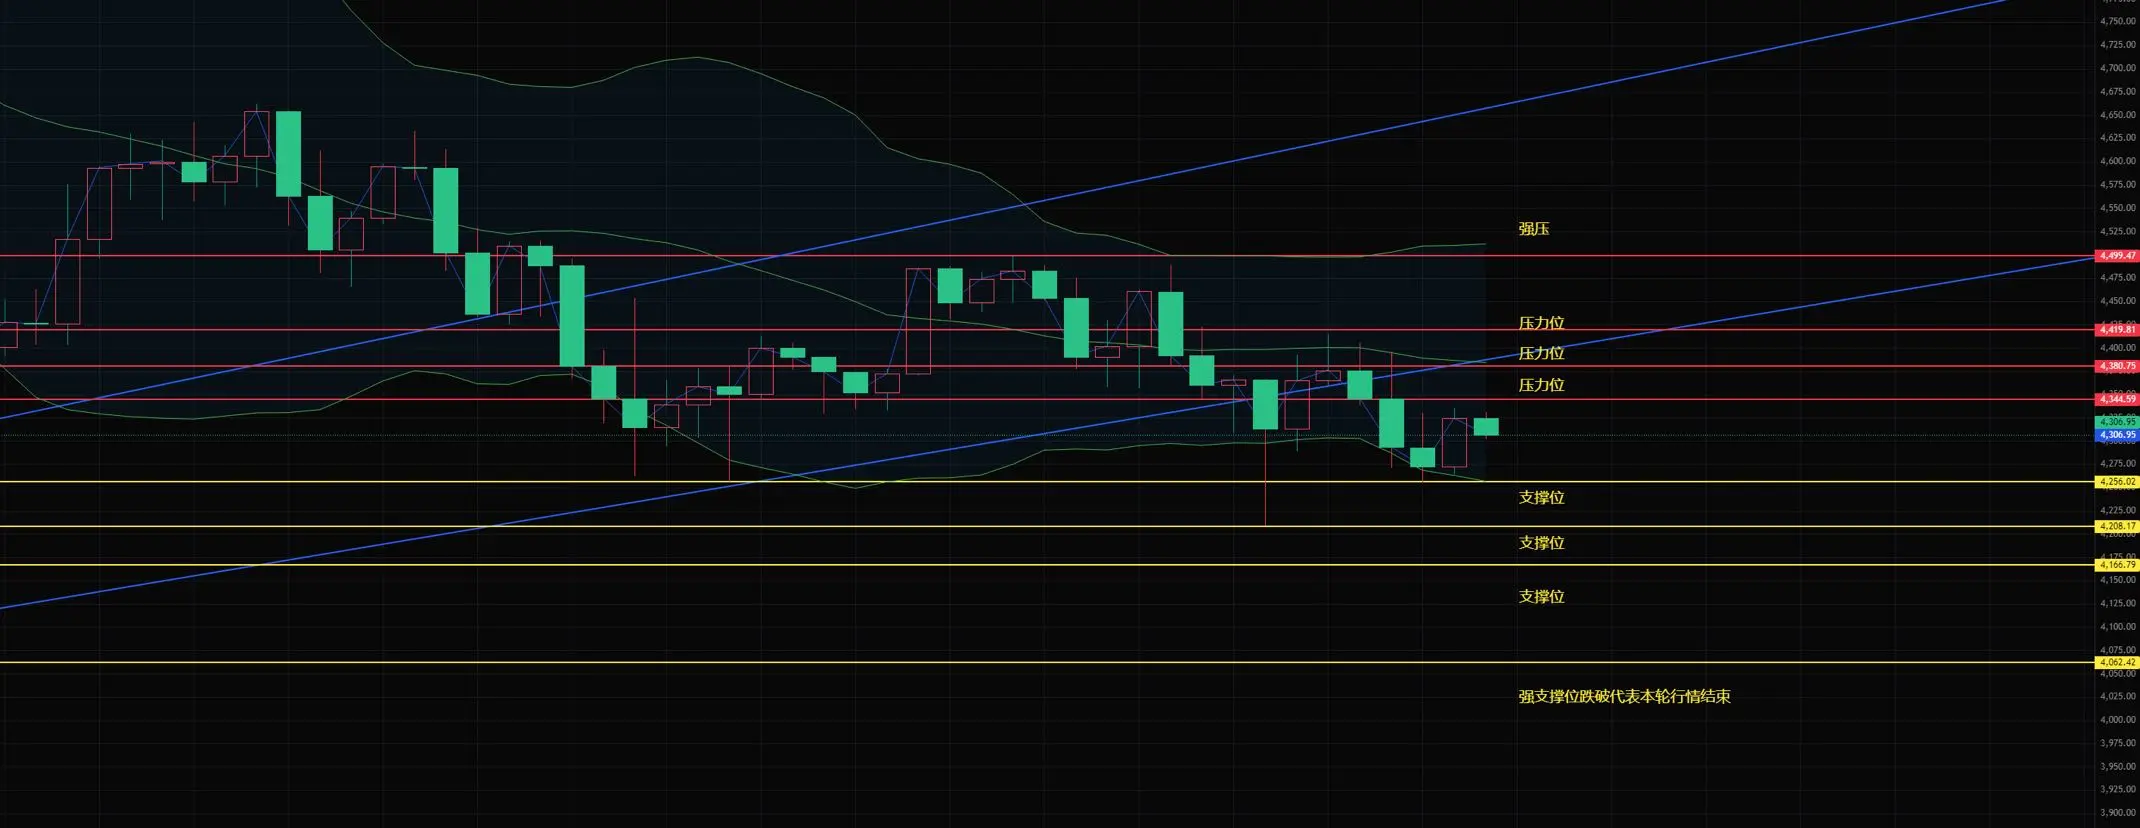
The bearish volume has increased on the 4-hour level, indicating a potential downtrend.
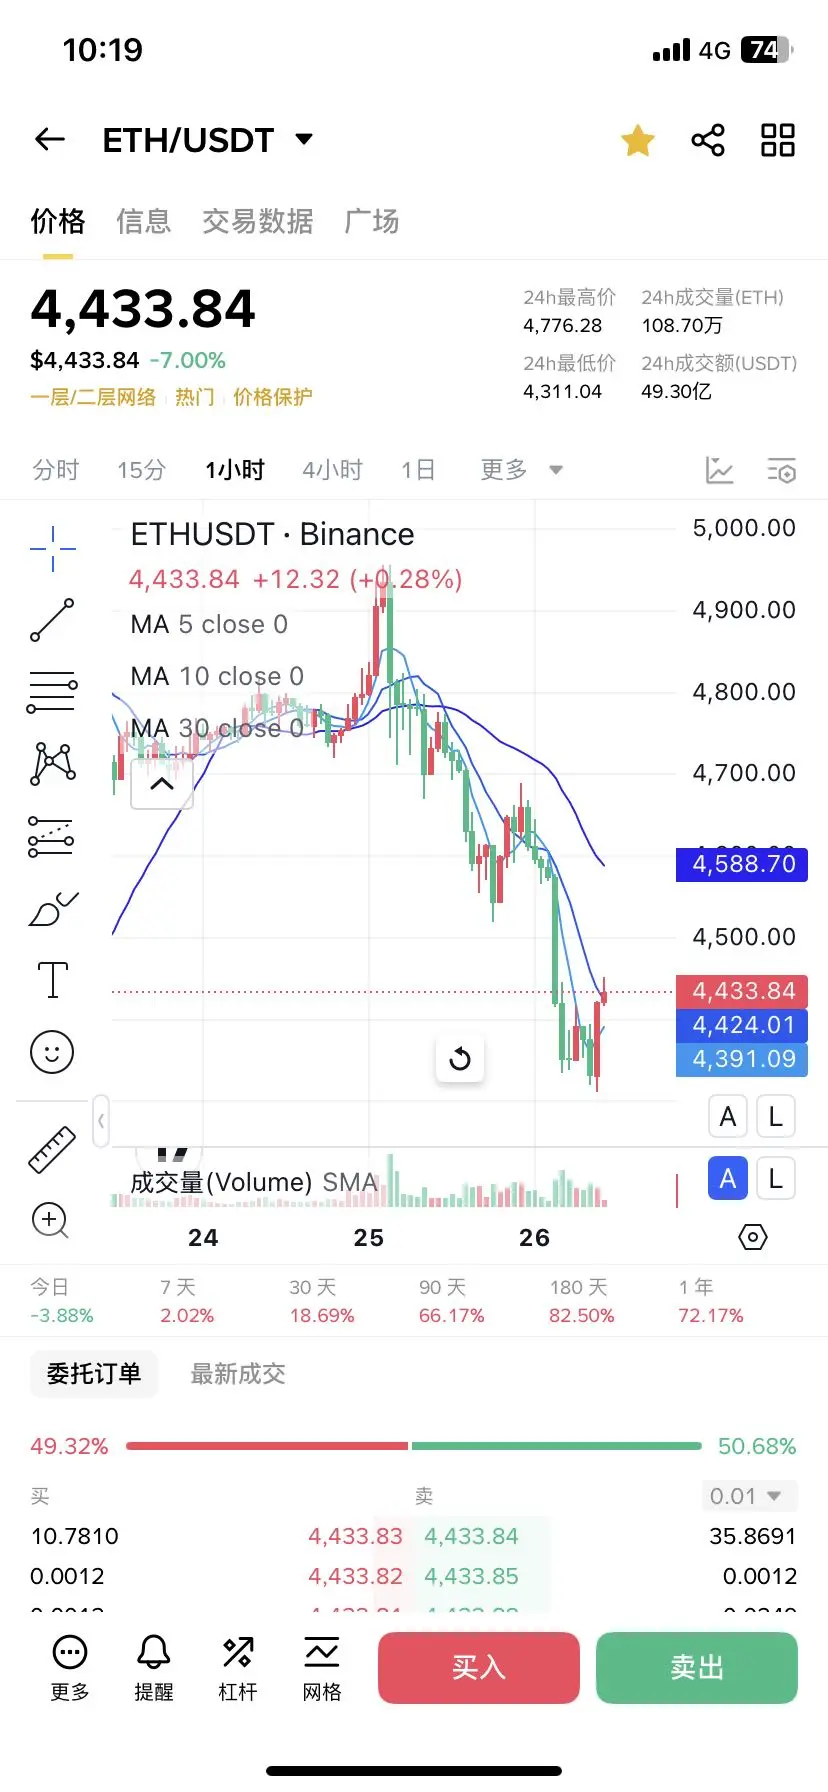
Short selling volume is beginning to strengthen in the 1-hour timeframe, which may indicate a downtrend.
Moving Average: The 4-hour chart shows a death cross between ma5 and ma10, with th
View OriginalThe three lines correspond to prices 127, 125, 124.
The bearish volume has increased on the 4-hour level, indicating a potential downtrend.
Short selling volume is beginning to strengthen in the 1-hour timeframe, which may indicate a downtrend.
Moving Average: The 4-hour chart shows a death cross between ma5 and ma10, with th