Mr.Chocolate
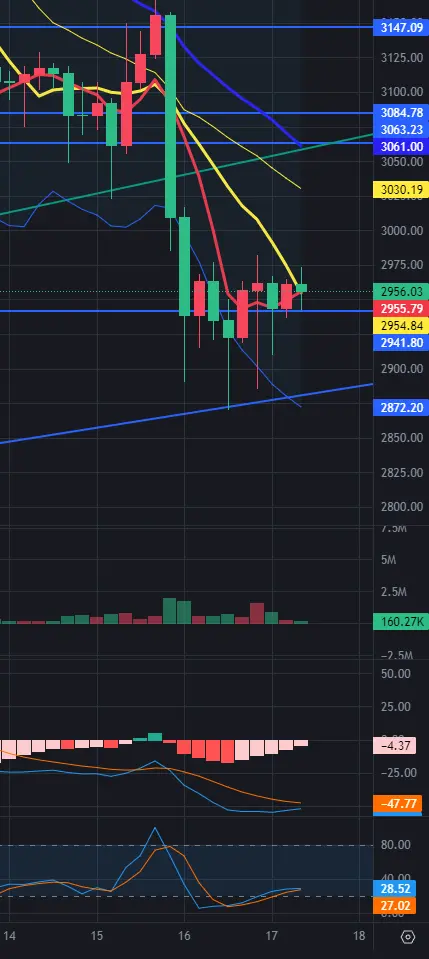
Ethereum 12.20 14:28 Technical Analysis: From the 4-hour chart, the Bollinger Bands' upper band is rising, the middle band is ascending, and the lower band is descending. Corresponding prices: 3041-2909-2777. Currently, the short- and medium-term moving averages MA5 and M10 are rising, while M30 is falling. Trading volume is decreasing. The MACD indicator is currently below the zero line with double lines moving upward, indicating increasing bullish momentum. The RSI indicator on the 4-hour chart is in the oversold area with a converging and flattening crossover.
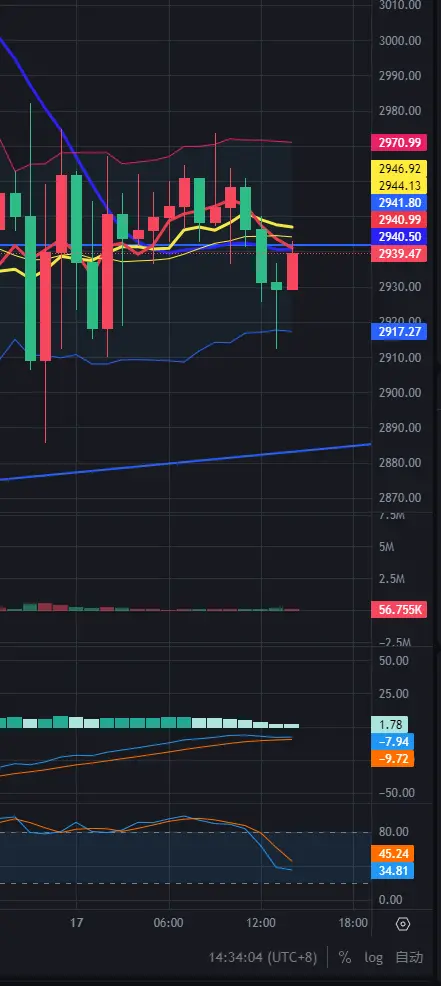
From the hourly chart, t
From the hourly chart, t
ETH-0.15%