


On March 18, 2026, the US Federal Reserve (Fed) did not surprise markets after its FOMC meeting: it kept the federal funds rate stable at 3.50%-3.75%. The decision was made with an 11-1 vote and immediately topped the global agenda with the hashtag #FedHoldsRatesSteady. This means the Fed has postponed a rate cut for the second time since January. Moreover, the decision came amidst the oil shock stemming from the Iran war, persistent inflation, and a softening labor market. So what does this "wait-and-see" strategy tell us? Is it a turning point for economies, or just a breathing space?
Let's clarify the issue at the outset: the Fed is striking a delicate balance between bringing inflation down to its 2% target and maintaining maximum employment. According to the latest data, the economy is still growing "robustly"; consumer spending is resilient, and investment continues. However, the labor market is cooling: unemployment remained stable at 4.4% in February, and job growth has slowed. Inflation remains high: the PCE index is around 2.8% over the last 12 months, and core inflation is 3.0%. On top of that, the war in the Middle East has caused energy prices to skyrocket. Fed Chairman Jerome Powell's words at the press conference sum it all up: "In the near term, rising energy prices will push overall inflation higher; however, the extent and duration of the effects are not yet clear." Powell rejected the stagflation of the 1970s but emphasized that "the risks are balanced on both sides." The decision was an official acknowledgment of this uncertainty.
Let's take a deeper look at the data and projections in the development section. The Fed's March 2026 Economic Projections Summary (SEP) and "dot plot" table clarify the logic behind the decision. According to median estimates, 2026 growth is projected at 2.4% (up from the December estimate), and unemployment remains stable at 4.4%. Inflation expectations have been revised upwards: PCE at 2.7% (from 2.5%), and core inflation at 2.7%. In the dot plot, the median expectation for the federal funds rate at the end of 2026 remained at 3.4%, meaning that expectations for only a quarter-point reduction during the year are still maintained. However, a notable detail: 14% of participants now foresee zero or a single reduction; this number was lower in December. Powell adopted a slightly hawkish tone, saying, "Actually, some members have shifted towards a smaller reduction." This confirms the market's expectation of a "less and later" reduction scenario.
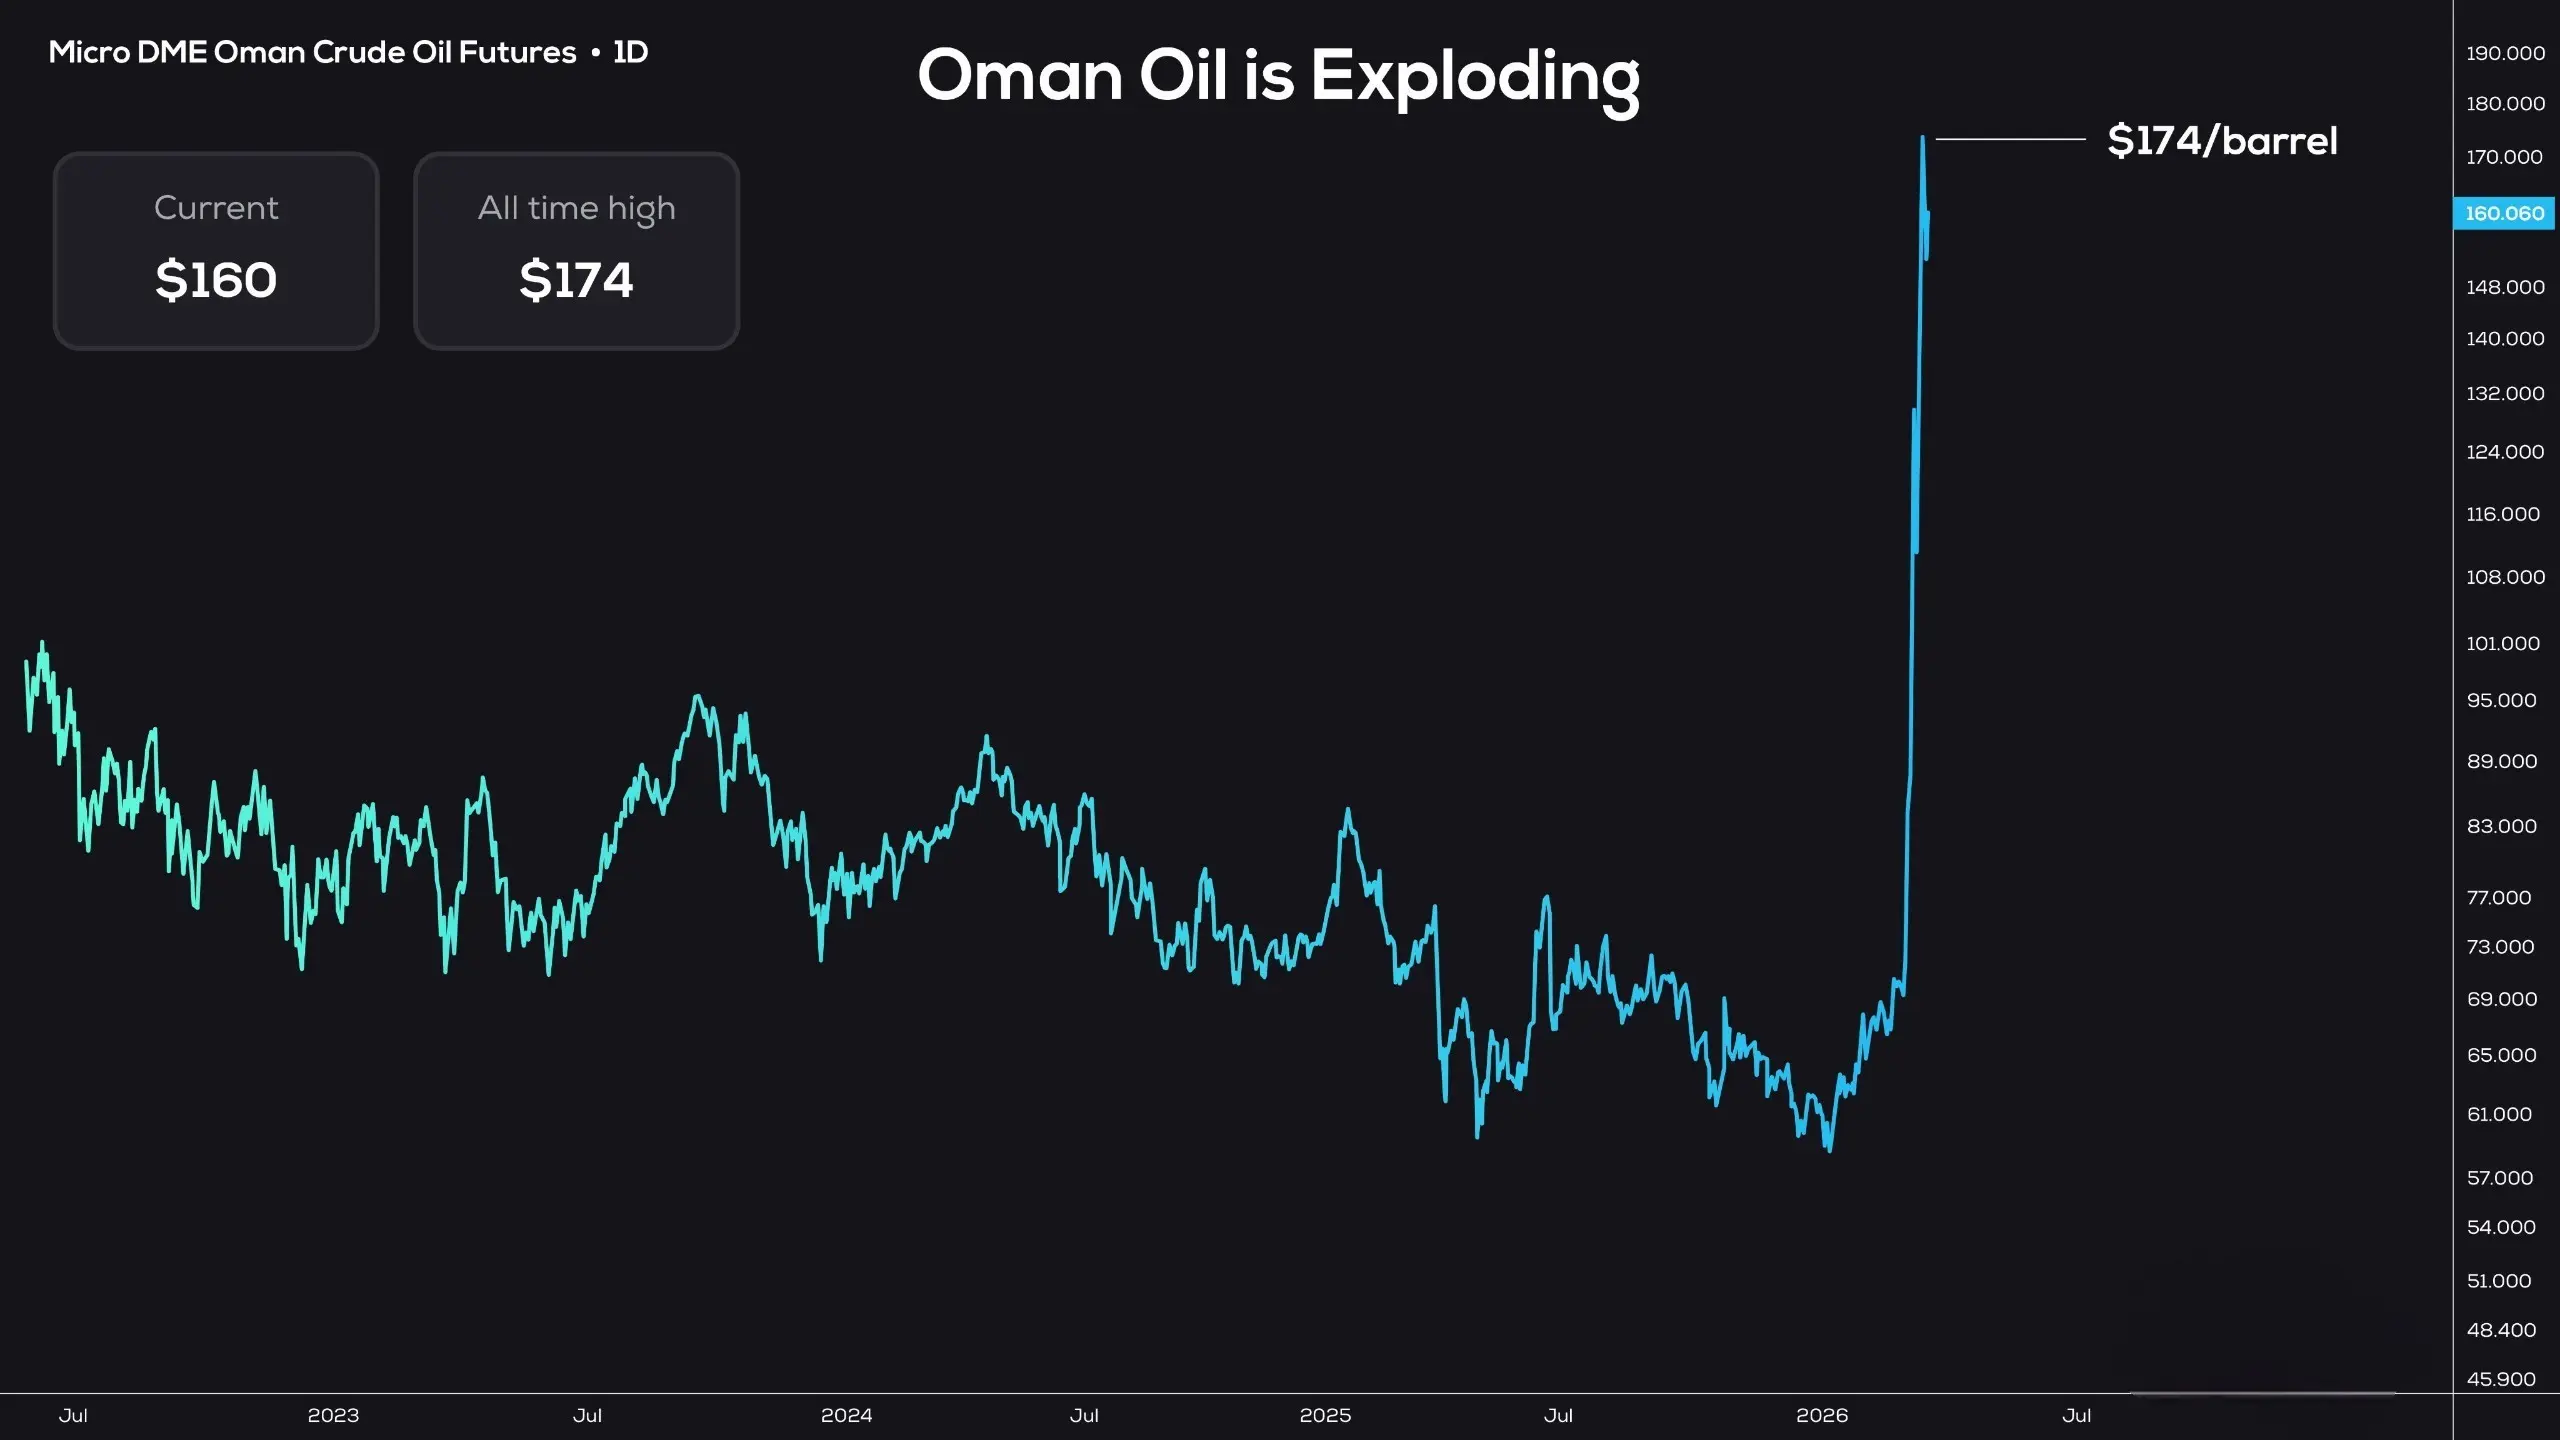
Market reaction was immediate. Wall Street experienced a loss of value after the decision; the Dow Jones fell by around 400 points, and the S&P 500 and Nasdaq tested their session lows. Oil prices, however, peaked due to the impact of the war. The dollar index strengthened, and bond yields rose slightly. Even gold was briefly under pressure. In short, the Fed's message of "we are not in a hurry yet" dampened risk appetite. Powell's statement that "a rate hike is not entirely off the table, but it is not likely at the moment" also kept investors cautious. The next meeting at the end of April (one of the final meetings of Powell's chairmanship) has now become even more critical.
#FedHoldsRatesSteady is not just a rate decision; it's an announcement of the new normal for the global economy. With its data-driven and patient stance, the Fed is sending a message of both curbing inflation and protecting growth. While the signal for a single rate cut in 2026 remains, uncertainty in the Middle East could change everything. As Powell said: "Nobody knows for sure; the effects could be bigger or smaller."
My advice to investors is clear: Watch the data patiently, diversify, and don't panic. The Fed is being patient; if we are patient and act wisely, we can weather this storm stronger. Because ultimately, the economy is shaped by data and logic – not emotions. Until the next meetings; uncertainty persists, but there is still hope on the horizon.
Let's clarify the issue at the outset: the Fed is striking a delicate balance between bringing inflation down to its 2% target and maintaining maximum employment. According to the latest data, the economy is still growing "robustly"; consumer spending is resilient, and investment continues. However, the labor market is cooling: unemployment remained stable at 4.4% in February, and job growth has slowed. Inflation remains high: the PCE index is around 2.8% over the last 12 months, and core inflation is 3.0%. On top of that, the war in the Middle East has caused energy prices to skyrocket. Fed Chairman Jerome Powell's words at the press conference sum it all up: "In the near term, rising energy prices will push overall inflation higher; however, the extent and duration of the effects are not yet clear." Powell rejected the stagflation of the 1970s but emphasized that "the risks are balanced on both sides." The decision was an official acknowledgment of this uncertainty.
Let's take a deeper look at the data and projections in the development section. The Fed's March 2026 Economic Projections Summary (SEP) and "dot plot" table clarify the logic behind the decision. According to median estimates, 2026 growth is projected at 2.4% (up from the December estimate), and unemployment remains stable at 4.4%. Inflation expectations have been revised upwards: PCE at 2.7% (from 2.5%), and core inflation at 2.7%. In the dot plot, the median expectation for the federal funds rate at the end of 2026 remained at 3.4%, meaning that expectations for only a quarter-point reduction during the year are still maintained. However, a notable detail: 14% of participants now foresee zero or a single reduction; this number was lower in December. Powell adopted a slightly hawkish tone, saying, "Actually, some members have shifted towards a smaller reduction." This confirms the market's expectation of a "less and later" reduction scenario.
Market reaction was immediate. Wall Street experienced a loss of value after the decision; the Dow Jones fell by around 400 points, and the S&P 500 and Nasdaq tested their session lows. Oil prices, however, peaked due to the impact of the war. The dollar index strengthened, and bond yields rose slightly. Even gold was briefly under pressure. In short, the Fed's message of "we are not in a hurry yet" dampened risk appetite. Powell's statement that "a rate hike is not entirely off the table, but it is not likely at the moment" also kept investors cautious. The next meeting at the end of April (one of the final meetings of Powell's chairmanship) has now become even more critical.
#FedHoldsRatesSteady is not just a rate decision; it's an announcement of the new normal for the global economy. With its data-driven and patient stance, the Fed is sending a message of both curbing inflation and protecting growth. While the signal for a single rate cut in 2026 remains, uncertainty in the Middle East could change everything. As Powell said: "Nobody knows for sure; the effects could be bigger or smaller."
My advice to investors is clear: Watch the data patiently, diversify, and don't panic. The Fed is being patient; if we are patient and act wisely, we can weather this storm stronger. Because ultimately, the economy is shaped by data and logic – not emotions. Until the next meetings; uncertainty persists, but there is still hope on the horizon.