#GateGoldenTouch :
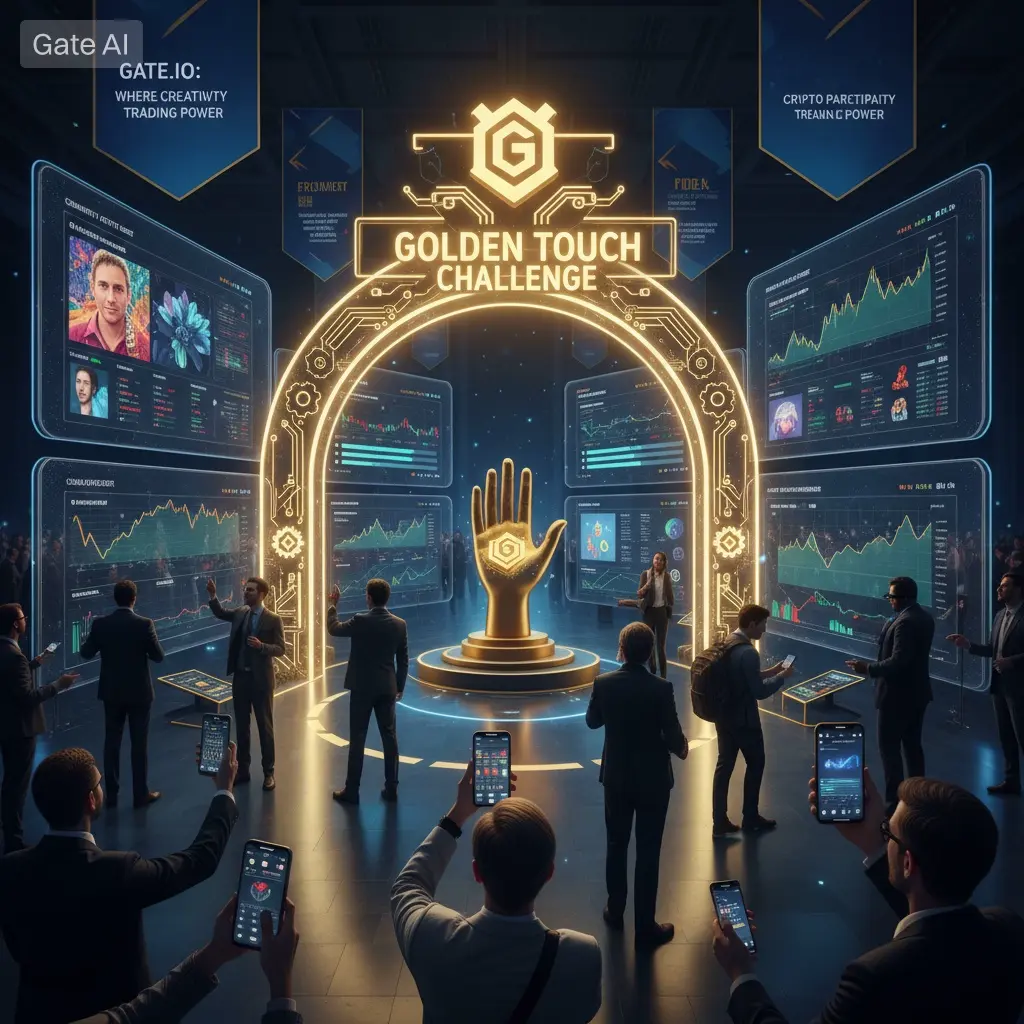
✨ Gate Golden Touch Challenge — Where Creativity Meets Real Crypto Power
Everything I Touch Turns to GOLD — and So Does the Ecosystem
Forget King Midas — this is the era of smart traders, strong communities, and powerful platforms.
Imagine waking up, opening your portfolio, and seeing every position not just green… but glowing GOLD. That is the energy behind the Gate Golden Touch Challenge, launched on March 30, 2026 — a campaign that goes far beyond a simple social event. It is a fusion of creativity, community, and capital growth.
This is not just about turning ideas into gold.
It is about turning user engagement into real platform momentum.
The Concept: Turning Moments Into Value
If there is one thing worth turning into gold, it is not just profits — it is decisions.
That hesitation before clicking Buy → GOLD
That early exit you regret → GOLD
That late night studying charts → PURE GOLD
The campaign taps into something deeper:
the psychology of trading and the emotional journey of every crypto user.
At its core, this challenge transforms personal trading experiences into shareable, creative narratives, making every user part of a larger story.
Event Structure: Smart Design, Massive Impact
The Gate Golden Touch Challenge is strategically divided into two powerful layers:
1. Social Engagement Layer (Low Barrier, High Virality)
Users can participate by:
Following Gate Square
Liking and reposting
Commenting or sharing creative “Golden Touch” moments
Using the hashtag #GateGoldenTouch
This low entry barrier removes friction and unlocks mass participation, encouraging both new and experienced users to engage.
2. Trading Challenge Layer (Real Stakes, Real Rewards)
High-value reward pool (up to 50,000 USDT)
Futures trading competition
Ranking-based incentives
This layer converts attention into actual trading activity, bridging the gap between social hype and platform revenue.
User Behavior Transformation
This campaign is not just participation — it is behavior engineering.
It successfully targets three types of users:
Content Creators → motivated by creativity rewards
Casual Users → driven by lucky prizes
Serious Traders → attracted to high-stakes competitions
By aligning incentives across all segments, Gate creates a system where:
👉 Engagement leads to interaction
👉 Interaction leads to activity
👉 Activity leads to trading
Community Explosion: From Audience to Ecosystem
The early engagement metrics already show strong momentum — high likes, reposts, and comment activity.
But the real impact goes deeper:
Users shift from passive viewers → active contributors
Content diversity increases (memes, screenshots, AI visuals, trading stories)
Social connections inside the community strengthen
This transforms Gate from just a platform into a living, breathing ecosystem.
Brand Power: Turning Symbolism Into Identity
The “Golden Touch” concept is more than a theme — it is a branding masterstroke.
It connects Gate with:
Wealth creation
Opportunity
Innovation
Luck + Skill combination
Every user-generated post becomes free brand amplification, multiplying reach organically across global audiences.
From Hype to Revenue: The Conversion Engine
What makes this campaign powerful is its ability to convert:
Social Attention → Platform Growth
Creative Prize → Drives content creation
Lucky Prize → Boosts participation volume
Trading Rewards → Increases transaction activity
This creates a full funnel:
Awareness → Engagement → Participation → Trading → Retention
Long-Term Impact: Beyond the Challenge
Even after the campaign ends, its effects continue:
High-quality user-generated content remains
Stronger community bonds persist
New users keep entering through shared content
This is the long-tail effect, where one campaign fuels growth long after it ends.
Risks & Sustainability
No campaign is perfect. Key challenges include:
Maintaining momentum after initial hype
Avoiding low-quality participation driven only by rewards
Balancing incentives with genuine engagement
To sustain success, continuous innovation and community-driven evolution are essential.
The Bigger Picture: A Golden Era Already Here
The most powerful message behind this campaign is simple:
The golden era of crypto is not coming — it is already here.
And Gate is positioning itself at the center of it by combining:
Social virality
User creativity
Trading incentives
Community strength
Final Thought: Your Golden Touch Moment
At the end of the day, this challenge asks one powerful question:
👉 What would YOU turn into gold?
Because in crypto, the real golden touch is not magic —
it is decision, discipline, and participation.
Join the movement. Create. Trade. Transform.
#GateGoldenTouch