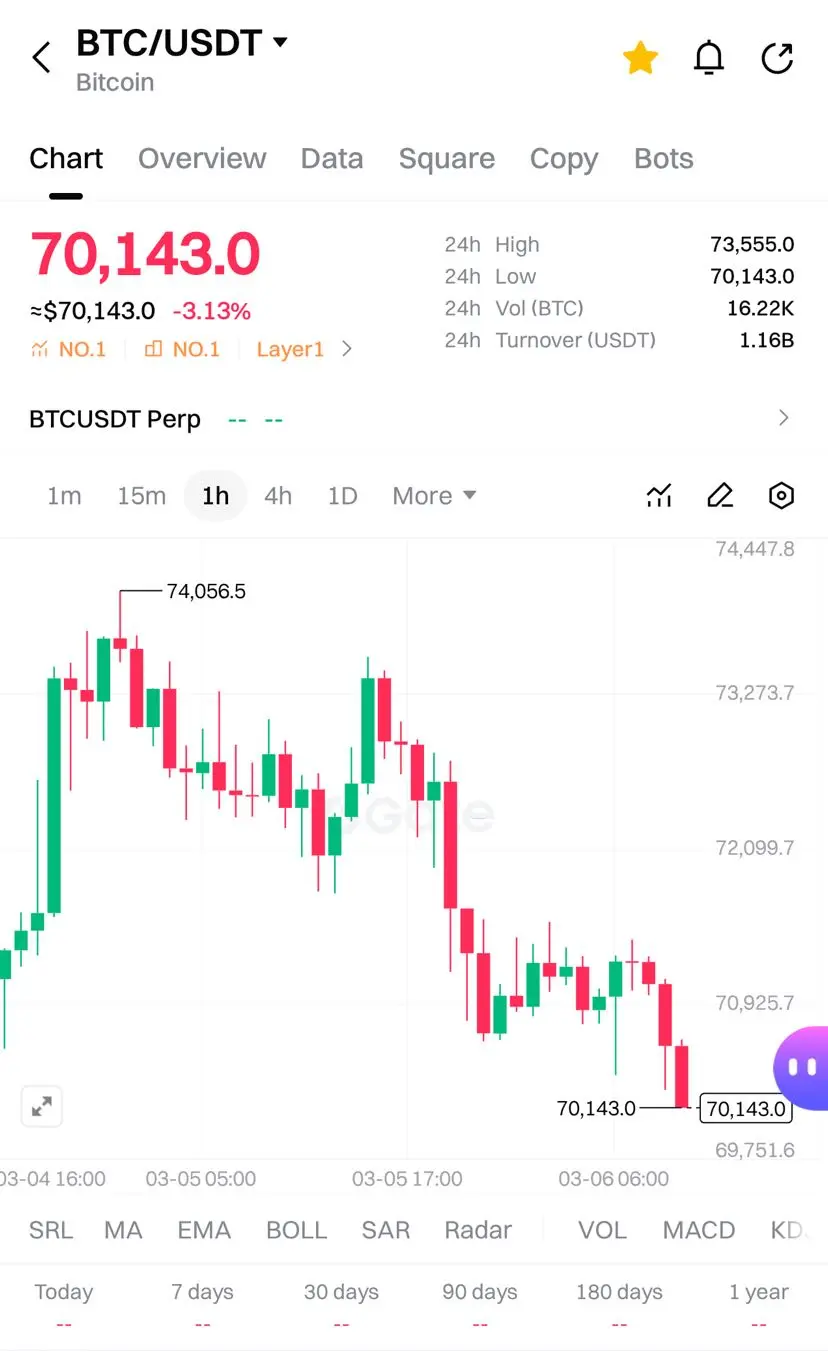


#BitcoinHitsOneMonthHigh $DOGE
Based on charts DOGE/USDT, here is a technical analysis applying the ICT Judas Swing Setup.
I will synthesize the information from both timeframes (likely the first chart is 4H, and the lower timeframe 15m) to simulate the "5-Step Blueprint."
Step 1: Confirm Daily Bias
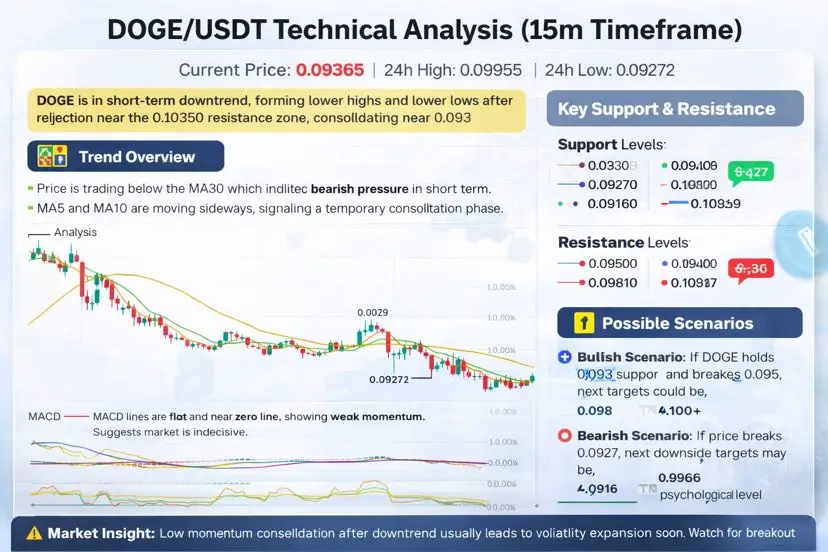
· Analysis: The daily bias is determined by looking at the higher timeframe structure. The first screenshot shows the price at 0.09739.
· Key Observations:
· The price is trading above the main BOLL line (0.09369).
· The price is currently trading near the Upper Bollinger Band (UB: 0.10109), indicating bullish momentum.
· The MACD shows a positive reading (DIF: 0.00102 > DEA: 0.00032), which is a bullish signal.
· Bias: Bullish. We are looking for buying opportunities.
Step 2: Locate High-Probability Liquidity
· Analysis: We look for areas where stop-losses are likely resting.
· Key Observations:
· Above Current Price: The obvious liquidity pool is the recent high (24h High: 0.10428). Price often aims to sweep these highs.
· Below Current Price: The SAR is at 0.09141, and the Lower Bollinger Band (LB) is at 0.08629. These are support levels, but liquidity would be found below recent swing lows. The "24h Low" at 0.09149 is a recent low that could act as a draw on liquidity.
· Target Pool: The high at 0.10428 is the primary target. To get there efficiently, the market might first grab liquidity below a support level.
Step 3: Wait for Judas Raid
· Analysis: This is a "false breakout" designed to trigger traders before reversing.
· Scenario for a Long (Buy) Setup:
· We would expect the price to break down below a recent support level (e.g., below the 0.09149 low or the SAR level) to trigger sell-stops and shake out weak long holders.
· Once those sell orders are filled, the smart money would reverse the price upwards.
· Low Timeframe Clues (Screenshot 2):
· The second chart shows a very tight range (BOLL: 0.09640, UB: 0.09773, LB: 0.09506).
· The SAR is at 0.09620. A raid would be a sudden wick or candle close below this tight range (below 0.09506) to grab liquidity, followed by an immediate reversal back inside the range.
Step 4: Confirm Reversal Structure
· Analysis: After the raid, we need to see the market structure break (MSB) or a change in state of delivery (CHoCH).
· Confirmation:
· If the raid is to the downside: We would need to see a strong bullish candlestick (e.g., an engulfing candle) that closes back above the "range low" (the level that was just broken).
· The candle should break the recent "high" of the swing that occurred just before the raid.
· On the second chart, confirmation would be a clean break and close above the consolidation range (above 0.09773).
Step 5: Enter on OTE (61.8–78.6%)
· Analysis: After the reversal is confirmed, we wait for a retracement to the Optimal Trade Entry (OTE) zone.
· Execution:
· Fibonacci Retracement: You would draw your Fib from the low of the "Judas Raid" to the high of the reversal structure confirmation.
· Entry Zone: The ideal entry is a retracement into the 61.8% to 78.6% Fibonacci levels of that move. You would look for a bullish reversal pattern (like a hammer or an engulfing candle) within that zone to trigger the entry.
· Stop Loss: Placed just below the "Judas Raid" low.
· Take Profit: The initial target would be the liquidity pool identified in Step 2 (0.10428).
Summary of the Plan
1. Bias: Bullish.
2. Target: 0.10428.
3. The Trigger: Wait for a sudden, sharp move downwards (below ~0.09500 or the 24h low) to create a false breakdown.
4. Confirmation: Wait for price to immediately reverse and close back above the breakdown level (~0.0977).
5. The Entry: After the reversal, wait for a retracement (pullback) to buy at a discount (the OTE zone between ~61.8% and 78.6% of the reversal move), with a stop loss below the raid low.
Based on charts DOGE/USDT, here is a technical analysis applying the ICT Judas Swing Setup.
I will synthesize the information from both timeframes (likely the first chart is 4H, and the lower timeframe 15m) to simulate the "5-Step Blueprint."
Step 1: Confirm Daily Bias
· Analysis: The daily bias is determined by looking at the higher timeframe structure. The first screenshot shows the price at 0.09739.
· Key Observations:
· The price is trading above the main BOLL line (0.09369).
· The price is currently trading near the Upper Bollinger Band (UB: 0.10109), indicating bullish momentum.
· The MACD shows a positive reading (DIF: 0.00102 > DEA: 0.00032), which is a bullish signal.
· Bias: Bullish. We are looking for buying opportunities.
Step 2: Locate High-Probability Liquidity
· Analysis: We look for areas where stop-losses are likely resting.
· Key Observations:
· Above Current Price: The obvious liquidity pool is the recent high (24h High: 0.10428). Price often aims to sweep these highs.
· Below Current Price: The SAR is at 0.09141, and the Lower Bollinger Band (LB) is at 0.08629. These are support levels, but liquidity would be found below recent swing lows. The "24h Low" at 0.09149 is a recent low that could act as a draw on liquidity.
· Target Pool: The high at 0.10428 is the primary target. To get there efficiently, the market might first grab liquidity below a support level.
Step 3: Wait for Judas Raid
· Analysis: This is a "false breakout" designed to trigger traders before reversing.
· Scenario for a Long (Buy) Setup:
· We would expect the price to break down below a recent support level (e.g., below the 0.09149 low or the SAR level) to trigger sell-stops and shake out weak long holders.
· Once those sell orders are filled, the smart money would reverse the price upwards.
· Low Timeframe Clues (Screenshot 2):
· The second chart shows a very tight range (BOLL: 0.09640, UB: 0.09773, LB: 0.09506).
· The SAR is at 0.09620. A raid would be a sudden wick or candle close below this tight range (below 0.09506) to grab liquidity, followed by an immediate reversal back inside the range.
Step 4: Confirm Reversal Structure
· Analysis: After the raid, we need to see the market structure break (MSB) or a change in state of delivery (CHoCH).
· Confirmation:
· If the raid is to the downside: We would need to see a strong bullish candlestick (e.g., an engulfing candle) that closes back above the "range low" (the level that was just broken).
· The candle should break the recent "high" of the swing that occurred just before the raid.
· On the second chart, confirmation would be a clean break and close above the consolidation range (above 0.09773).
Step 5: Enter on OTE (61.8–78.6%)
· Analysis: After the reversal is confirmed, we wait for a retracement to the Optimal Trade Entry (OTE) zone.
· Execution:
· Fibonacci Retracement: You would draw your Fib from the low of the "Judas Raid" to the high of the reversal structure confirmation.
· Entry Zone: The ideal entry is a retracement into the 61.8% to 78.6% Fibonacci levels of that move. You would look for a bullish reversal pattern (like a hammer or an engulfing candle) within that zone to trigger the entry.
· Stop Loss: Placed just below the "Judas Raid" low.
· Take Profit: The initial target would be the liquidity pool identified in Step 2 (0.10428).
Summary of the Plan
1. Bias: Bullish.
2. Target: 0.10428.
3. The Trigger: Wait for a sudden, sharp move downwards (below ~0.09500 or the 24h low) to create a false breakdown.
4. Confirmation: Wait for price to immediately reverse and close back above the breakdown level (~0.0977).
5. The Entry: After the reversal, wait for a retracement (pullback) to buy at a discount (the OTE zone between ~61.8% and 78.6% of the reversal move), with a stop loss below the raid low.