Trade
Trading Type
Spot
Trade crypto freely
Alpha
Points
Get promising tokens in streamlined on-chain trading
Pre-Market
Trade new tokens before they are officially listed
Margin
Magnify your profit with leverage
Convert & Block Trading
0 Fees
Trade any size with no fees and no slippage
Leveraged Tokens
Get exposure to leveraged positions simply
Futures
Futures
Hundreds of contracts settled in USDT or BTC
Options
HOT
Trade European-style vanilla options
Unified Account
Maximize your capital efficiency
Demo Trading
Futures Kickoff
Get prepared for your futures trading
Futures Events
Participate in events to win generous rewards
Demo Trading
Use virtual funds to experience risk-free trading
Earn
Launch
CandyDrop
Collect candies to earn airdrops
Launchpool
Quick staking, earn potential new tokens
HODLer Airdrop
Hold GT and get massive airdrops for free
Launchpad
NEW
Be early to the next big token project
Alpha Points
NEW
Trade on-chain assets and enjoy airdrop rewards!
Futures Points
NEW
Earn futures points and claim airdrop rewards
Investment
Simple Earn
Earn interests with idle tokens
Auto-Invest
Auto-invest on a regular basis
Dual Investment
Buy low and sell high to take profits from price fluctuations
Soft Staking
Earn rewards with flexible staking
Crypto Loan
0 Fees
Pledge one crypto to borrow another
Lending Center
One-stop lending hub
VIP Wealth Hub
Customized wealth management empowers your assets growth
Private Wealth Management
Customized asset management to grow your digital assets
Quant Fund
Top asset management team helps you profit without hassle
Staking
Stake cryptos to earn in PoS products
BTC Staking
HOT
Stake BTC and earn 10% APR
GUSD Minting
Use USDT/USDC to mint GUSD for treasury-level yields
More
UnlimitedCryptoTrading
No content yet
UnlimitedCryptoTrading
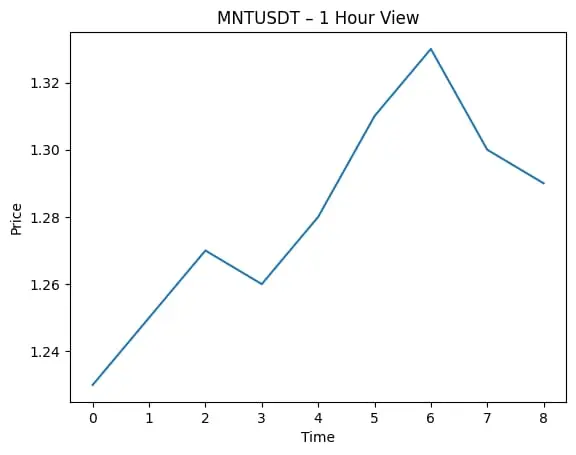
$MNT MNTUSDT Market View | Short-Term Outlook
MNTUSDT is trading around 1.28–1.29 after a strong impulsive move up and a healthy pullback. Price is cooling off, but the structure still looks constructive.
1 Hour View On the 1H chart, MNTUSDT pushed hard to the 1.33 area and then pulled back smoothly. This looks like profit-taking, not panic. As long as price holds above the short-term support zone, continuation is still possible.
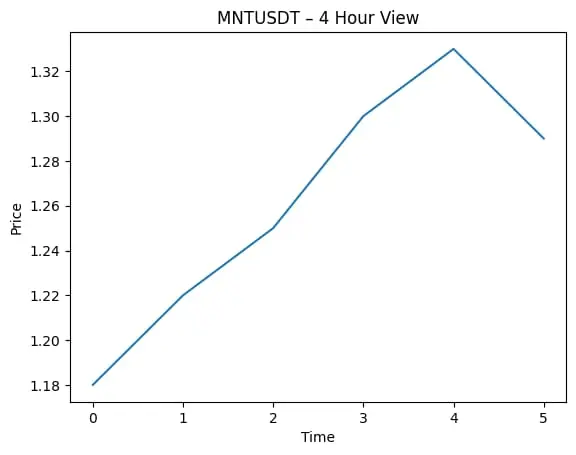
4 Hour View The 4H chart shows a clear bullish leg followed by consolidation. Higher lows are still intact, which keeps the overall trend positive. This phase looks
MNTUSDT is trading around 1.28–1.29 after a strong impulsive move up and a healthy pullback. Price is cooling off, but the structure still looks constructive.
1 Hour View On the 1H chart, MNTUSDT pushed hard to the 1.33 area and then pulled back smoothly. This looks like profit-taking, not panic. As long as price holds above the short-term support zone, continuation is still possible.
4 Hour View The 4H chart shows a clear bullish leg followed by consolidation. Higher lows are still intact, which keeps the overall trend positive. This phase looks
MNT2.4%
- Reward
- 2
- Comment
- Repost
- Share
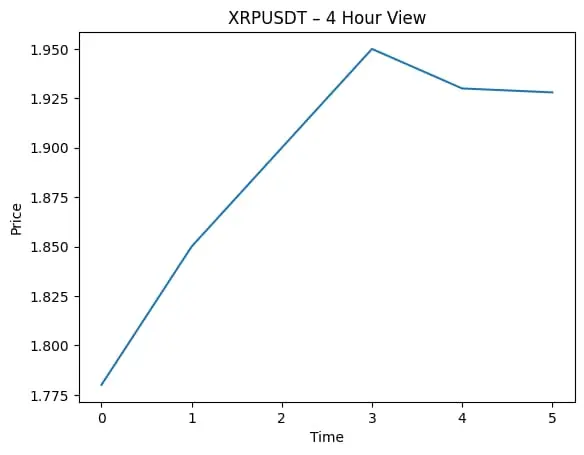
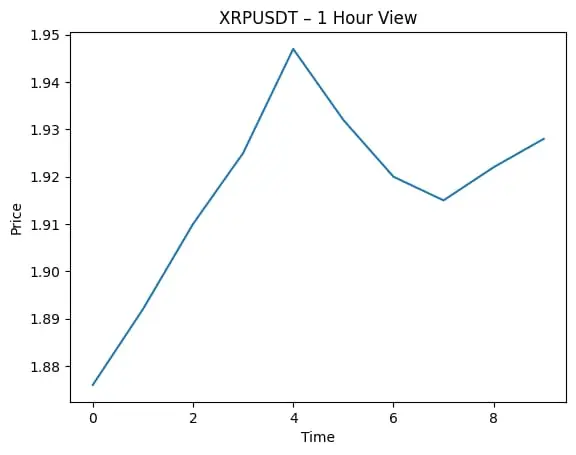
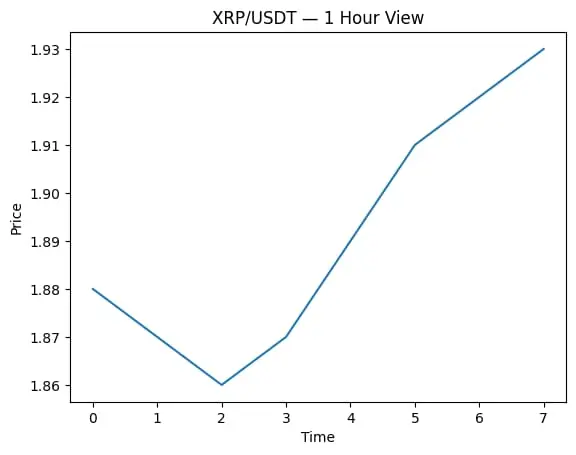
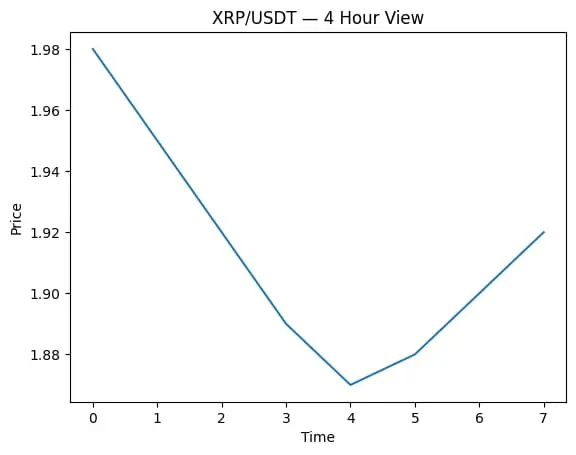
$XRP XRPUSDT Market View | Short-Term Outlook
XRPUSDT is trading near 1.92–1.93, holding steady after a strong push up. Price is now moving calmly, which usually means the market is deciding the next direction.
1 Hour View On the 1H chart, XRPUSDT shows a quick move up followed by consolidation. Buyers are still defending the dips, and price is holding above the short-term support zone. If momentum builds, another small push upward is possible.
4 Hour View The 4H structure remains positive. The recent pullback looks healthy, not weak. As long as price stays above the key support area, the ov
XRP0.15%

- Reward
- 1
- Comment
- Repost
- Share
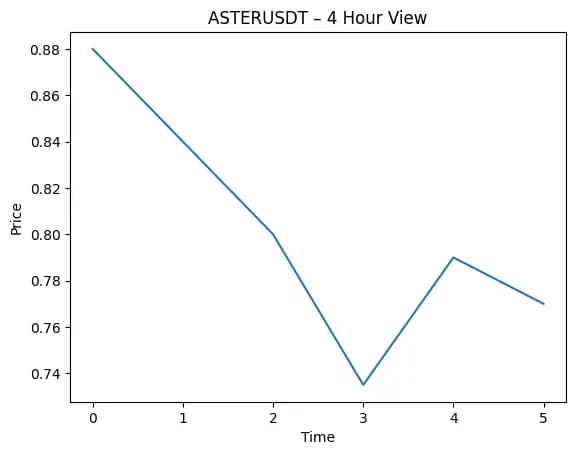
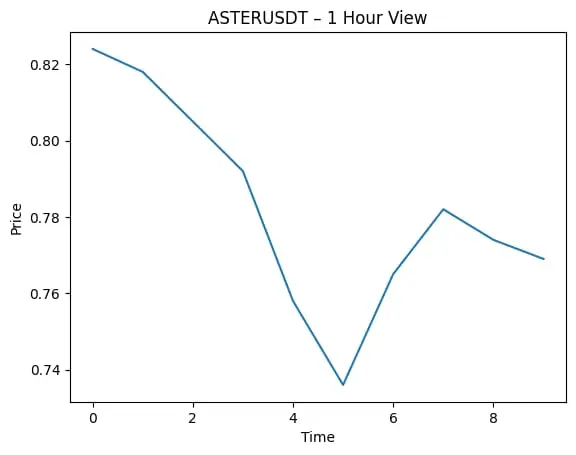
$ASTER ASTERUSDT Market View | Short-Term Outlook
ASTERUSDT is trading around 0.76–0.77 after a sharp pullback. The heavy selling looks paused for now, and price is trying to stabilize near the lower zone.
1 Hour View On the 1H chart, ASTERUSDT shows a strong drop followed by a small bounce. Buyers are stepping in near the recent low, but momentum is still weak. This looks like a short-term relief phase rather than a confirmed reversal.
4 Hour View The 4H timeframe still shows pressure from the downside. However, price has reacted well from the bottom area, suggesting selling strength is slo
ASTER-6.74%
- Reward
- like
- Comment
- Repost
- Share
$ASTER ASTERUSDT Market View | Short-Term Outlook
ASTERUSDT is trading around 0.76–0.77 after a sharp pullback. The heavy selling looks paused for now, and price is trying to stabilize near the lower zone.
1 Hour View On the 1H chart, ASTERUSDT shows a strong drop followed by a small bounce. Buyers are stepping in near the recent low, but momentum is still weak. This looks like a short-term relief phase rather than a confirmed reversal.
4 Hour View The 4H timeframe still shows pressure from the downside. However, price has reacted well from the bottom area, suggesting selling strength is slo
ASTERUSDT is trading around 0.76–0.77 after a sharp pullback. The heavy selling looks paused for now, and price is trying to stabilize near the lower zone.
1 Hour View On the 1H chart, ASTERUSDT shows a strong drop followed by a small bounce. Buyers are stepping in near the recent low, but momentum is still weak. This looks like a short-term relief phase rather than a confirmed reversal.
4 Hour View The 4H timeframe still shows pressure from the downside. However, price has reacted well from the bottom area, suggesting selling strength is slo
ASTER-6.74%


- Reward
- like
- Comment
- Repost
- Share
$XRP XRPUSDT Market View | Short-Term Outlook
XRPUSDT is trading near 1.92–1.93, holding steady after a strong push up. Price is now moving calmly, which usually means the market is deciding the next direction.
1 Hour View On the 1H chart, XRPUSDT shows a quick move up followed by consolidation. Buyers are still defending the dips, and price is holding above the short-term support zone. If momentum builds, another small push upward is possible.
4 Hour View The 4H structure remains positive. The recent pullback looks healthy, not weak. As long as price stays above the key support area, the ov
XRPUSDT is trading near 1.92–1.93, holding steady after a strong push up. Price is now moving calmly, which usually means the market is deciding the next direction.
1 Hour View On the 1H chart, XRPUSDT shows a quick move up followed by consolidation. Buyers are still defending the dips, and price is holding above the short-term support zone. If momentum builds, another small push upward is possible.
4 Hour View The 4H structure remains positive. The recent pullback looks healthy, not weak. As long as price stays above the key support area, the ov
XRP0.15%

- Reward
- like
- Comment
- Repost
- Share
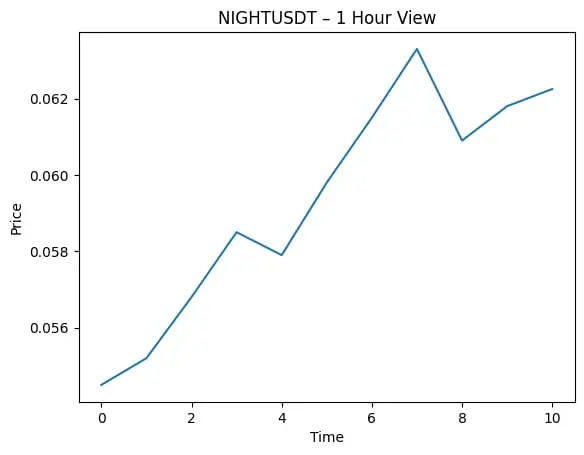
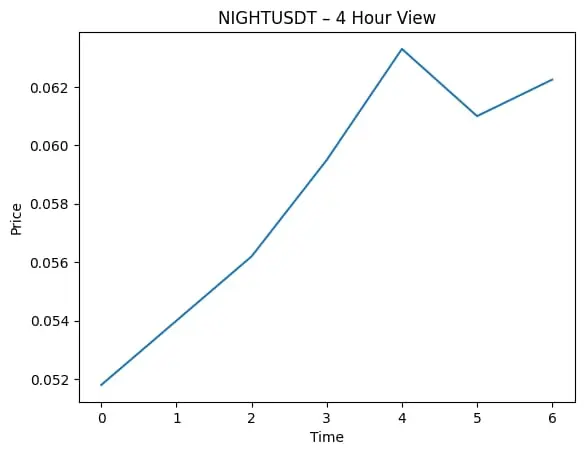
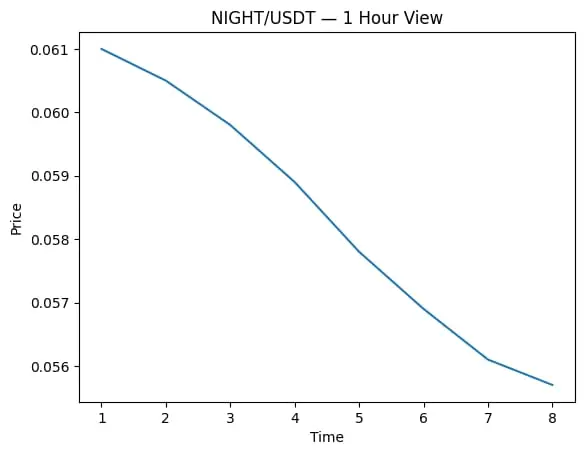
$NIGHT NIGHTUSDT Market Update | Short-Term Outlook
NIGHTUSDT is trading around 0.062 after a clean recovery from the recent dip. Price structure looks stable and buyers are slowly stepping back in.
1 Hour View On the 1H timeframe, NIGHTUSDT is forming higher lows. After a small pullback from the local top, price is trying to move up again. As long as it holds above the short-term support zone, momentum stays positive.
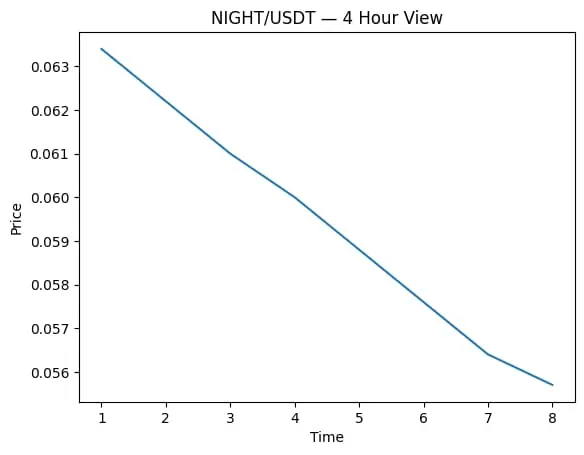
4 Hour View The 4H chart shows a clear recovery move from the bottom area. The trend still looks healthy, with price holding above the key moving zone. This looks more like co
NIGHTUSDT is trading around 0.062 after a clean recovery from the recent dip. Price structure looks stable and buyers are slowly stepping back in.
1 Hour View On the 1H timeframe, NIGHTUSDT is forming higher lows. After a small pullback from the local top, price is trying to move up again. As long as it holds above the short-term support zone, momentum stays positive.
4 Hour View The 4H chart shows a clear recovery move from the bottom area. The trend still looks healthy, with price holding above the key moving zone. This looks more like co
NIGHT17.23%
- Reward
- like
- Comment
- Repost
- Share
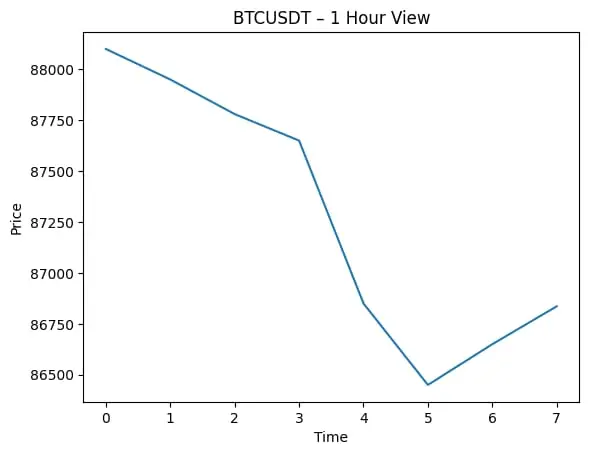
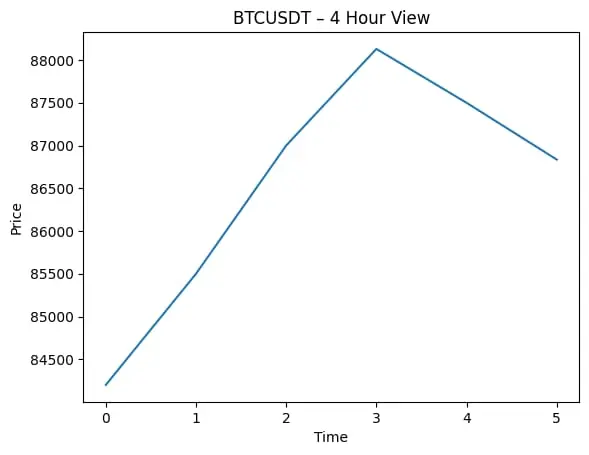
$BTC BTCUSDT Market View | Short-Term Outlook
BTCUSDT is currently trading near 86.8K after a sharp pullback from the recent high. Price reacted well from the intraday low, showing buyers are still active at lower levels.
1 Hour View On the 1H chart, BTC shows a quick sell-off followed by a mild bounce. Momentum is still weak, but the selling pressure looks slower now. If price holds above the recent low zone, a short relief move is possible.
4 Hour View The 4H structure remains healthy overall. The move looks like a normal correction after a strong upside push. As long as price stays above
BTC0.84%
- Reward
- like
- Comment
- Repost
- Share
$XRP XRP/USDT Market View
XRP is showing signs of recovery after a recent pullback. The price bounced from the lower zone and is now trying to move higher, but the market still needs confirmation before calling it a strong trend change.
1 Hour view
On the 1H timeframe, XRP has formed a short-term base and pushed upward with better momentum. Buyers are active, but price is still facing nearby resistance. A healthy hold above this zone can lead to a continuation toward the recent intraday highs. Weak follow-through could result in short consolidation.
4 Hour view
On the 4H chart, the broader t
XRP0.15%
- Reward
- like
- Comment
- Repost
- Share
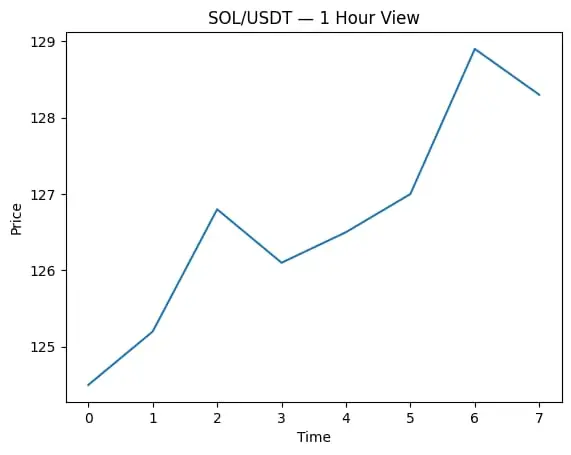
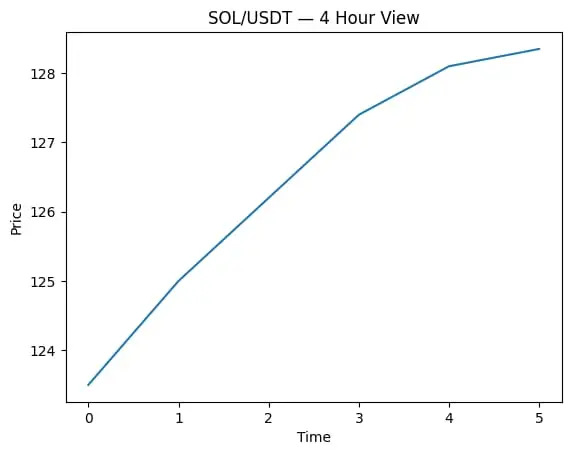
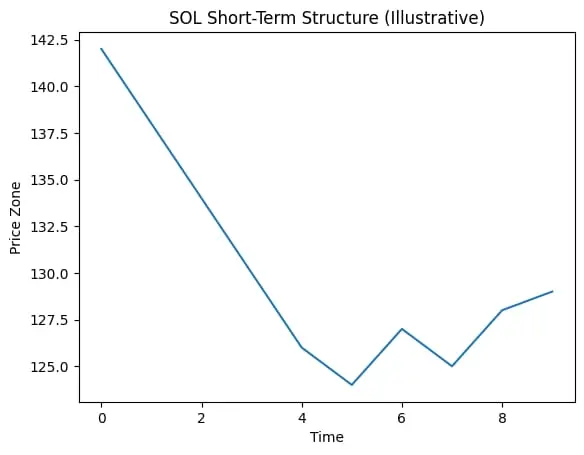
$SOL SOL/USDT Market View
SOL is currently consolidating after a strong bounce from the recent low. Price faced rejection near the upper zone and is now cooling down, which looks like a healthy pause rather than weakness.
1 Hour view
Short-term momentum is slowing.
Price is holding above recent support.
A small pullback or sideways move is possible before the next decision.
4 Hour view
Structure still looks stable.
Higher low formation keeps the bullish bias alive.
If support holds, price may attempt another push upward.
Loss of support could lead to a deeper correction.
Overall, SOL is at a
SOL1.52%
- Reward
- like
- Comment
- Repost
- Share
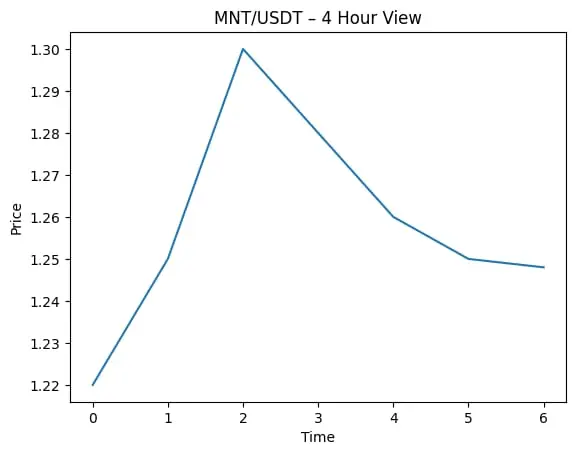
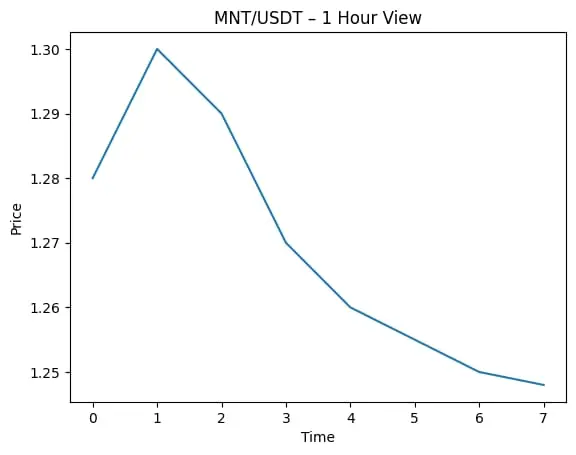
MNT/USDT Market View
MNT/USDT has seen a healthy pullback after the recent move up and is now trying to stabilize. Price is cooling off, which looks more like a reset than a breakdown.
1 Hour view:
On the 1H timeframe, price is moving in a short-term downward channel after rejection from the recent high. Selling pressure is slowing, and the market is trying to form a base. If buyers defend this zone, a small rebound toward the previous intraday range is possible. Losing this level may bring one more dip before any bounce.
4 Hour view:
On the 4H chart, momentum has weakened, but the structure i
MNT2.4%
- Reward
- like
- Comment
- Repost
- Share
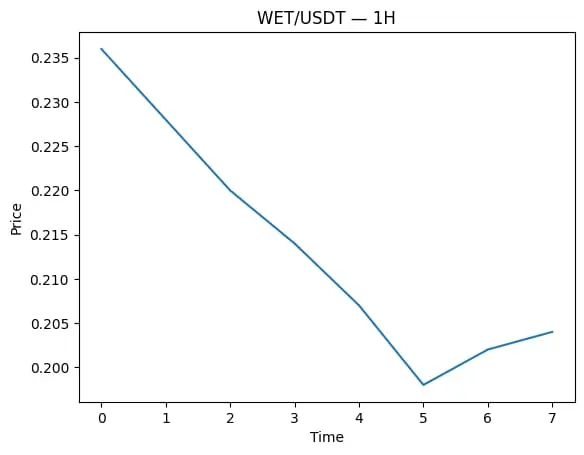
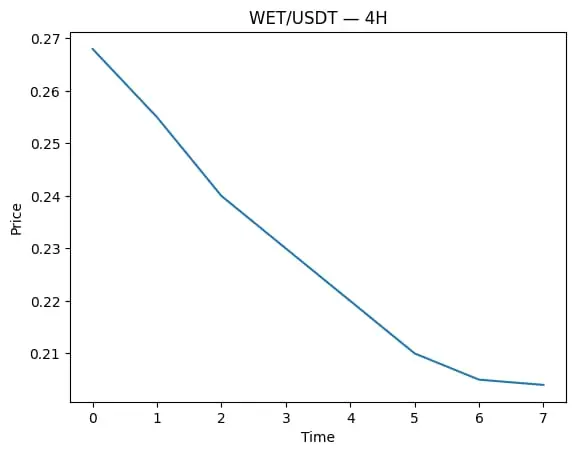
$WET WET/USDT Market View
Price has taken a strong pullback and is now trying to stabilize after heavy selling pressure. The recent drop looks more like a cooling phase than panic, and the market is starting to search for a short-term base.
1 Hour view On the 1H timeframe, price is moving sideways after the drop. Selling pressure is slowing down, which often hints at a short relief bounce. If buyers step in, a small recovery toward the recent intraday range is possible. Failure to hold this zone may lead to another short dip before any real bounce.
4 Hour view On the 4H chart, the trend is s
WET2.06%
- Reward
- like
- Comment
- Repost
- Share
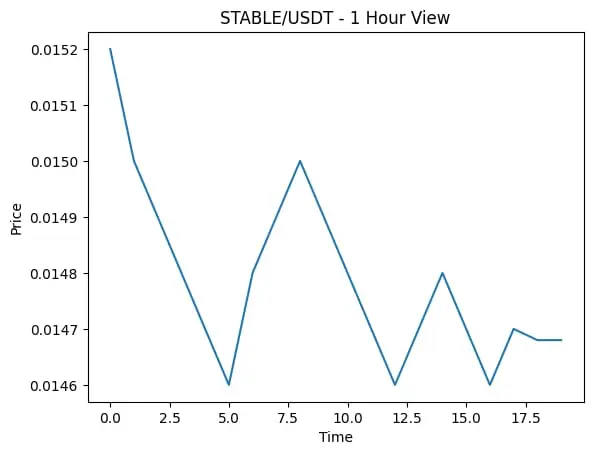
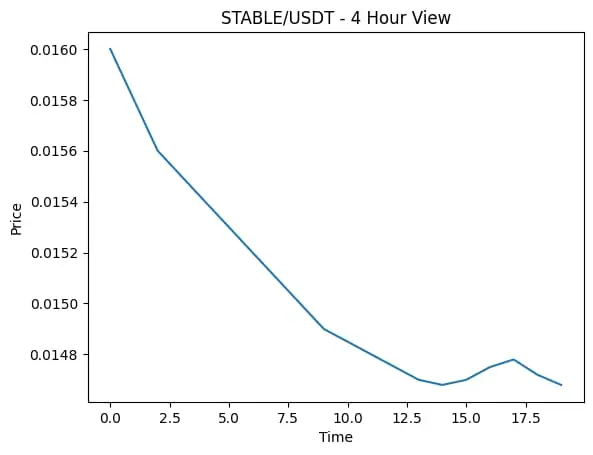
$STABLE STABLE/USDT Market View
STABLE is moving in a tight range after rejecting the recent high. Price is cooling down, but it’s still holding above a key short-term support zone. This area is important for the next direction.
1 Hour view
Short-term pullback after rejection
Selling pressure is easing near support
A small bounce is possible if buyers defend this zone
Losing support may bring another slow dip
4 Hour view
Overall structure looks neutral to slightly weak
Price is still inside a range, no clear trend yet
Consolidation here could build a base for the next move
Trend turns positi
STABLE-7%
- Reward
- 1
- Comment
- Repost
- Share
$NIGHT NIGHT/USDT Market View
NIGHT is under short-term pressure after a sharp pullback, but price is now trying to stabilize near a key demand zone. Sellers are slowing down, and this area could decide the next move.
1 Hour view
Strong sell-off already happened
Price is holding near recent lows
If buyers step in, a short relief bounce is possible
Loss of this level may bring another small dip
4 Hour view
Overall structure still weak
Trend remains bearish until price reclaims higher resistance
Sideways consolidation here can build a base for recovery
Trend change needs clear higher highs
Thi
NIGHT17.23%
- Reward
- 1
- Comment
- Repost
- Share
$BTC BTC Market Update (Personal View)
BTC is showing a short-term recovery after the recent pullback. Price bounced well from the lower zone and is now trying to stabilize. Sellers are still active, but panic pressure looks reduced.
1H view
Short-term bounce from the local low
Price trying to hold above intraday support
Small pullbacks are possible before the next move
4H view
Overall structure still healthy
Pullback looks corrective, not a breakdown
As long as higher support holds, trend remains intact
Outlook In the near term, BTC may consolidate and test nearby resistance again. On the h
BTC0.84%
- Reward
- like
- Comment
- Repost
- Share
$SOL Price is trying to stabilize after a sharp pullback. The recent drop found support near the lower zone, and now we’re seeing small higher lows. That usually tells me sellers are slowing down, not fully gone, but less aggressive.
What the indicators hint
Short timeframe (1H–4H): Momentum is slowly recovering. RSI is climbing from oversold areas, showing buyers are stepping back in.
Mid timeframe: Price is still below the strong resistance zone, so upside may come in steps, not a straight line.
Volume: No big spike yet, which means this move looks more like a cautious rebound, not hype.
F
SOL1.52%
- Reward
- like
- Comment
- Repost
- Share
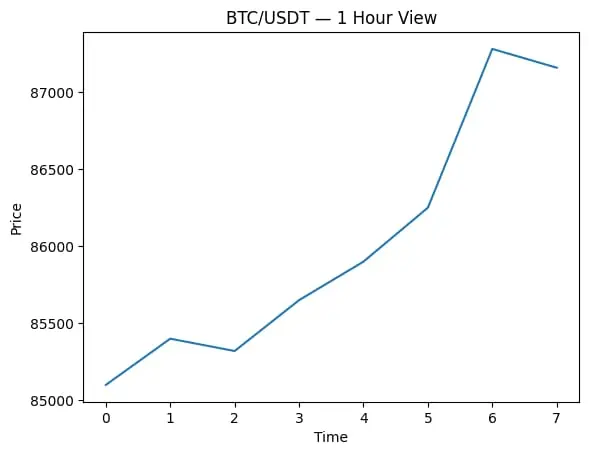
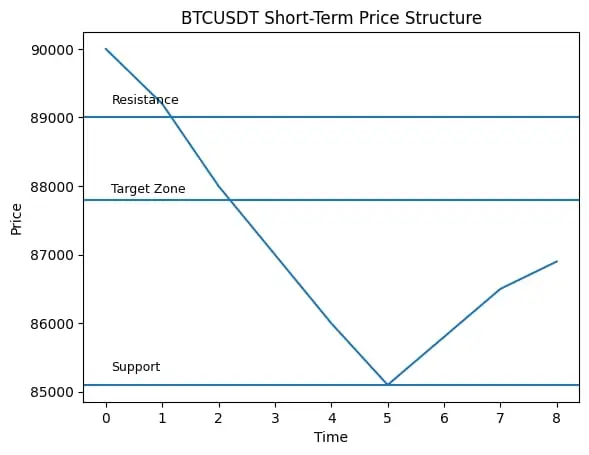
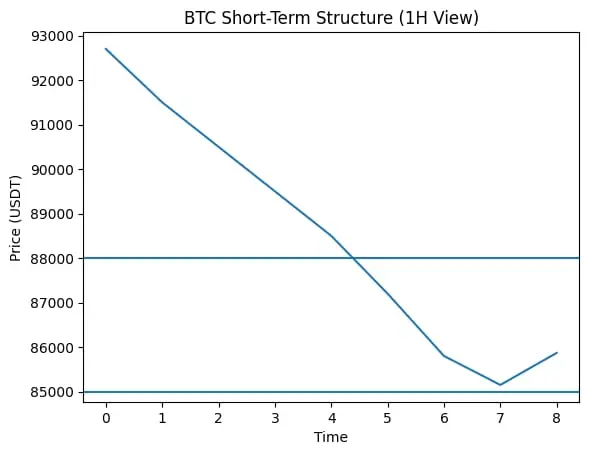
$BTC BTC saw a strong drop and bounced from the 85,100 area. That zone is acting like short-term support for now. On the 1H chart, price is trying to recover above local moving averages, but momentum is still mixed.
What I see:
Short timeframe shows a relief bounce
RSI is rising, but not overheated yet
MACD is improving, still below zero → recovery, not full reversal
Volume is okay, not aggressive
Possible scenarios:
1H–4H: If price holds above 85,800, we may see a push toward 87,800 – 88,500
Failure case: Losing 85,100 again could bring another test of lower levels
Higher timeframe: Trend i
BTC0.84%
- Reward
- 1
- Comment
- Repost
- Share
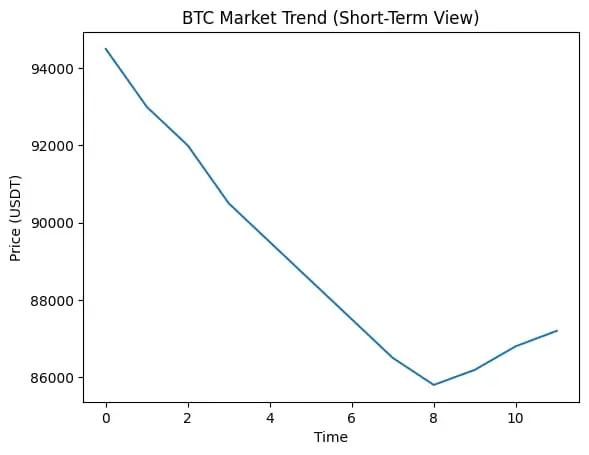
$BTC BTC recently moved down from the upper range and found support near 85.1k. After that drop, price is trying to stabilize around 86k, which shows sellers are slowing down and buyers are stepping in carefully.
What the chart is saying
Short-term trend is still weak, but the sharp selling pressure has cooled.
Moving averages are close to each other, which often means the market is preparing for a decision.
Momentum indicators are coming up from low levels, hinting at a possible short bounce.
Future view by timeframe
Short term: A sideways to slow recovery is possible as long as price holds
BTC0.84%
- Reward
- like
- Comment
- Repost
- Share
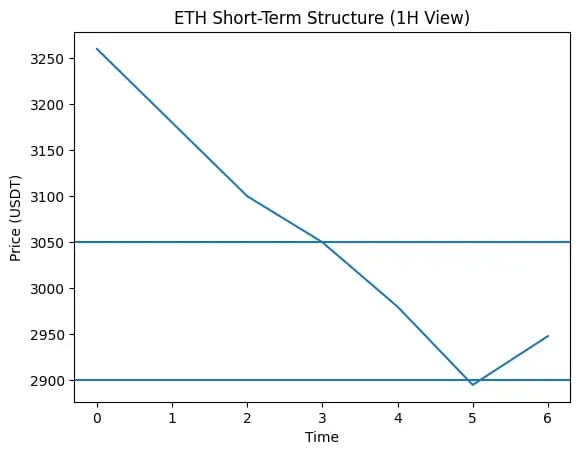
$ETH ETH saw a fast sell-off and bounced from the 2.89k area, which looks like short-term support. The reaction was quick, but overall pressure is still there.
What I see
1H timeframe: Price is below short MAs → trend is still weak.
Momentum: RSI dipped into oversold and is trying to recover → relief bounce makes sense.
Support: 2.9k zone is important. Holding above it keeps ETH stable.
Resistance: 3.05k–3.10k area. A break above this zone can shift momentum.
Next moves (opinion)
Short term: Sideways or slow bounce toward 3.05k.
If 2.9k fails: More downside pressure possible.
Higher timefram
ETH0.65%
- Reward
- like
- Comment
- Repost
- Share
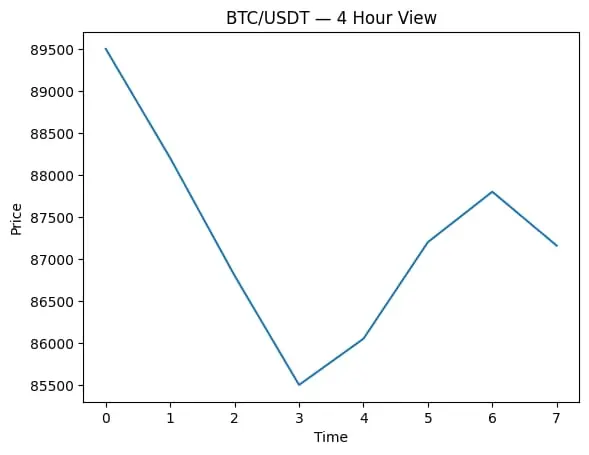
$BTC BTC saw a sharp drop and is now trying to stabilize around the 85.8k zone. Selling pressure was strong, but the bounce from the recent low shows buyers are still active.
What the chart says
1H timeframe: Trend is still weak, price below short MAs → pressure remains.
Momentum: RSI was deeply oversold, now cooling down → small relief bounce is normal.
Key support: 85k area. As long as this holds, downside slows.
Key resistance: 88k–89k zone. Bulls need a clean break to regain strength.
Possible moves
Short term: Sideways to mild bounce toward 88k if support holds.
If 85k breaks: Next drop
BTC0.84%
- Reward
- like
- Comment
- Repost
- Share
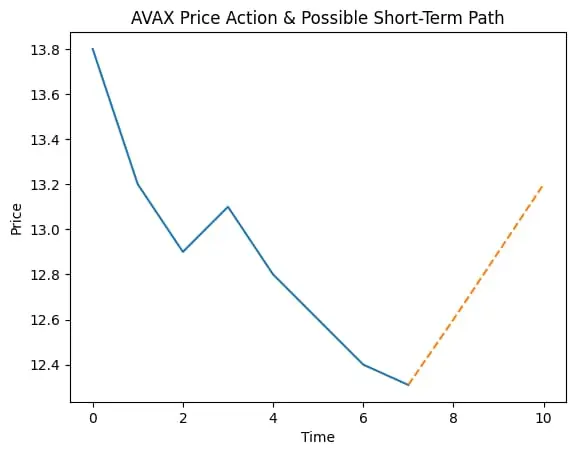
$AVAX AVAX just made a sharp drop toward the 12.3 zone. The fall was fast, and momentum indicators are stretched, which usually means sellers are getting tired.
What I see on the chart
1H timeframe: Strong sell-off, RSI deep oversold → bounce setup.
Momentum (MACD & KDJ): Still bearish, but downside speed is slowing.
Volume: Spike on the drop = emotional selling, often near short-term support.
Possible path
Short term: Relief bounce toward 12.8 – 13.2 if support holds.
Mid term: Holding above 12.3 keeps recovery chances alive.
Risk: Clean break below 12.3 may invite more downside.
Just a per
AVAX1.4%
- Reward
- like
- Comment
- Repost
- Share