惜惜养家特狼惜
廢話不多說,13-24點直播時間,能不能進步看你們自己
惜惜养家特狼惜
Don't Even Think About Buying the Dip, Continuous Washout in Progress, More Shaking Still to Come
Short-term Chart Signals
• Price Level: Currently around 2063, steadily holding above the EMA5/10/30/60 moving averages, short-term bullish trend is fully charged
• Bollinger Bands: Price hugging the upper band, strong recovery signal obvious, giving the market battered by the decline a chance to catch its breath
• MACD: DIF crossing above DEA, red columns continuously expanding, golden cross confirmed, bullish momentum is releasing
• KDJ/RSI: Indicators lean bullish but not yet at extreme overbou
ETH2.83%
- 打賞
- 5
- 留言
- 轉發
- 分享
本想着1970空單直接拿到破1900,奈何天公不作美,大V反轉了,多軍頭還是有點鐵的,守住二餅最後防線1930,早上7.50單子策略,二餅站穩1930直接多單進場,在1930下方觀望不動等待1860位置多單進場,進場策略已通知,各位老鐵自己把握分寸,下午直播時間13點不見不散
查看原文- 打賞
- 3
- 留言
- 轉發
- 分享
阔別已久,期待再次相逢,時隔半年,再回來不知是否还能像當年一样風采依旧,很想也更懷念當時的我們,我可能要回來了,每當自己迷茫的時候,都会回来看看,这里才是我的避風港,才能让我心安,曾经的冷惜回来了,但是会以一个全新的身份出现,愿新的一年:心存暖意,不畏世事霜寒;眼含珍惜,不負流年深情。曾经的冷惜,现在和以后的暖惜。
查看原文- 打賞
- 按讚
- 3
- 轉發
- 分享
多多的U :
:
惜惜回歸了🤗查看更多
參與賽馬猜測,完成任務獲取賽馬券,每日開啟百萬紅包雨,瓜分 100,000 USDT 獎池,盡在 Gate 2026 春節慶典。 https://www.gate.com/competition/year-of-horse-2026?ref_type=165&utm_cmp=7EQB9Jba&ref=XXCBYJTD
查看原文
- 打賞
- 2
- 留言
- 轉發
- 分享
- 打賞
- 2
- 留言
- 轉發
- 分享
#十二月行情展望 #广场发帖领$50 當你三十歲的時候,去買十八歲的東西,去二十歲想去的地方,已經毫無意義。世界上沒有那麼多的來日方長,只有世事無常,欲買桂花同載酒,終不似少年遊,你一生追求的東西一開始就在,只是你後知後覺而已,人無法同時擁有青春和對青春的感受,有些東西要靠消失才能證明他的珍貴。小學一走,就是一天,初中一走就是一週,高中一走,就是半月,大學一走就是半年,工作一走就是一年,這次牛市一走就是四年,年少時春風得意馬蹄疾,不信人間有別離,小時候不理解老人為什麼總是在門口靜靜的坐著,一坐就是半天,只有長大後才明白,目之所及,皆是回憶。心之所想皆是過往。眼之所看,皆是遺憾。別等兩千的時候後悔四千九沒抄頂,也別等四千七再去回頭看一千三沒抄底。這次給足面子和機會了,感謝美國感謝特朗普感謝大門,財富自由的大門一直為各位打開,通往財富路上的密碼一直就在自己手中,各位把握好了,接下來看好表演了。#成长值抽奖赢iPhone17和周边
查看原文12月8日周一早上8點以太坊會在什麼價位
2900以下
3
3
3100以上
6
6
9人參與投票已結束
- 打賞
- 4
- 2
- 轉發
- 分享
钱途向前看:
惜惜歸來查看更多
姨媽司令
查看原文【當前用戶分享了他的交易卡片,若想瞭解更多優質交易資訊,請到 App 版查看】
- 打賞
- 按讚
- 1
- 轉發
- 分享
瘦瘦的韭菜:
不播了嗎#加密市场反弹 #ETH 热浪战队争霸赛来袭 空軍司令部全體集合,https://www.gate.com/activities/crypto-league/perps/?ch=teambattle&invite=1&teamId=10337&now_period=24&refUid=18437487
點擊連結加入戰隊一起幹姨媽了,空單進場4355,止損4385左右,止盈4310左右,根據自己交易習慣設置好止損,上方強壓單太重,突破舉步維艱。
點擊連結加入戰隊一起幹姨媽了,空單進場4355,止損4385左右,止盈4310左右,根據自己交易習慣設置好止損,上方強壓單太重,突破舉步維艱。
ETH2.83%
- 打賞
- 按讚
- 留言
- 轉發
- 分享
#加密市场反弹 #ETH 热浪战队争霸赛来袭 空軍司令部全體集合,https://www.gate.com/activities/crypto-league/perps/?ch=teambattle&invite=1&teamId=10337&now_period=24&refUid=18437487
點擊連結加入戰隊一起幹姨媽了,多單抓緊時間進場,上方壓力4330,下方支撐4180。帶好止損,靈活操作。
點擊連結加入戰隊一起幹姨媽了,多單抓緊時間進場,上方壓力4330,下方支撐4180。帶好止損,靈活操作。
ETH2.83%
- 打賞
- 按讚
- 1
- 轉發
- 分享
惜惜养家特狼惜:
多單準備壓力位跑,止盈跑,抓緊時間- 打賞
- 1
- 1
- 轉發
- 分享
惜惜养家特狼惜:
https://www.gate.com/activities/crypto-league/perps/?ch=teambattle&invite=1&teamId=10337&now_period=24&refUid=18437487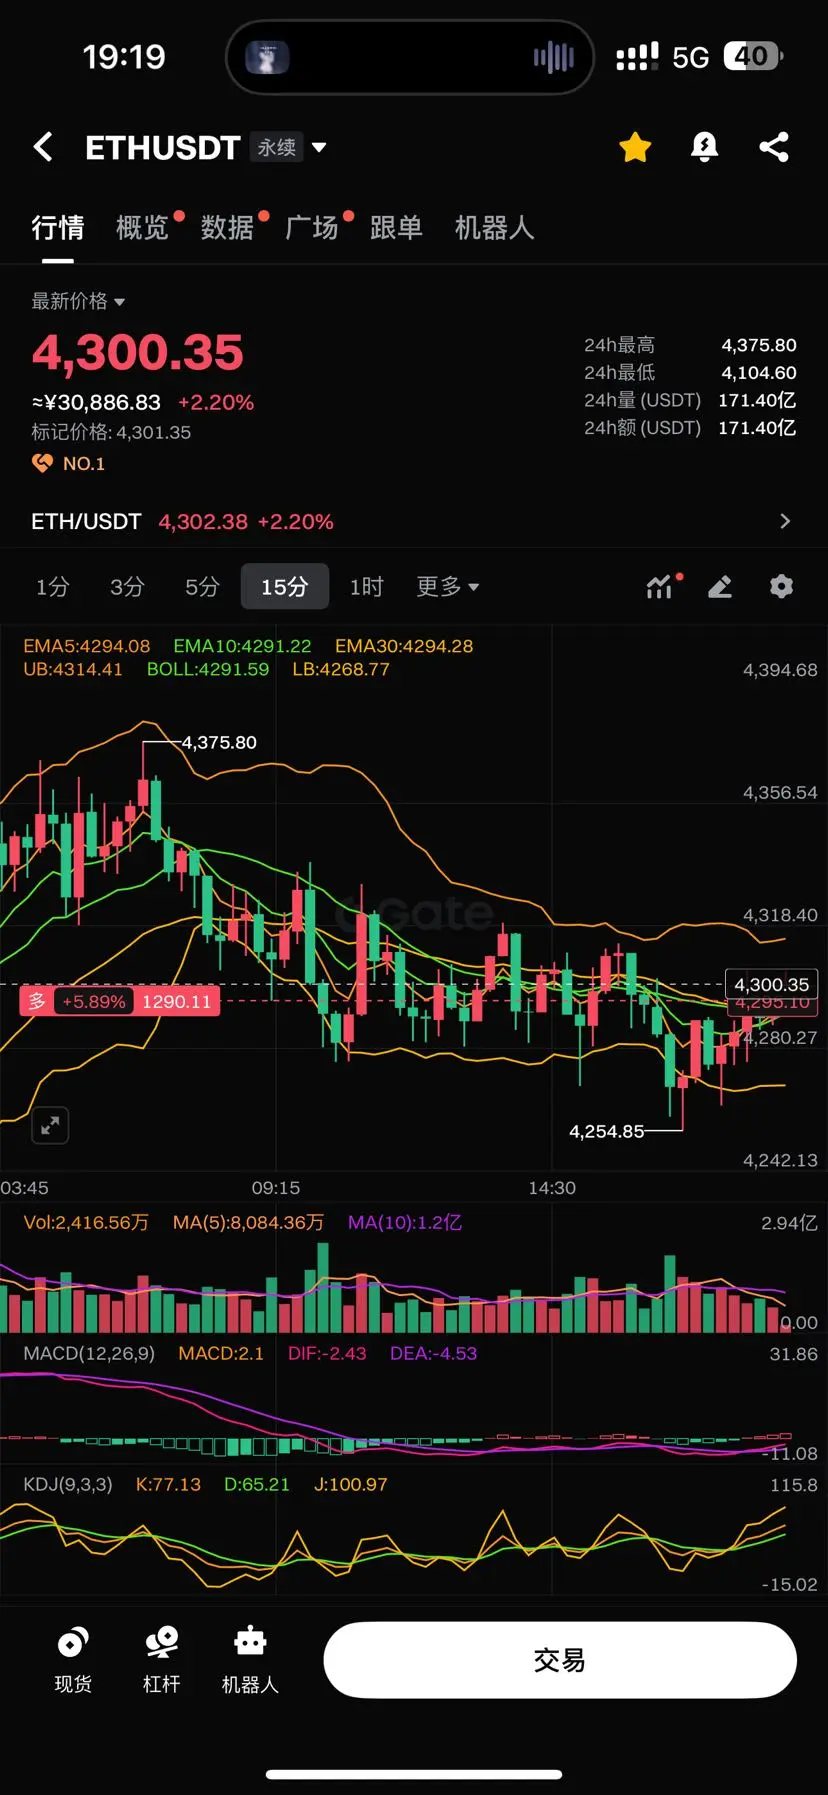
- 打賞
- 按讚
- 留言
- 轉發
- 分享
老鐵們,姨媽3650-3670空單可以進場,大餅115空單可以進場,晚上能看到效果,帶好2個倉位之內的止損,利潤三個倉位。
查看原文- 打賞
- 5
- 5
- 轉發
- 分享
人生如意:
日他大爺的以太拉這麼猛查看更多
熱門話題
查看更多1678.73萬 熱度
25.3萬 熱度
118.44萬 熱度
500.25萬 熱度
29.13萬 熱度
置頂
🍀 Spring Date with Fortune, Prizes with Raffle! Growth Value Phase 1️⃣ 7️⃣ Spring Raffle Carnival Begins!
Seize Spring's Good Luck! 👉 https://www.gate.com/activities/pointprize?now_period=17
🌟 How to Participate?
1️⃣ Enter [Square] personal homepage, click the points icon next to your avatar to enter [Community Center]
2️⃣ Complete Square or Hot Chat tasks such as posting, commenting, liking, speaking to earn growth value
🎁 Every 300 points can raffle once, 10g gold bars, Gate Red Bull gift box, VIP experience card and more prizes waiting for you to win!
Details 👉 https://www.gate.com/ann📢 Gate 廣場創作者衝榜火熱開啟!
發文贏獎勵,瓜分 1,500 USDT 總獎池 🔥
活動採用 曝光、互動、交易三重積分制——獲得更多曝光、贏得用戶互動、帶動真實交易,每一項都能為你累積積分,讓優質內容被看見、被獎勵。
✅ 總榜大獎:Top 10 創作者分享 1,050 USDT
✅ 新人 & 回歸激勵:5 位潛力作者各得 30 USDT
✅ 深度內容獎:6 篇優質長文各獲 50 USDT
📅 活動時間:3 月 19 日 - 4 月 4 日
📍 報名鏈接:https://www.gate.com/questionnaire/7494
📄 活動詳情:https://www.gate.com/zh/announcements/article/50265
原創內容、深度思考、真實互動——讓創作更有價值。
#Gate广场 #GateSquare #创作者冲榜 #内容挖矿福利加码,Gate 廣場明星帶單交易員三期招募開啟!
入駐發帖 · 瓜分 $30,000 月度獎池 & 千萬級流量扶持!
如何參與:
1️⃣ 報名成為跟單交易員:https://www.gate.com/copytrading/lead-trader-registration/futures
2️⃣ 報名活動:https://www.gate.com/questionnaire/7355
3️⃣ 入駐 Gate 廣場,持續發布交易相關原創內容
豐厚獎勵等你拿:
首發優質內容即得 $30 跟單體驗金
每雙周瓜分 $10,000U 內容獎池
Top 10 交易員額外瓜分 $20,000U 登榜獎池
精選帖推流、首頁推薦、周度明星交易員曝光
詳情:https://www.gate.com/announcements/article/50291🤖 尋找 Gate 廣場 AI 評測官!$50,000 懸賞令發布!
發帖聊 AI,獎金拿到手軟!新人首帖獎勵翻倍,單帖最高 200U!
📝 立即報名:https://www.gate.com/questionnaire/7477
1️⃣ 發帖得紅包,單帖最高 100U!
2️⃣ Top 體驗分享官:帶 #Gate广场AI测评官 聊技巧,贏國米球衣!
3️⃣ 收益率 PK 王:曬 AI 收益截圖,贏 Gate 定制運動套裝!
4️⃣ 深度好文額外加碼 30U 每篇張榜公布!
💬 來 Gate 廣場,把握行業新趨勢:https://www.gate.com/post
時間:3/12 18:00 – 3/27 24:00 (UTC+8)
詳情:https://www.gate.com/announcements/article/50206Gate 廣場內容挖礦獎勵繼續升級!無論您是創作者還是用戶,挖礦新人還是頭部作者都能贏取好禮獲得大獎。現在就進入廣場探索吧!
創作者享受最高60%創作返佣
創作者獎勵加碼1500USDT:更多新人作者能瓜分獎池!
觀眾點擊交易組件交易贏大禮!最高50GT等新春壕禮等你拿!
詳情:https://www.gate.com/announcements/article/49802