#CryptoMarketAnalysis
#Btc$BTC
Bitcoin (BTC) Current Analysis
1. Latest Price and Overall Situation
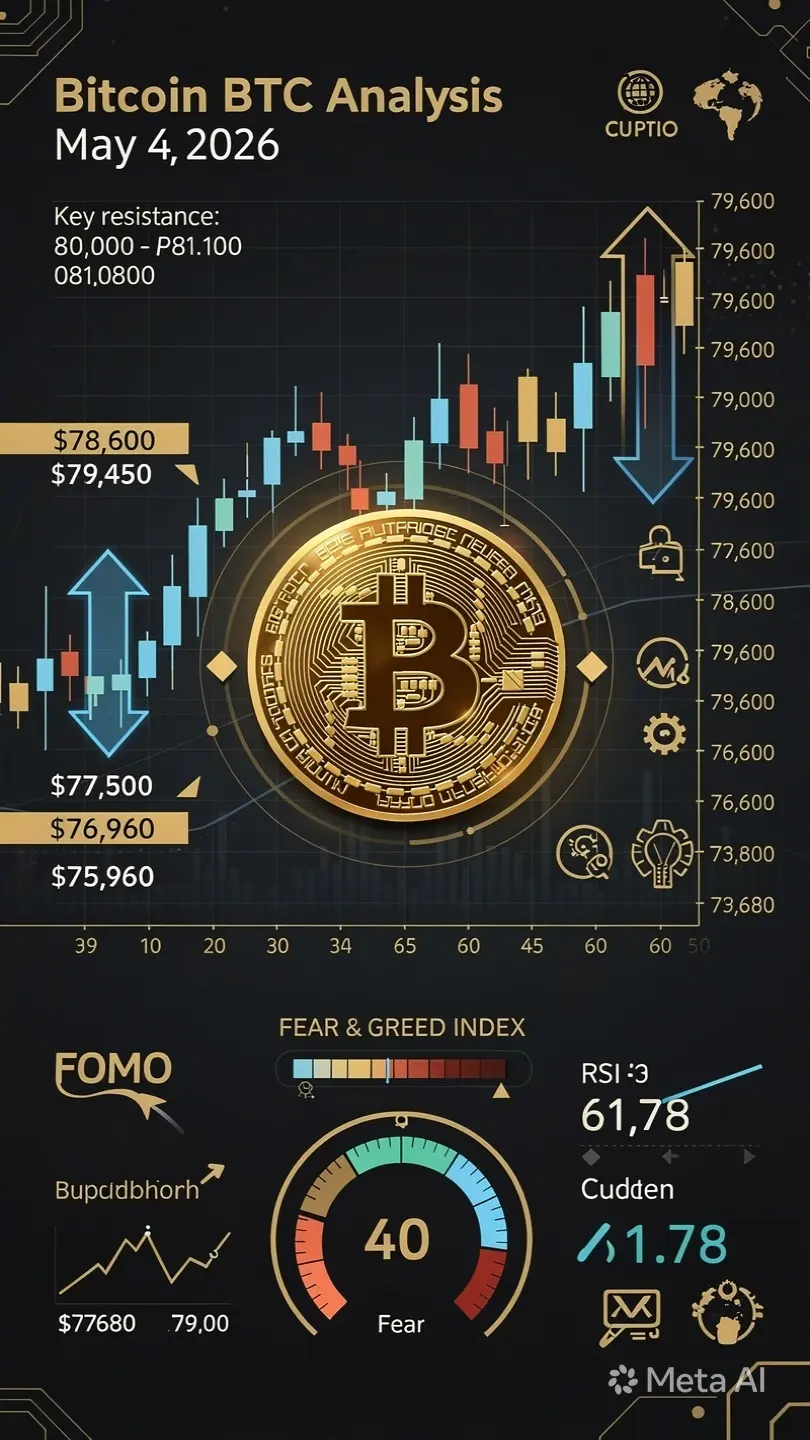
Bitcoin is currently trading in the 79,000 to 79,600 USD range. The most recent data shows 79,599.45 USD.
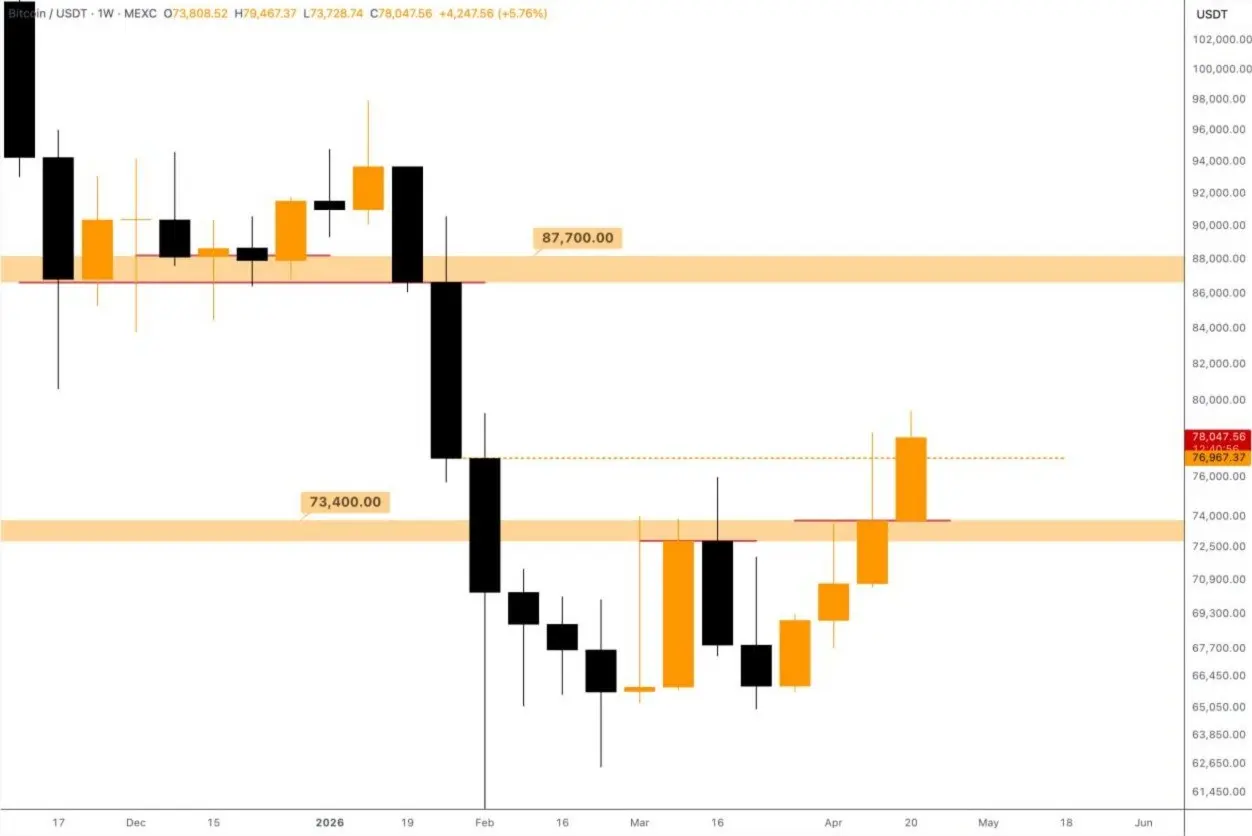
It closed April with an 11.87% gain, which was the strongest monthly performance in the past year. After correcting from the 93,000 to 96,000 USD area in January, BTC dropped into the 60,000 to 70,000 USD range. It has since recovered most of the decline caused by war panic related to Iran.
Short-term sentiment: The Fear & Greed Index is at 40, which is in the “Fear” zone. So the market is cautious, but there were 18 green days out of the last 30, or 60%. The 14-day RSI is 61.78, which is neutral.
2. Key Support and Resistance Zones
Resistances:
• 78,600 USD: Weekly opening level. It was rejected clearly on the 4-hour chart and is the most important short-term resistance for now. • 79,450 USD: Previous week’s and Monday’s high. A 4-hour close above this level would accelerate momentum. • 80,000 to 81,000 USD: Psychological level plus the cost basis zone for short-term investors. Brazilian analyst Vinícius Bazan notes that this area overlaps with the “bull market support band,” forming a cluster of four resistances together with the EMA-100 at around 82,500 and the ETF investor cost at around 83,500. • 89,000 to 95,000 USD: Medium-term target zone. In prediction markets, the expectation for the 2026 peak is centered around 95,000 USD. Elliott wave analysts also point to 89,000 to 90,000 as the wave 3 target.
Supports:
• 77,500 USD: Lower boundary of the 4-hour range. If this breaks, selling could deepen. • 76,600 USD: Previous Monday low. • 75,960 USD: Last month’s peak, now acting as support. • 73,680 USD: Last week’s low, a strong buyer area. • 60,000 USD: Major failure point. A move below this level would signal a trend breakdown for both spot and futures.
The 50-day SMA is around 84,000 USD and the 200-day SMA is around 97,000 USD. Price is below the 50-day but far from the 200-day. This shows that we are still in a medium-term correction.
3. Investor Psychology and Market Behavior
Three main emotions dominate:
1. Regret mixed with FOMO: Those who sold at 63,000 during the war scare are seeing “I wish I hadn’t sold” sentiment return. As price nears 80,000, the “I missed the train” feeling increases. 2. Cautious optimism: Institutions are highlighting data showing that in 7 out of 7 geopolitical crises, BTC posted positive returns 60 days later, averaging +18%. This “safe-haven” narrative is getting stronger. 3. Skepticism: Analyst Matthew Hyland says April’s 13% rally came with “weak enthusiasm” and he expects a deeper low by October. Comments like “pyramid” and “sell in May and go away” are also circulating on social media.
What is smart money doing?
• Prediction markets are pointing to 95,000. • New buying from Michael Saylor has slowed, but ETFs and short-term holders are active. • There is talk that Charles Schwab is recommending an 8% BTC allocation to clients.
4. Six Points to Pay Attention To
First, the 4-hour close above 78,600. A range breakout would trigger a test of 80,000. Do not chase longs without confirmation because fakeout risk is high.
Second, macro risks. The Iran tension seems to have eased, but new geopolitical headlines still move BTC. Use stop-losses to protect against sudden news-driven wicks.
Third, liquidity trap. Four resistances are stacked between 80,000 and 83,000. Whales could use this area to take profit. Take profit gradually and do not try to sell everything at the top.
Fourth, volatility. It is at 4.49%, which is moderate, but 3% to 4% wicks on the 4-hour chart are normal. If you use leverage, keep wider margins.
Fifth, cycle psychology. The narrative that “the market wants to exhaust you” is common. Panic comes to those without a plan. Write down your buy and sell plan and stick to it.
Sixth, regulation. There is a 35% probability priced in for a U.S. market structure law before 2027. Positive news can act as rocket fuel, while negative news can trigger sharp selling. Watch the calendar.
5. Scenarios
Bullish scenario: A 4-hour close above 78,600, then the 80,000 psychological level breaks. Next, 82,500 EMA-100 and 83,500 ETF cost are tested. With volume, the 89,000 to 95,000 band could be on the table within 2 to 3 months.
Bearish scenario: The 78,600 resistance holds and 77,500 support breaks. That opens a move toward 75,900 and 73,600. Closes below 60,000 would be a “bull is over” signal. There is risk of a deeper low into October.
Sideways scenario: Tight range between 77,500 and 78,600. If volume drops during the summer, the “boring market” perception increases. These periods are often when large players accumulate.
6. Summary of Strategy Logic
1. For spot investors: The 73,000 to 76,000 support area makes sense for gradual buying. Taking 10% to 20% profit on every green candle above 80,000 is a solid approach. Do not put all your capital at one resistance. 2. For traders: Above 78,600 with a 4-hour close, you can target 80,000 to 82,500 with a stop at 77,400. If it gets rejected, shorting below 77,500 can be considered, but remember 73,600 is strong support. 3. Psychology: The market is in a “wearing you out” phase. Without a plan, you get shaken out. Trade based on levels, not FOMO. 4. News tracking: The Bitcoin 2026 conference, Strategic Bitcoin Reserve announcements, and the U.S. regulatory calendar will increase volatility.
Remember: This is not investment advice. Crypto involves high risk, so only trade with money you can afford to lose.
The level to watch: 78,600. Above it, bulls take control. Below it, bears start the match.
#GateSquare #CreatorCarnival
#GateSquareMayTradingShare $BTC $BTC
#Btc$BTC
Bitcoin (BTC) Current Analysis
1. Latest Price and Overall Situation
Bitcoin is currently trading in the 79,000 to 79,600 USD range. The most recent data shows 79,599.45 USD.
It closed April with an 11.87% gain, which was the strongest monthly performance in the past year. After correcting from the 93,000 to 96,000 USD area in January, BTC dropped into the 60,000 to 70,000 USD range. It has since recovered most of the decline caused by war panic related to Iran.
Short-term sentiment: The Fear & Greed Index is at 40, which is in the “Fear” zone. So the market is cautious, but there were 18 green days out of the last 30, or 60%. The 14-day RSI is 61.78, which is neutral.
2. Key Support and Resistance Zones
Resistances:
• 78,600 USD: Weekly opening level. It was rejected clearly on the 4-hour chart and is the most important short-term resistance for now. • 79,450 USD: Previous week’s and Monday’s high. A 4-hour close above this level would accelerate momentum. • 80,000 to 81,000 USD: Psychological level plus the cost basis zone for short-term investors. Brazilian analyst Vinícius Bazan notes that this area overlaps with the “bull market support band,” forming a cluster of four resistances together with the EMA-100 at around 82,500 and the ETF investor cost at around 83,500. • 89,000 to 95,000 USD: Medium-term target zone. In prediction markets, the expectation for the 2026 peak is centered around 95,000 USD. Elliott wave analysts also point to 89,000 to 90,000 as the wave 3 target.
Supports:
• 77,500 USD: Lower boundary of the 4-hour range. If this breaks, selling could deepen. • 76,600 USD: Previous Monday low. • 75,960 USD: Last month’s peak, now acting as support. • 73,680 USD: Last week’s low, a strong buyer area. • 60,000 USD: Major failure point. A move below this level would signal a trend breakdown for both spot and futures.
The 50-day SMA is around 84,000 USD and the 200-day SMA is around 97,000 USD. Price is below the 50-day but far from the 200-day. This shows that we are still in a medium-term correction.
3. Investor Psychology and Market Behavior
Three main emotions dominate:
1. Regret mixed with FOMO: Those who sold at 63,000 during the war scare are seeing “I wish I hadn’t sold” sentiment return. As price nears 80,000, the “I missed the train” feeling increases. 2. Cautious optimism: Institutions are highlighting data showing that in 7 out of 7 geopolitical crises, BTC posted positive returns 60 days later, averaging +18%. This “safe-haven” narrative is getting stronger. 3. Skepticism: Analyst Matthew Hyland says April’s 13% rally came with “weak enthusiasm” and he expects a deeper low by October. Comments like “pyramid” and “sell in May and go away” are also circulating on social media.
What is smart money doing?
• Prediction markets are pointing to 95,000. • New buying from Michael Saylor has slowed, but ETFs and short-term holders are active. • There is talk that Charles Schwab is recommending an 8% BTC allocation to clients.
4. Six Points to Pay Attention To
First, the 4-hour close above 78,600. A range breakout would trigger a test of 80,000. Do not chase longs without confirmation because fakeout risk is high.
Second, macro risks. The Iran tension seems to have eased, but new geopolitical headlines still move BTC. Use stop-losses to protect against sudden news-driven wicks.
Third, liquidity trap. Four resistances are stacked between 80,000 and 83,000. Whales could use this area to take profit. Take profit gradually and do not try to sell everything at the top.
Fourth, volatility. It is at 4.49%, which is moderate, but 3% to 4% wicks on the 4-hour chart are normal. If you use leverage, keep wider margins.
Fifth, cycle psychology. The narrative that “the market wants to exhaust you” is common. Panic comes to those without a plan. Write down your buy and sell plan and stick to it.
Sixth, regulation. There is a 35% probability priced in for a U.S. market structure law before 2027. Positive news can act as rocket fuel, while negative news can trigger sharp selling. Watch the calendar.
5. Scenarios
Bullish scenario: A 4-hour close above 78,600, then the 80,000 psychological level breaks. Next, 82,500 EMA-100 and 83,500 ETF cost are tested. With volume, the 89,000 to 95,000 band could be on the table within 2 to 3 months.
Bearish scenario: The 78,600 resistance holds and 77,500 support breaks. That opens a move toward 75,900 and 73,600. Closes below 60,000 would be a “bull is over” signal. There is risk of a deeper low into October.
Sideways scenario: Tight range between 77,500 and 78,600. If volume drops during the summer, the “boring market” perception increases. These periods are often when large players accumulate.
6. Summary of Strategy Logic
1. For spot investors: The 73,000 to 76,000 support area makes sense for gradual buying. Taking 10% to 20% profit on every green candle above 80,000 is a solid approach. Do not put all your capital at one resistance. 2. For traders: Above 78,600 with a 4-hour close, you can target 80,000 to 82,500 with a stop at 77,400. If it gets rejected, shorting below 77,500 can be considered, but remember 73,600 is strong support. 3. Psychology: The market is in a “wearing you out” phase. Without a plan, you get shaken out. Trade based on levels, not FOMO. 4. News tracking: The Bitcoin 2026 conference, Strategic Bitcoin Reserve announcements, and the U.S. regulatory calendar will increase volatility.
Remember: This is not investment advice. Crypto involves high risk, so only trade with money you can afford to lose.
The level to watch: 78,600. Above it, bulls take control. Below it, bears start the match.
#GateSquare #CreatorCarnival
#GateSquareMayTradingShare $BTC $BTC