#TreasuryYieldBreaks5PercentCryptoUnderPressure
The 30-Year Treasury Yield Just Hit 5% — Here's Why Crypto Is Feeling the Heat
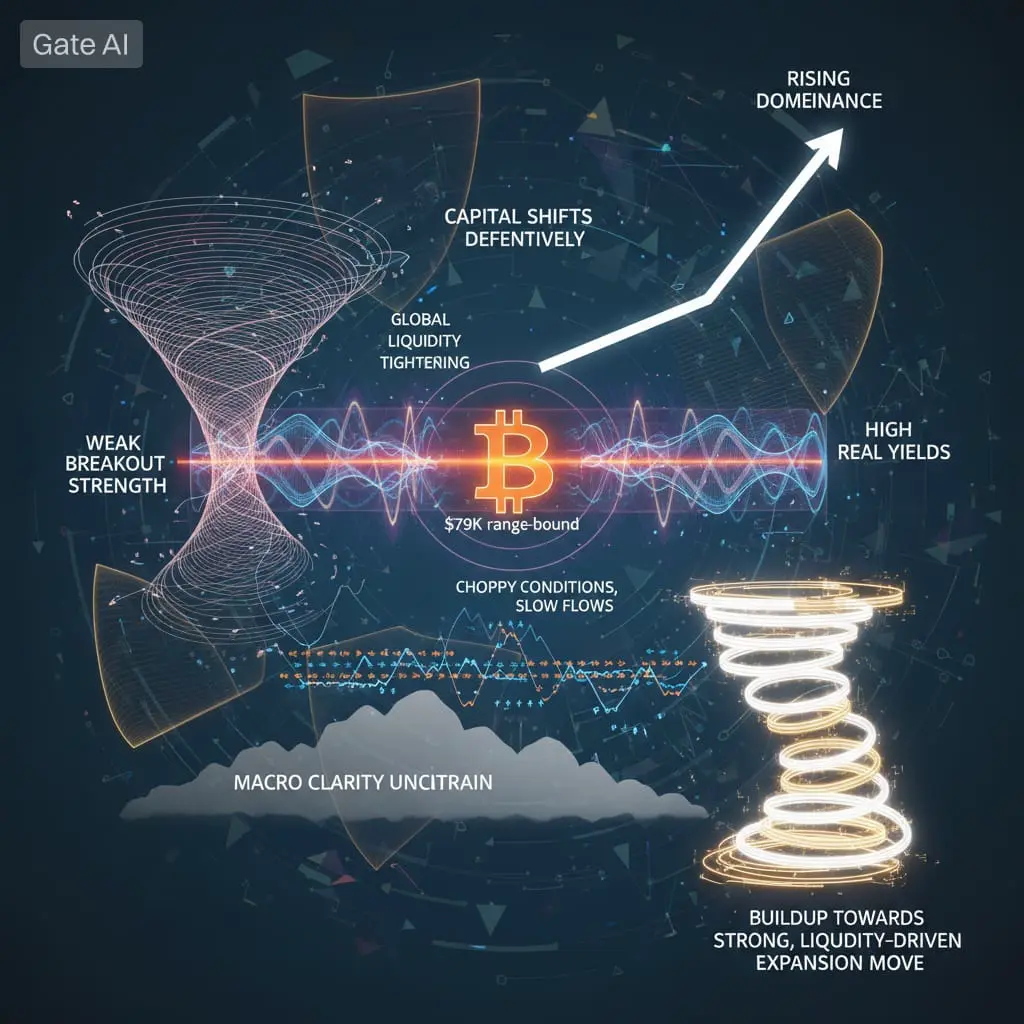
The U.S. 30-year Treasury yield crossed 5% this week, hitting its highest level since July 2025. For crypto, that's not just a number on a bond chart — it's a gravitational force pulling capital away from risk assets.
When a virtually risk-free government bond pays 5% over 30 years, every dollar sitting in BTC becomes a dollar that isn't earning that guaranteed return. Institutional managers are facing a straightforward question: why hold volatile digital assets when Treasuries offer this kind of yield?
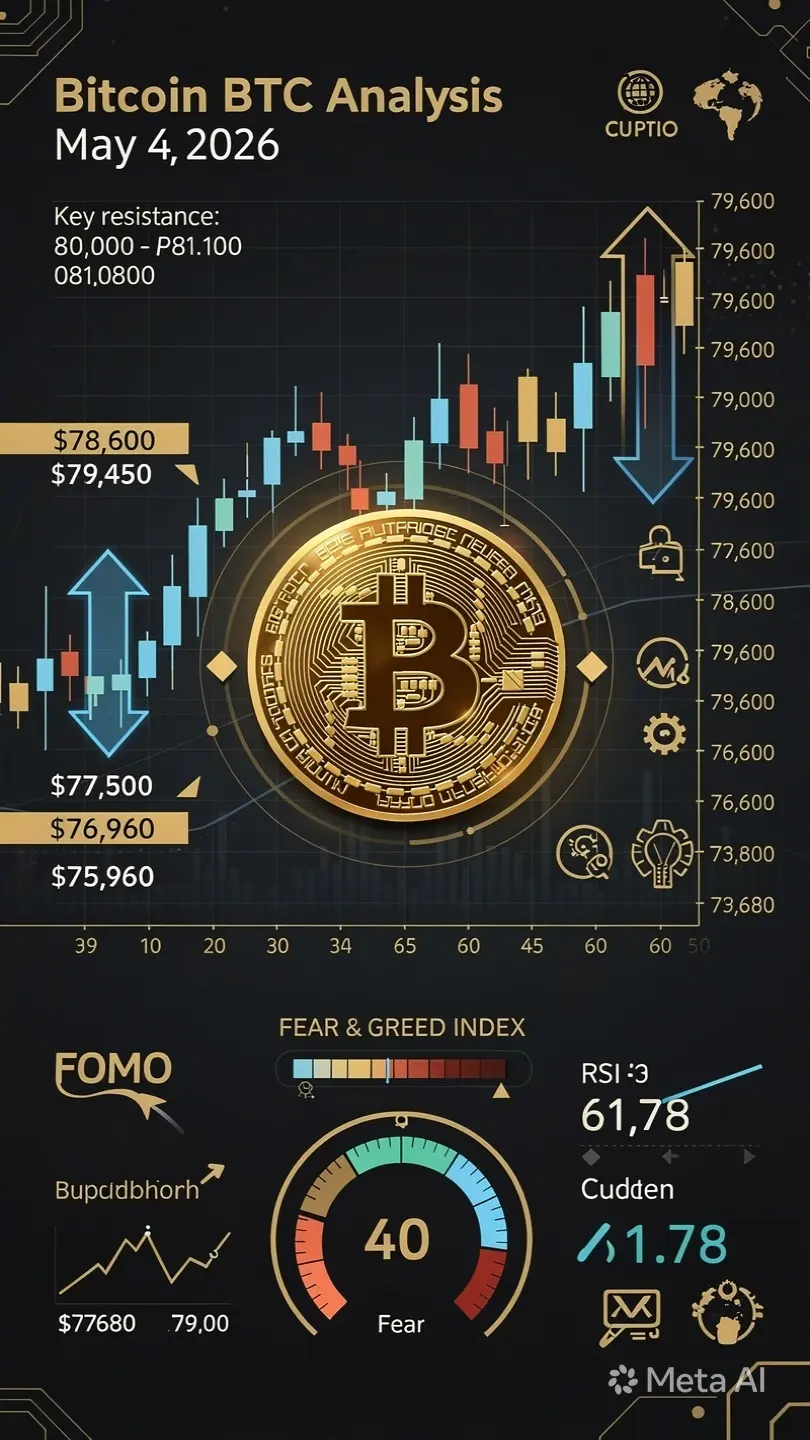
The impact is already visible. BTC dropped roughly 2% within hours of the 5% breach, sliding toward $75,700 before recovering to trade around $79,835 today. Its correlation with the S&P 500 surged to 0.96, meaning crypto is now moving almost in lockstep with equities — amplifying the same macro headwinds that are pressuring tech stocks.
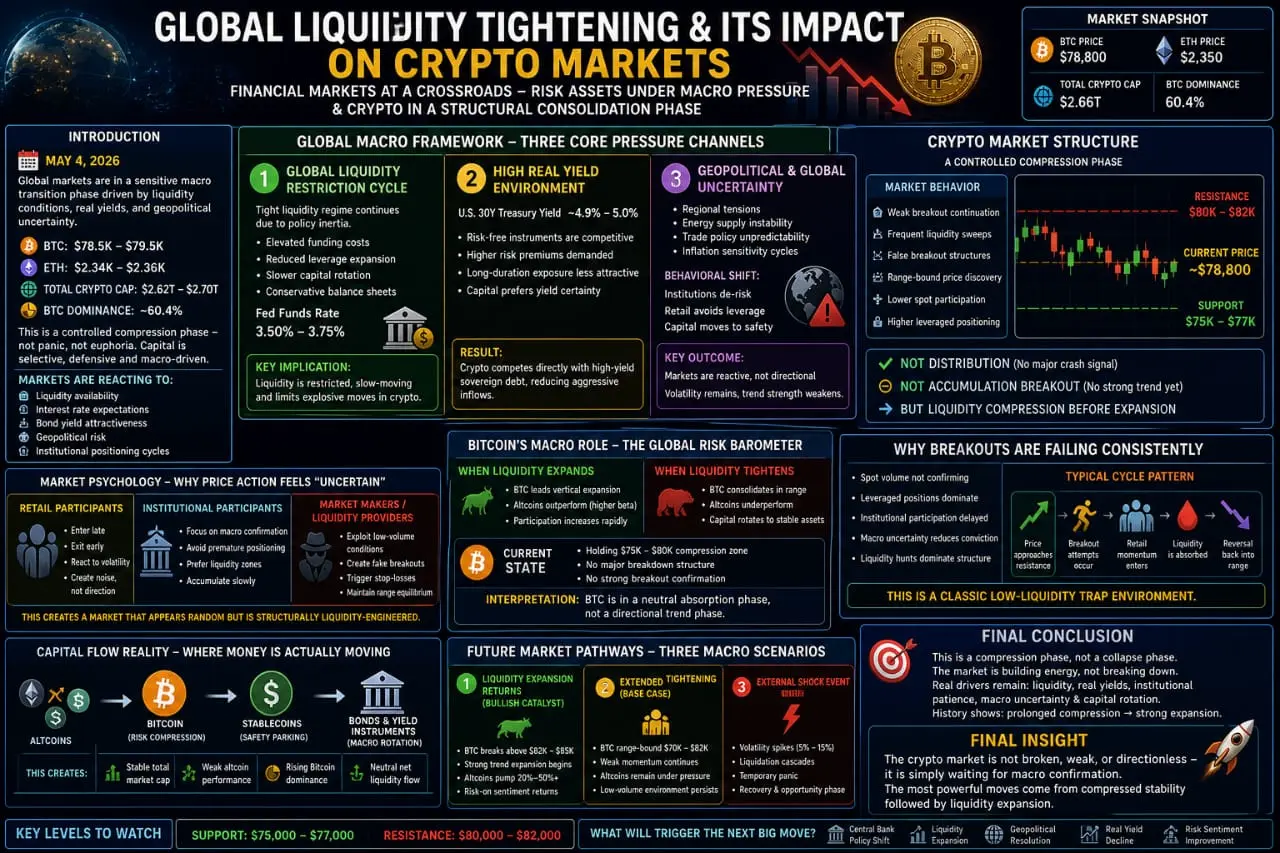
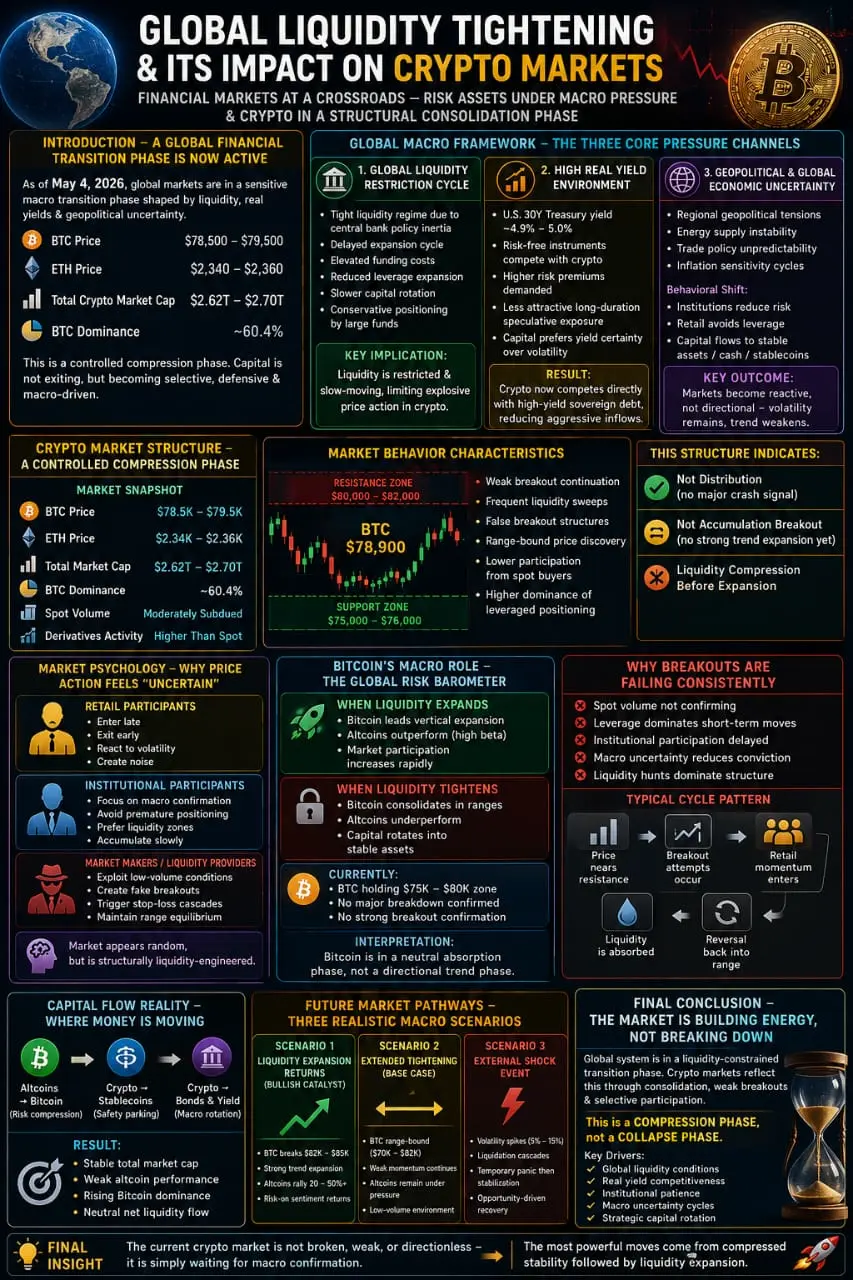
What's driving yields higher? Three forces are converging: hawkish dissent within the Federal Reserve, elevated oil prices feeding into long-term inflation expectations, and a global trend — U.K. and other sovereign bond yields are climbing too. Incoming Fed Chair Kevin Warsh's tighter monetary policy stance adds another layer of pressure.
But here's the nuance: this isn't necessarily a death sentence for crypto. The same institutional players rotating into bonds — Franklin Templeton, MoonPay — are simultaneously expanding their digital asset strategies. And the White House's top crypto adviser has signaled that the long-awaited market structure bill could advance this month, potentially unlocking billions in sidelined institutional capital.
The bottom line? In the short term, 5% Treasuries are a formidable competitor for capital. But the structural drivers behind crypto adoption — regulatory clarity, institutional infrastructure, and global de-dollarization trends — haven't disappeared. The question isn't whether yields will pressure crypto (they already are); it's whether the crypto ecosystem can deliver enough upside to justify the risk premium over a "safe" 5%.
Key numbers:
30-year Treasury yield: 5.004% (highest since July 2025)
BTC 24h change: +1.68%, trading at ~$79,835
BTC–S&P 500 correlation: 0.96
10-year Treasury yield: 4.39%
@Gate_Square@Gate广场_Official#gatesquare
The 30-Year Treasury Yield Just Hit 5% — Here's Why Crypto Is Feeling the Heat
The U.S. 30-year Treasury yield crossed 5% this week, hitting its highest level since July 2025. For crypto, that's not just a number on a bond chart — it's a gravitational force pulling capital away from risk assets.
When a virtually risk-free government bond pays 5% over 30 years, every dollar sitting in BTC becomes a dollar that isn't earning that guaranteed return. Institutional managers are facing a straightforward question: why hold volatile digital assets when Treasuries offer this kind of yield?
The impact is already visible. BTC dropped roughly 2% within hours of the 5% breach, sliding toward $75,700 before recovering to trade around $79,835 today. Its correlation with the S&P 500 surged to 0.96, meaning crypto is now moving almost in lockstep with equities — amplifying the same macro headwinds that are pressuring tech stocks.
What's driving yields higher? Three forces are converging: hawkish dissent within the Federal Reserve, elevated oil prices feeding into long-term inflation expectations, and a global trend — U.K. and other sovereign bond yields are climbing too. Incoming Fed Chair Kevin Warsh's tighter monetary policy stance adds another layer of pressure.
But here's the nuance: this isn't necessarily a death sentence for crypto. The same institutional players rotating into bonds — Franklin Templeton, MoonPay — are simultaneously expanding their digital asset strategies. And the White House's top crypto adviser has signaled that the long-awaited market structure bill could advance this month, potentially unlocking billions in sidelined institutional capital.
The bottom line? In the short term, 5% Treasuries are a formidable competitor for capital. But the structural drivers behind crypto adoption — regulatory clarity, institutional infrastructure, and global de-dollarization trends — haven't disappeared. The question isn't whether yields will pressure crypto (they already are); it's whether the crypto ecosystem can deliver enough upside to justify the risk premium over a "safe" 5%.
Key numbers:
30-year Treasury yield: 5.004% (highest since July 2025)
BTC 24h change: +1.68%, trading at ~$79,835
BTC–S&P 500 correlation: 0.96
10-year Treasury yield: 4.39%
@Gate_Square@Gate广场_Official#gatesquare