A leading analyst has pointed out that the price of Chainlink (LINK) needs to surpass the level of 25 USD to trigger a strong bullish rally, likely surpassing the 100 USD mark.
According to data from TradingView, Chainlink has experienced a significant decline, dropping nearly 10% in the past week and losing about a quarter of its value since reaching its ATH in October. Currently, this token is trading around 17.66 USD, marking a decrease of 10.49% from its yearly high.
Analysts note that the recent correction reflects the overall cautious sentiment in the market, as investors take profits and reassess risks on major digital assets.
Chainlink price could be bullish above 100 USD when breaking the 25 USD level.
A chart shared by Ali_charts shows an intriguing picture of the long-term structure of Chainlink.
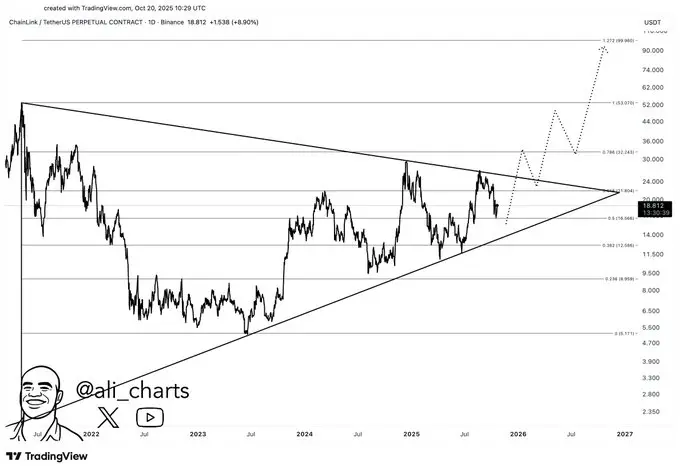 Source: Ali_chartsAfter months of accumulation in a narrowing symmetrical triangle, the price seems to be approaching a decisive breakout point. Currently, LINK is trading around 18 USD, holding above key support levels that have triggered strong recoveries in the past.
Technically, the chart shows that a clear move above the resistance zone of 25 USD could mark the beginning of a major bullish phase.
The structure of the model, combined with historical reactions to similar breakouts, indicates an increasing potential for momentum-driven profits.
If Chainlink can break and hold above this important threshold, the next main target will appear near the 36 USD level, followed by around 52 USD–74 USD.
Long-term predictions, as outlined in the chart, envision a possibility of running towards 100 USD, although such a move may occur in stages with significant pullbacks along the way.
As Ali_charts noted, “the next time Chainlink breaks 25 USD, it could trigger a bullish move to 100 USD.”
This structure shows that the market is in a waiting state, just a strong breakout is needed to turn the accumulation into a complete bullish trend.
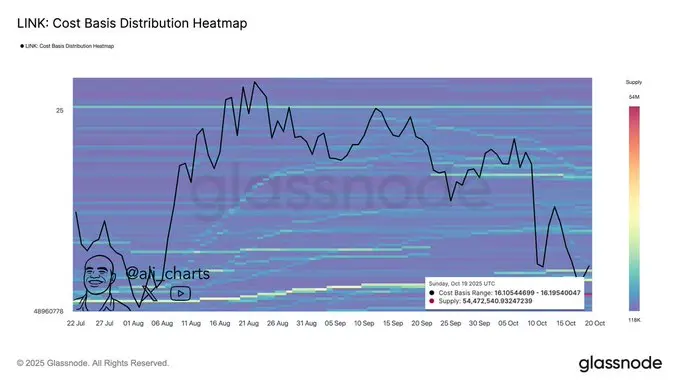
54.4 million LINK accumulated at the price of 16 USD
Approximately 54.47 million LINK has been accumulated around the 16 USD level, creating a strong and clear support zone. This accumulation zone is significant because it indicates that large investors are preparing for a bullish scenario.
History shows that strong buying activity near a stable price level often leads to significant bullish trends, especially when the broader market sentiment begins to shift.
From a technical perspective, LINK continues to trade within a long-term symmetrical triangle, gradually narrowing as price volatility decreases.
The continuous protection of the 16 USD area further strengthens this platform, solidifying it as a major battleground between bulls and bears.
If LINK continues to hold above this level, the next resistance levels to watch are around 20 USD and 25 USD.
 Source: Ali_chartsA decisive breakout above 25 USD could completely change market sentiment, opening the door for a larger bullish structure. This structure could target the 36 USD to 50 USD range over time.
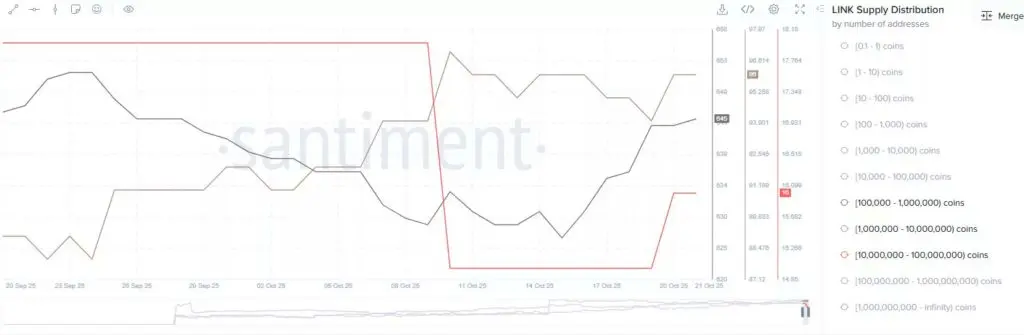
Whales are bullish on accumulating Chainlink
The latest Chainlink heatmap from Glassnode, shared by SlooReviews, reveals a market quietly building momentum. Data shows an increase in whale accumulation during a period of price stability, a sign that large investors may be preparing for a potential breakout.
The distribution of the basic cost shows that most recent buying activities have concentrated between the levels of 16 USD and 18 USD, creating a dense support area. This area has acted like a magnet for accumulation, indicating strong confidence among holders even as LINK fluctuates near important resistance levels.
On the chart, the price action seems to be forming a double bottom pattern, which is often seen as a bullish reversal signal.
 Source: SlooReviewsThis structure indicates a breakout potential if LINK can decisively close above the 20 USD level. A move above that level could open a clear path towards 24 USD, corresponding to an increase of about 35% from the current price.
Mr. Giáo
Disclaimer: The information on this page may come from third parties and does not represent the views or opinions of Gate. The content displayed on this page is for reference only and does not constitute any financial, investment, or legal advice. Gate does not guarantee the accuracy or completeness of the information and shall not be liable for any losses arising from the use of this information. Virtual asset investments carry high risks and are subject to significant price volatility. You may lose all of your invested principal. Please fully understand the relevant risks and make prudent decisions based on your own financial situation and risk tolerance. For details, please refer to
Disclaimer.