Bitcoin (BTC) has recorded a strong bounce back on Sunday and continues to hold its upward momentum in the first session of the week, driven by expectations of a potential trade deal between America and China. According to the on-chain analysis platform Glassnode, pessimistic sentiment and selling pressure have peaked, opening up the possibility of a trend reversal in the short term.
A positive signal for the bulls is that BTC is still accumulating within a wide range around the historical peak for several weeks, while the bears have not been able to maintain the downward breakout below this range. This indicates that investor confidence in the bullish trend remains strong, as they continue to hold their positions and expect the bounce back to last.
However, the high price range can also trigger profit-taking pressure, causing traders to be cautious. Mr. Alex Thorn, Director of Research at Galaxy Digital, believes that the bullish market for Bitcoin is still being maintained, but if the price falls below 100,000 USD, the long-term upward structure could be affected.
The question now is: Will Bitcoin and altcoins continue to expand their bounce back, or will the high price range trigger a new wave of selling? Let's analyze the charts of the top 10 cryptocurrencies to find the answer.
Technical analysis SPX
The S&P 500 (SPX) index surged to a new record high on Friday and continued its upward momentum at the beginning of the week, indicating strong buying power from the bulls.
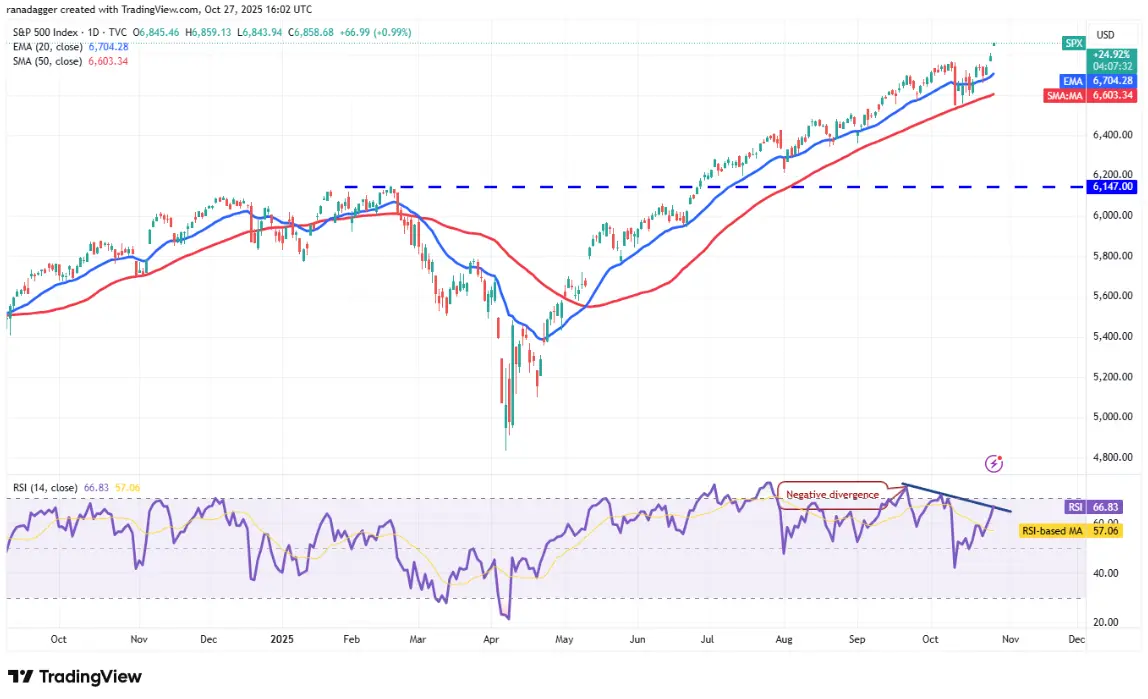 Daily SPX Chart | Source: TradingViewAlthough setting a new peak is often a positive signal, the negative divergence on the RSI indicator suggests caution is needed. If the price remains above the 20-day EMA( at 6,704 points, the upward trend may continue towards the psychological milestone of 7,000 points.
On the contrary, if the price reverses strongly and falls below the simple moving average )SMA( of 50 days at 6,603 points, this will signal a deeper correction, targeting a decrease to 6,350 points.
) Technical Analysis DXY
The bulls have maintained the USD Index ###DXY( above the 50-day SMA )98,13(, reflecting the strength of the greenback.
![ngay-28-10-phan-tich])https://img-cdn.gateio.im/webp-social/moments-58c48d350862c90efed97008ee5b21f4.webp(Daily DXY Chart | Source: TradingViewThe index is facing mild resistance at 99.56, but it is highly likely that this level will be broken. If that happens, DXY could rise to the 100.50 range, where bears are predicted to attempt to block the upward momentum once again. However, if bulls surpass the 100.50 threshold, the momentum could extend to 102 points.
This positive scenario will be invalidated if the price reverses down and breaks below the 50-day SMA line, indicating that the bears are still in control of the market. At that point, the index could fall to 97.46 and then 97.19.
) Technical analysis BTC
Bitcoin broke through the moving averages on Sunday, indicating that the bulls have regained control.
![ngay-28-10-phan-tich]###https://img-cdn.gateio.im/webp-social/moments-0cd8c7ad884b61e14775e1d6d99a2dc3.webp(BTC/USDT daily chart | Source: TradingViewThe 20-day EMA )112.337 USD( has started to trend upwards, and the RSI indicator is in the positive zone, giving a slight advantage to the bulls. The nearest resistance level is 118,000 USD - if surpassed, the BTC/USDT pair may re-test the historical peak at 126,199 USD.
Time is running out for the bears. They need to quickly pull the price below the 20-day EMA to regain control. Selling pressure is expected to increase significantly if the price closes below the support zone of 107,000 USD.
) Technical analysis of ETH
Ether ###ETH( closed above the 20-day EMA )4.047 USD( on Sunday, indicating that selling pressure is gradually decreasing.
![ngay-28-10-phan-tich])https://img-cdn.gateio.im/webp-social/moments-a63b125bc0cf9dfe1afb13168703d123.webp(Daily ETH/USDT chart | Source: TradingViewThe bulls will attempt to push the price above the 50-day SMA )4.234 USD( and challenge the resistance line of the descending channel pattern. Although the bears are expected to defend strongly at this level, if the bulls prevail, the ETH/USDT pair could soar to 4,957 USD before entering the next bullish phase towards 5,500 USD.
On the contrary, the bears need to push the price below the support line of the downtrend channel to regain control. If successful, the price could plummet to 3,350 USD.
) Technical analysis BNB
BNB ### BNB ( at 1,136.74 USD has surpassed the Fibonacci retracement level of 38.2% at 1,156 USD on Monday, but the bulls could not maintain the upward momentum, as evidenced by the long wick on the daily candle.
![ngay-28-10-phan-tich])https://img-cdn.gateio.im/webp-social/moments-da88697094d2e0837358e9236db303c7.webp(Daily BNB/USDT Chart | Source: TradingViewIf the price bounces back from the 20-day EMA )1.123 USD(, the bulls will once again try to extend the uptrend. If successful, the BNB/USDT pair could aim for the 50% Fibonacci level at 1.198 USD, then 61.2% at 1.239 USD. This will be a strong resistance zone, as if it surpasses 1.239 USD, BNB could extend its gain to 1.375 USD.
On the contrary, the 50-day SMA line )1.067 USD( is an important support zone. If the bears push the price below this threshold, it will signal that the upward momentum of BNB has peaked in the short term.
) Technical analysis of XRP
The bulls have pushed the price of XRP above the 20-day exponential moving average ###EMA( at $2.55 on Saturday, indicating the start of a strong bounce back.
![])https://img-cdn.gateio.im/webp-social/moments-599ba8a21fc12a424b686761c5be45b5.webp(XRP/USDT Daily Chart | Source: TradingViewThe price of XRP has now approached the 2.69 USD area, a level that was previously a support level — and has now turned into an important resistance level, where bears are likely to defend fiercely. If the price turns down from 2.69 USD but finds buying power at the EMA 20 line, this indicates that market sentiment is shifting from selling on the rise to buying on dips. In this scenario, the XRP/USDT pair could rise to the downtrend line, and if the price closes above this line, a bullish reversal signal will be confirmed.
On the contrary, if the price drops sharply from the current range and closes below the EMA 20 line, it indicates that the bears are still selling as the price bounces back. At that point, the currency pair may slide down to the 2.32 USD zone.
) Technical analysis of SOL
The price of Solana ###SOL( has surpassed the EMA 20 line at 197 USD on Sunday, paving the way for a potential breakout towards the resistance line of the descending price channel.
![])https://img-cdn.gateio.im/webp-social/moments-4d9d1039829f4f7051cc474f74bebdc9.webp(Daily chart of SOL/USDT | Source: TradingViewThe bears are likely to attempt to halt the bounce back at the resistance line, but if the bulls can break through this zone, the uptrend of the SOL/USDT pair could be strengthened, pushing the price towards 238 USD, and further to 260 USD.
On the contrary, if the price sharply reverses from the resistance line and breaks through the EMA 20, it indicates that the currency pair may continue to fluctuate in the bearish channel for some more time. The bears will need to push the price below the support line to regain control.
) Technical analysis of DOGE
Dogecoin ###DOGE( has reached the short term resistance level at the 20-day EMA, currently at $0.20 — an important milestone to watch.
![])https://img-cdn.gateio.im/webp-social/moments-e0fa09a4409861789088266f484989cf.webp(DOGE/USDT daily chart | Source: TradingViewIf the price rises above the 20-day EMA, the DOGE/USDT pair may start heading towards the 50-day SMA )0.23 USD(, and then to the strong resistance zone at 0.29 USD. Bears are expected to defend fiercely at the 0.29 USD zone; however, if bulls break through this level, a new upward trend may form, with the next target around 0.35 USD.
On the contrary, if the price decreases from the current area or from the 50-day SMA line, it indicates that the currency pair may continue to fluctuate within the range of 0.14–0.29 USD for a few more days.
) Technical analysis of ADA
The inability of Cardano ###ADA( to maintain below the 0.60 USD mark has attracted buying power again, as the bulls attempt to push the price above the 20-day EMA at 0.68 USD.
![])https://img-cdn.gateio.im/webp-social/moments-d77f3f2cb2c41ab0f9172cbbc48ecd47.webp(Daily ADA/USDT Chart | Source: TradingViewIf successful, the ADA/USDT pair could rise to the 50-day SMA )0.78 USD(, and then to the downtrend line. Bears will need to strongly defend the downtrend line, as a break could accelerate buying pressure, pushing Cardano's price towards 1.02 USD.
The 0.60 USD level remains an important short term support to pay attention to. If the price breaks and closes below this level, the pair may fall to the strong support area at 0.50 USD, where bulls are expected to intervene.
) Technical analysis HYPE
Hyperliquid ###HYPE( has surpassed the 20-day EMA )41.60 USD( on Saturday and continued to break through the 50-day SMA )46.14 USD( on Sunday, indicating that the bears are gradually losing control.
![])https://img-cdn.gateio.im/webp-social/moments-1a591164ff686b931f673f58ecc9bd5b.webp(Daily HYPE/USDT Chart | Source: TradingViewThe HYPE/USDT pair may target the 51.43 USD zone, a level that bears need to defend fiercely. If they fail, the price of Hyperliquid could advance to the historical peak of 59.41 USD.
The 20-day EMA is expected to serve as a strong support zone during pullbacks. To regain the initiative, the bears need to quickly pull the price back below the 20-day EMA; if they succeed, the currency pair may return to test the important support zone at 35.50 USD.
SN_Nour