The price of Cardano (ADA) maintains a bullish momentum during Monday's trading session, currently hovering above the 0.59 USD mark after a strong bounce from a key support zone last week. On-chain data indicates that whales are accumulating strongly again, while the level of discussion about ADA on social media has also increased significantly — a sign that investor confidence is being reinforced. Technical indicators show that selling pressure is gradually weakening, implying that the early stage of a new bullish trend may be forming.
Cardano accelerates as whales “buy the dip”
Supply Distribution data from Santiment continues to bolster the bullish outlook for Cardano, as many large whale groups seize the opportunity to accumulate ADA during recent pullbacks.
Specifically, whale groups holding 1–10 million ADA ( yellow line ) and 10–100 million ADA ( blue line ) have accumulated a total of 160 million ADA just from Thursday to Monday. This figure indicates that large investors are taking advantage of the “buy low” opportunity as the market adjusts, laying a solid foundation for the next bullish momentum.
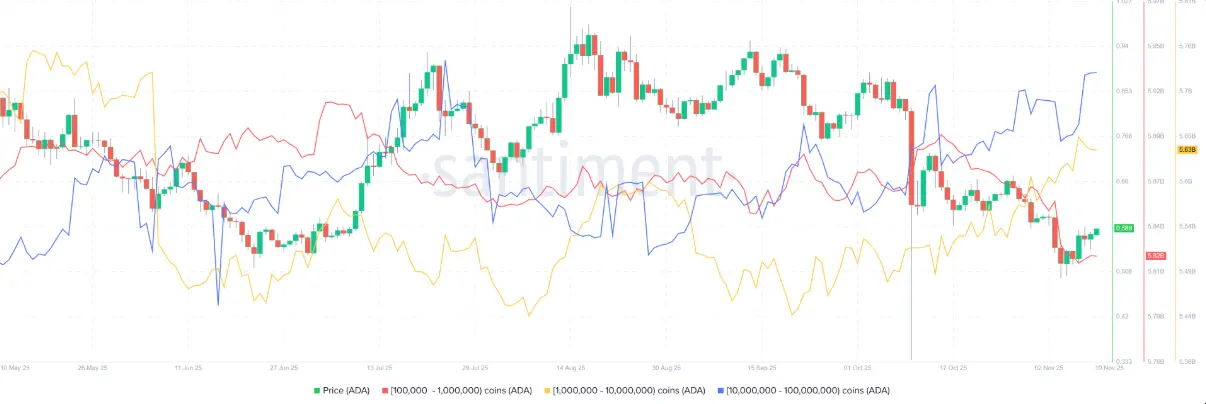 ADA Supply Distribution Chart | Source: SantimentIn addition, Cardano's Social Dominance on Santiment has also seen a significant increase. This metric, which measures the rate of discussion about ADA across cryptocurrency media channels, surged from 0.18% on Saturday to 1.29% on Monday — the highest level since late September. This growth reflects an increasing interest from investors, while marking a return of activity in the Cardano community.
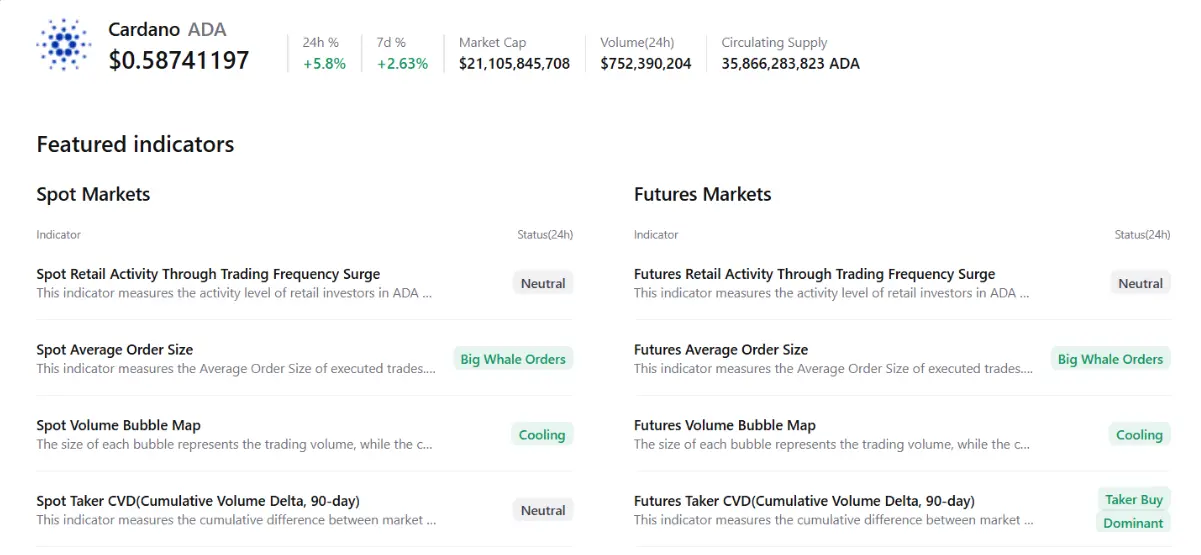
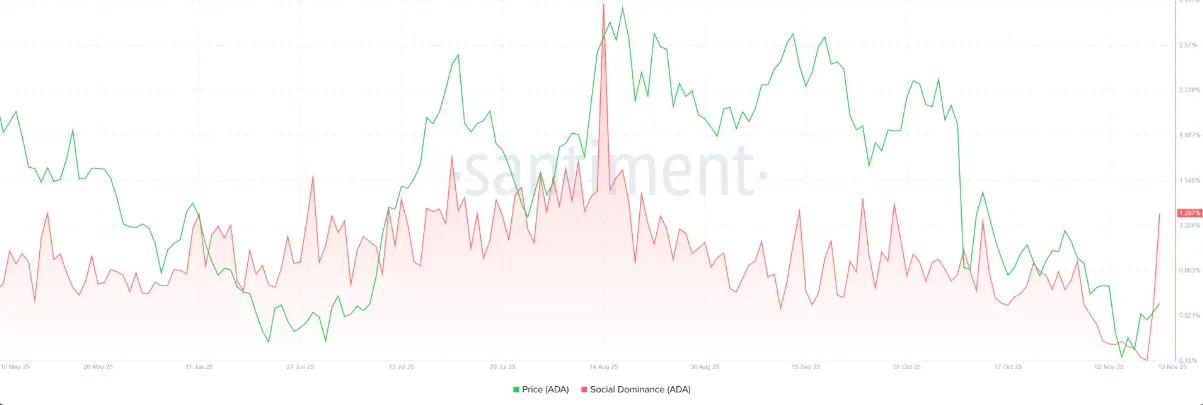 ADA Social Dominance Chart | Source: SantimentData from CryptoQuant also brings positive signals. Both the spot and derivative markets of ADA have witnessed large buy orders from whales, the market is gradually “cooling down” and the advantage is leaning towards the buyers, opening up the possibility of forming a sustainable recovery.
Cardano Price Prediction: ADA Bounces Back After Testing Key Support Zone
The price of Cardano (ADA) has found a solid support around the level of 0.49 USD on November 4th and since then has recorded an impressive recovery of about 11% as of Sunday. At the time of writing on Monday, ADA continues to maintain a bullish trend and is trading above 0.59 USD.
If this trend is maintained, ADA has the potential to extend its recovery, aiming for the next important resistance zone around 0.70 USD.
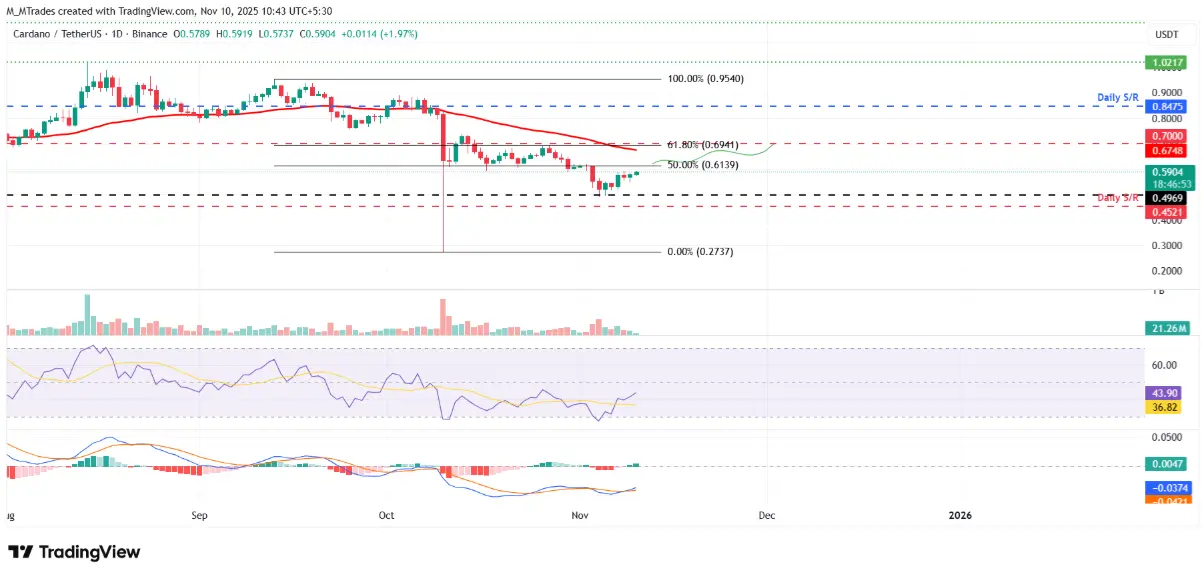 ADA/USDT Daily Chart | Source: TradingViewTechnical indicators also support the bullish potential. The RSI on the daily timeframe is currently at 43 and is approaching the neutral threshold of 50, indicating that selling pressure is gradually weakening. A breakout of the RSI above this neutral threshold will reinforce the recovery momentum. At the same time, the Moving Average Convergence Divergence (MACD) has just shown a bullish cross on Sunday, sending a clear buy signal and confirming new bullish momentum, opening up the possibility for the start of an upward trend.
On the contrary, if ADA faces selling pressure, this coin may revisit the support zone around 0.49 USD.
SN_Nour
Disclaimer: The information on this page may come from third parties and does not represent the views or opinions of Gate. The content displayed on this page is for reference only and does not constitute any financial, investment, or legal advice. Gate does not guarantee the accuracy or completeness of the information and shall not be liable for any losses arising from the use of this information. Virtual asset investments carry high risks and are subject to significant price volatility. You may lose all of your invested principal. Please fully understand the relevant risks and make prudent decisions based on your own financial situation and risk tolerance. For details, please refer to
Disclaimer.
Related Articles
Long and short positions are balanced for the first time in history, revealing the true story of crypto deleveraging through Ethena's sharp decline
Author: Kyle Soska, Chief Investment Officer of Ramiel Capital
Compiled by: Felix, PANews
The crypto market has been in a risk-averse state for several months. Kyle Soska, Chief Investment Officer of Ramiel Capital, has been carefully analyzing various market data to look for signs of a potential market turnaround. This article will explore the market structure of perpetual contracts and combine
PANews8m ago
Bitcoin returns to $70,000: Geopolitical conflict concerns ease, ETF fund inflows continue to drive BTC rebound
On March 10th, Bitcoin broke through $70,000 during the East Asian trading session, completing a recovery after the weekend sell-off. As volatility in the energy markets eased, selling pressure on risk assets diminished. Market data shows that institutional capital inflows continue to support Bitcoin, investor sentiment is improving, and short-term upside potential is increasing.
GateNews54m ago
XRP Today News: XRP Whale Accumulates 210 Million Tokens, Market Compression Range Indicates a Major Move
XRP has been under continuous pressure this year, but large whales holding between 1 million and 100 million XRP have recently increased their holdings by approximately 210 million coins, indicating that major investors are quietly building positions during the downturn. On the technical side, XRP is forming a contracting wedge between the support at $1.30 and resistance at $1.50, suggesting a potential significant directional move. The low liquidity environment could both amplify gains and increase downside risks. Watching whether the $1.30 support can hold is crucial.
MarketWhisper1h ago
Peter Brandt releases Bitcoin chart analysis showing a short-term bullish pattern
Gate News Announcement, March 10, renowned trader and chart analyst Peter Brandt released a Bitcoin chart analysis. Peter Brandt successfully predicted the 2018 Bitcoin crash. The chart shows the "Big Banana" chart displaying a large upward curved channel on the long-term weekly chart (2014-2027); the "Small Banana" chart shows a smaller similar curve currently forming near $69,000 on the daily chart. The arrows in the chart clearly point upward, indicating higher targets.
GateNews1h ago
ETH 15-minute increase of 1.32%: Major capital inflows and technical rebound resonate to drive the rise
2026-03-10 02:30 to 2026-03-10 02:45 (UTC), ETH's 15-minute return reached +1.32%, with a price range of 2020.97 to 2054.01 USDT, and an amplitude of 1.63%, showing a significant anomaly. Market attention increased accordingly, volatility intensified, and short-term trading activity rose.
The main driver of this anomaly was the concentration of large on-chain funds buying in, especially multiple large wallets making cumulative large purchases of over 3000 ETH near key support levels, directly pushing up the ETH price.
GateNews1h ago
BTC Price Fluctuation Analysis
# BTC Price Movement Deep Attribution Report for March 10, 2026, 02:30-02:45 (UTC)
## 1. Event Overview
Between 02:30 and 02:45 (UTC) on March 10, 2026, Bitcoin (BTC) experienced a significant price movement, with a return of +1.39%. The price fluctuations during this time window exceeded normal ranges, attracting market attention. This report will conduct a comprehensive attribution analysis based on on-chain data, market conditions, macroeconomic environment, trading behaviors, and other dimensions to uncover the true causes of the event and provide insights for investors.
GateNews1h ago