Pi Coin (PI) is currently trading around $0.205, nearly sideways over the past 24 hours. The price of Pi Coin has remained within a narrow range throughout December, with only a slight increase of 0.2% over seven days and still down more than 17% compared to last month.
The overall trend remains weak, so attention is shifting to shorter timeframes. A short-term breakout pattern has begun to form; however, buying pressure needs more than a simple breakout to confirm real strength.
Short-term breakout setup: More confirmation signals needed
On the 4-hour chart, PI is attempting to establish an inverse head and shoulders pattern — a structure often appearing at potential bottoms. The neckline of this pattern is around $0.208. If PI can close above this level on the 4-hour timeframe, the price could extend its upward move to $0.216, representing approximately a 3.5% increase. However, this is just the beginning of a sustainable upward trend.
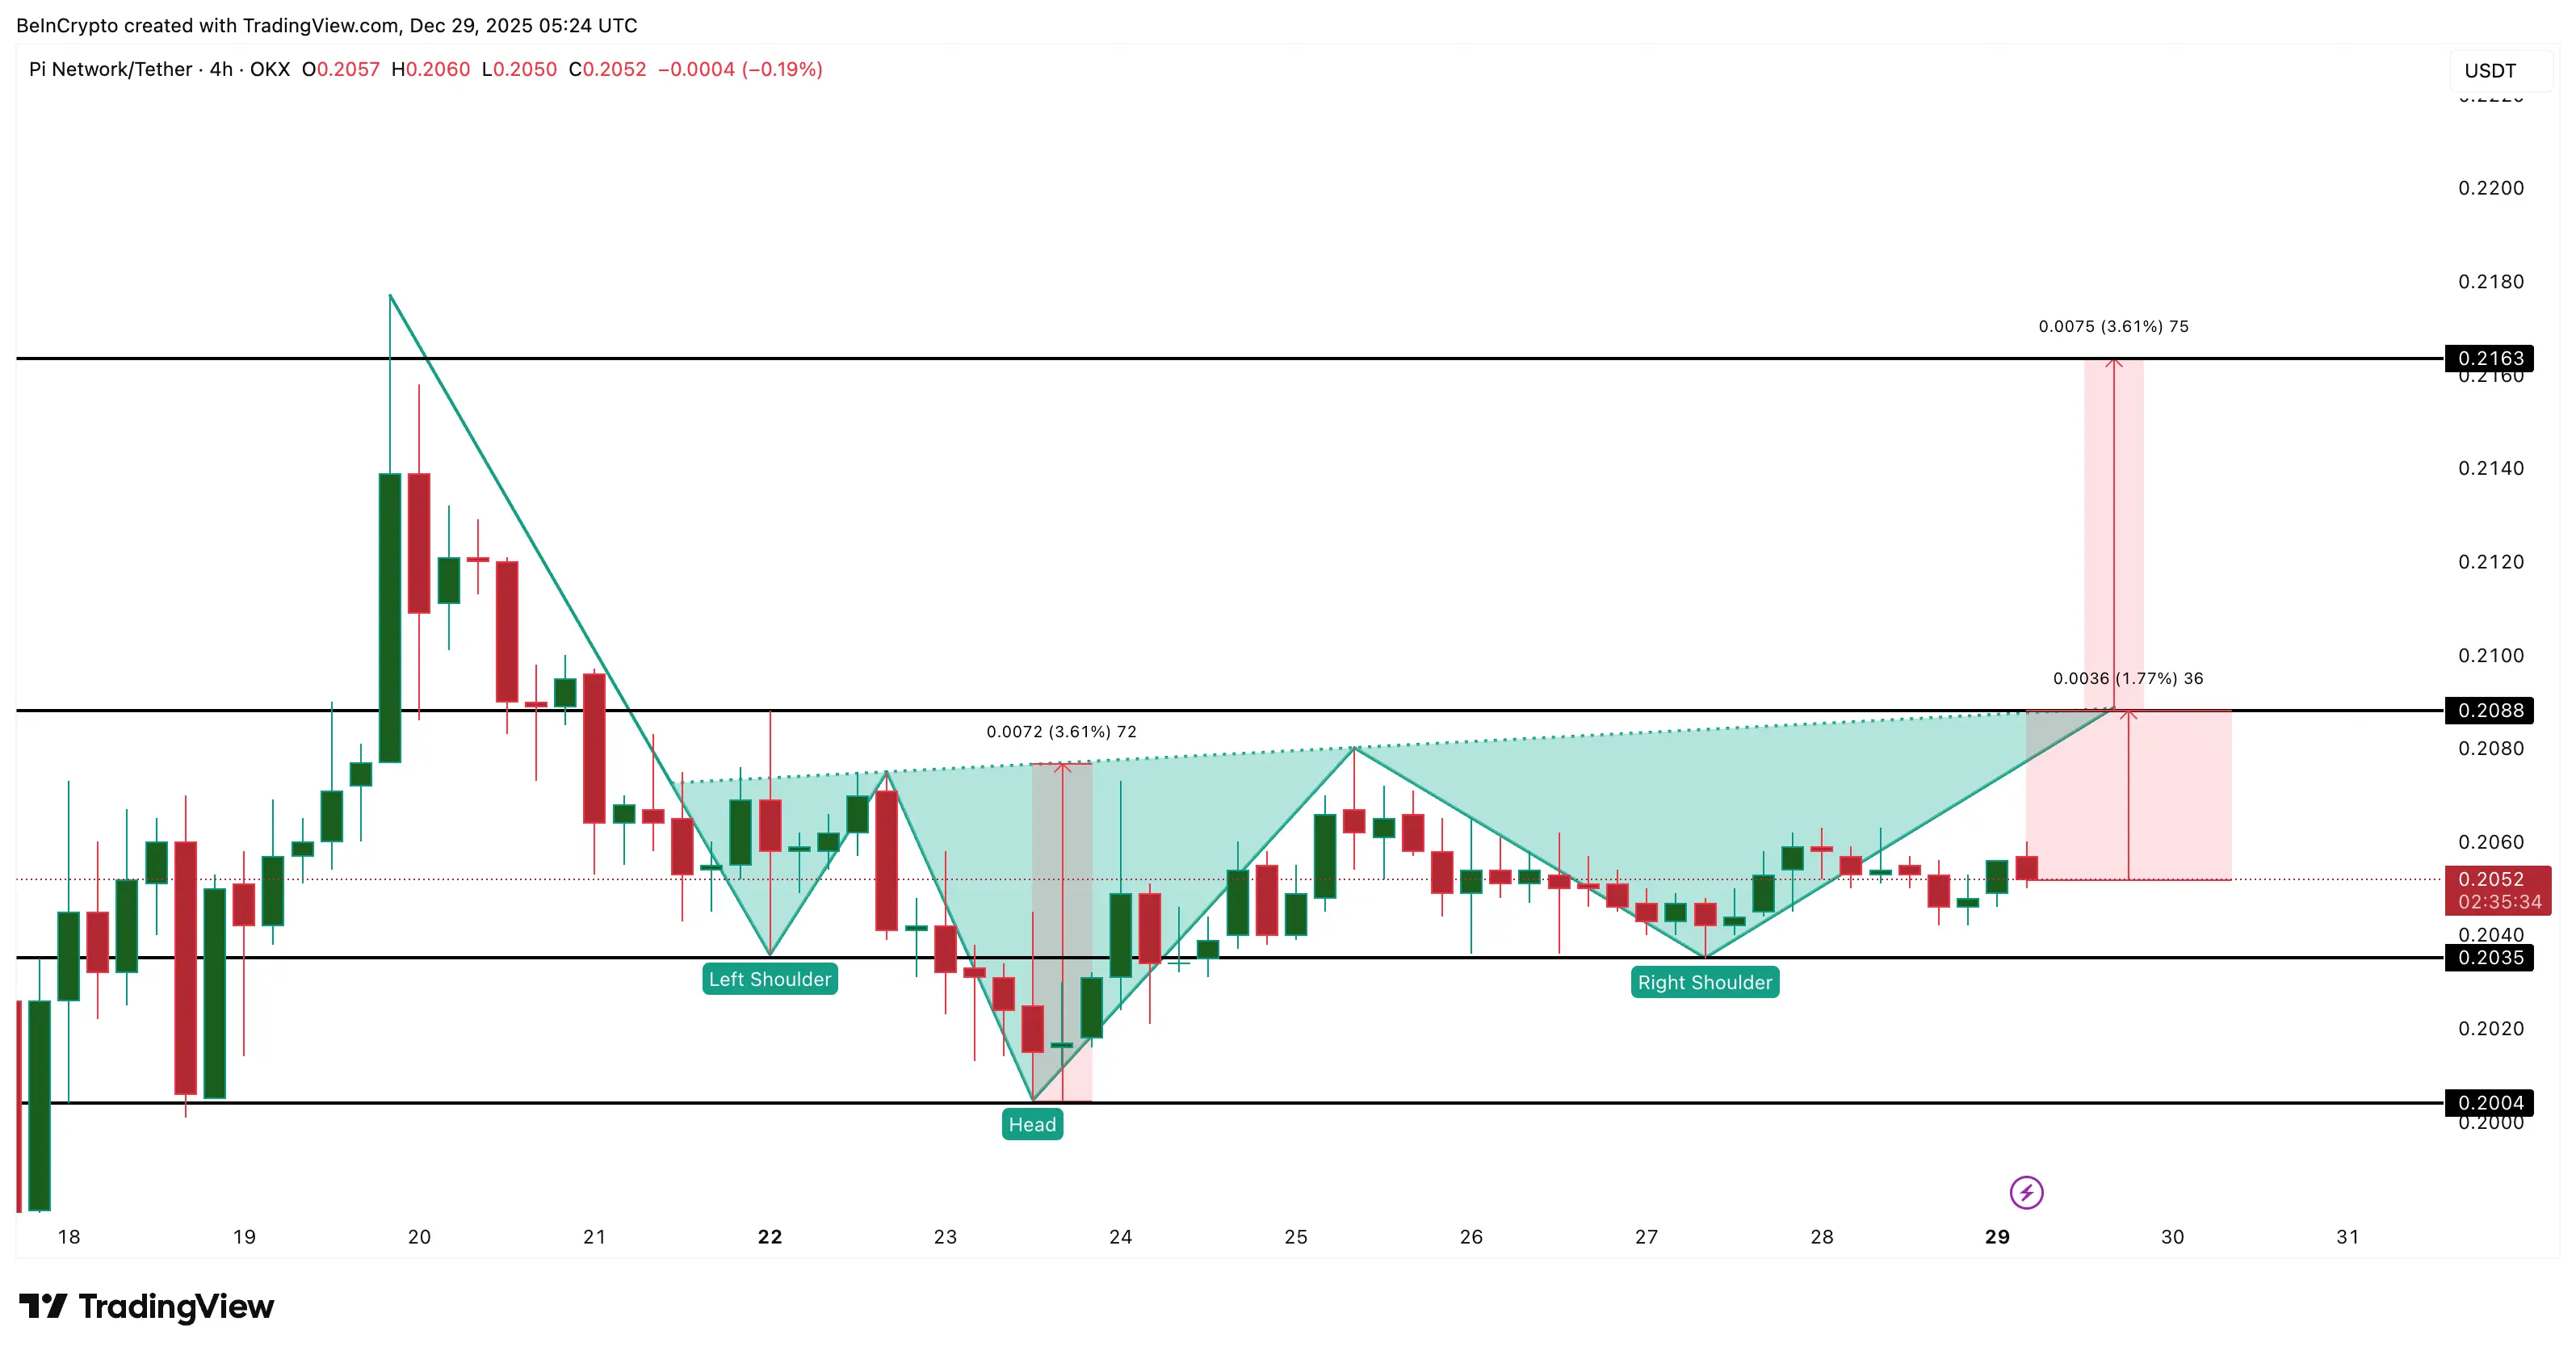 Pi Coin price chart on 4-hour timeframe | Source: TradingView The current support level is $0.203. If PI loses this level, the pattern will weaken significantly. Especially, if the price drops below $0.200, the short-term setup will fail, and market momentum will revert to a downtrend.
This breakout attempt is significant because the Chaikin Money Flow (CMF) indicator, which tracks capital flow based on price and volume, has broken above its downtrend line. If the CMF remains above zero on the 4-hour chart, it indicates that new money is flowing into the market, supporting the bullish scenario. Conversely, if the CMF drops below zero, the breakout signal will lose credibility.
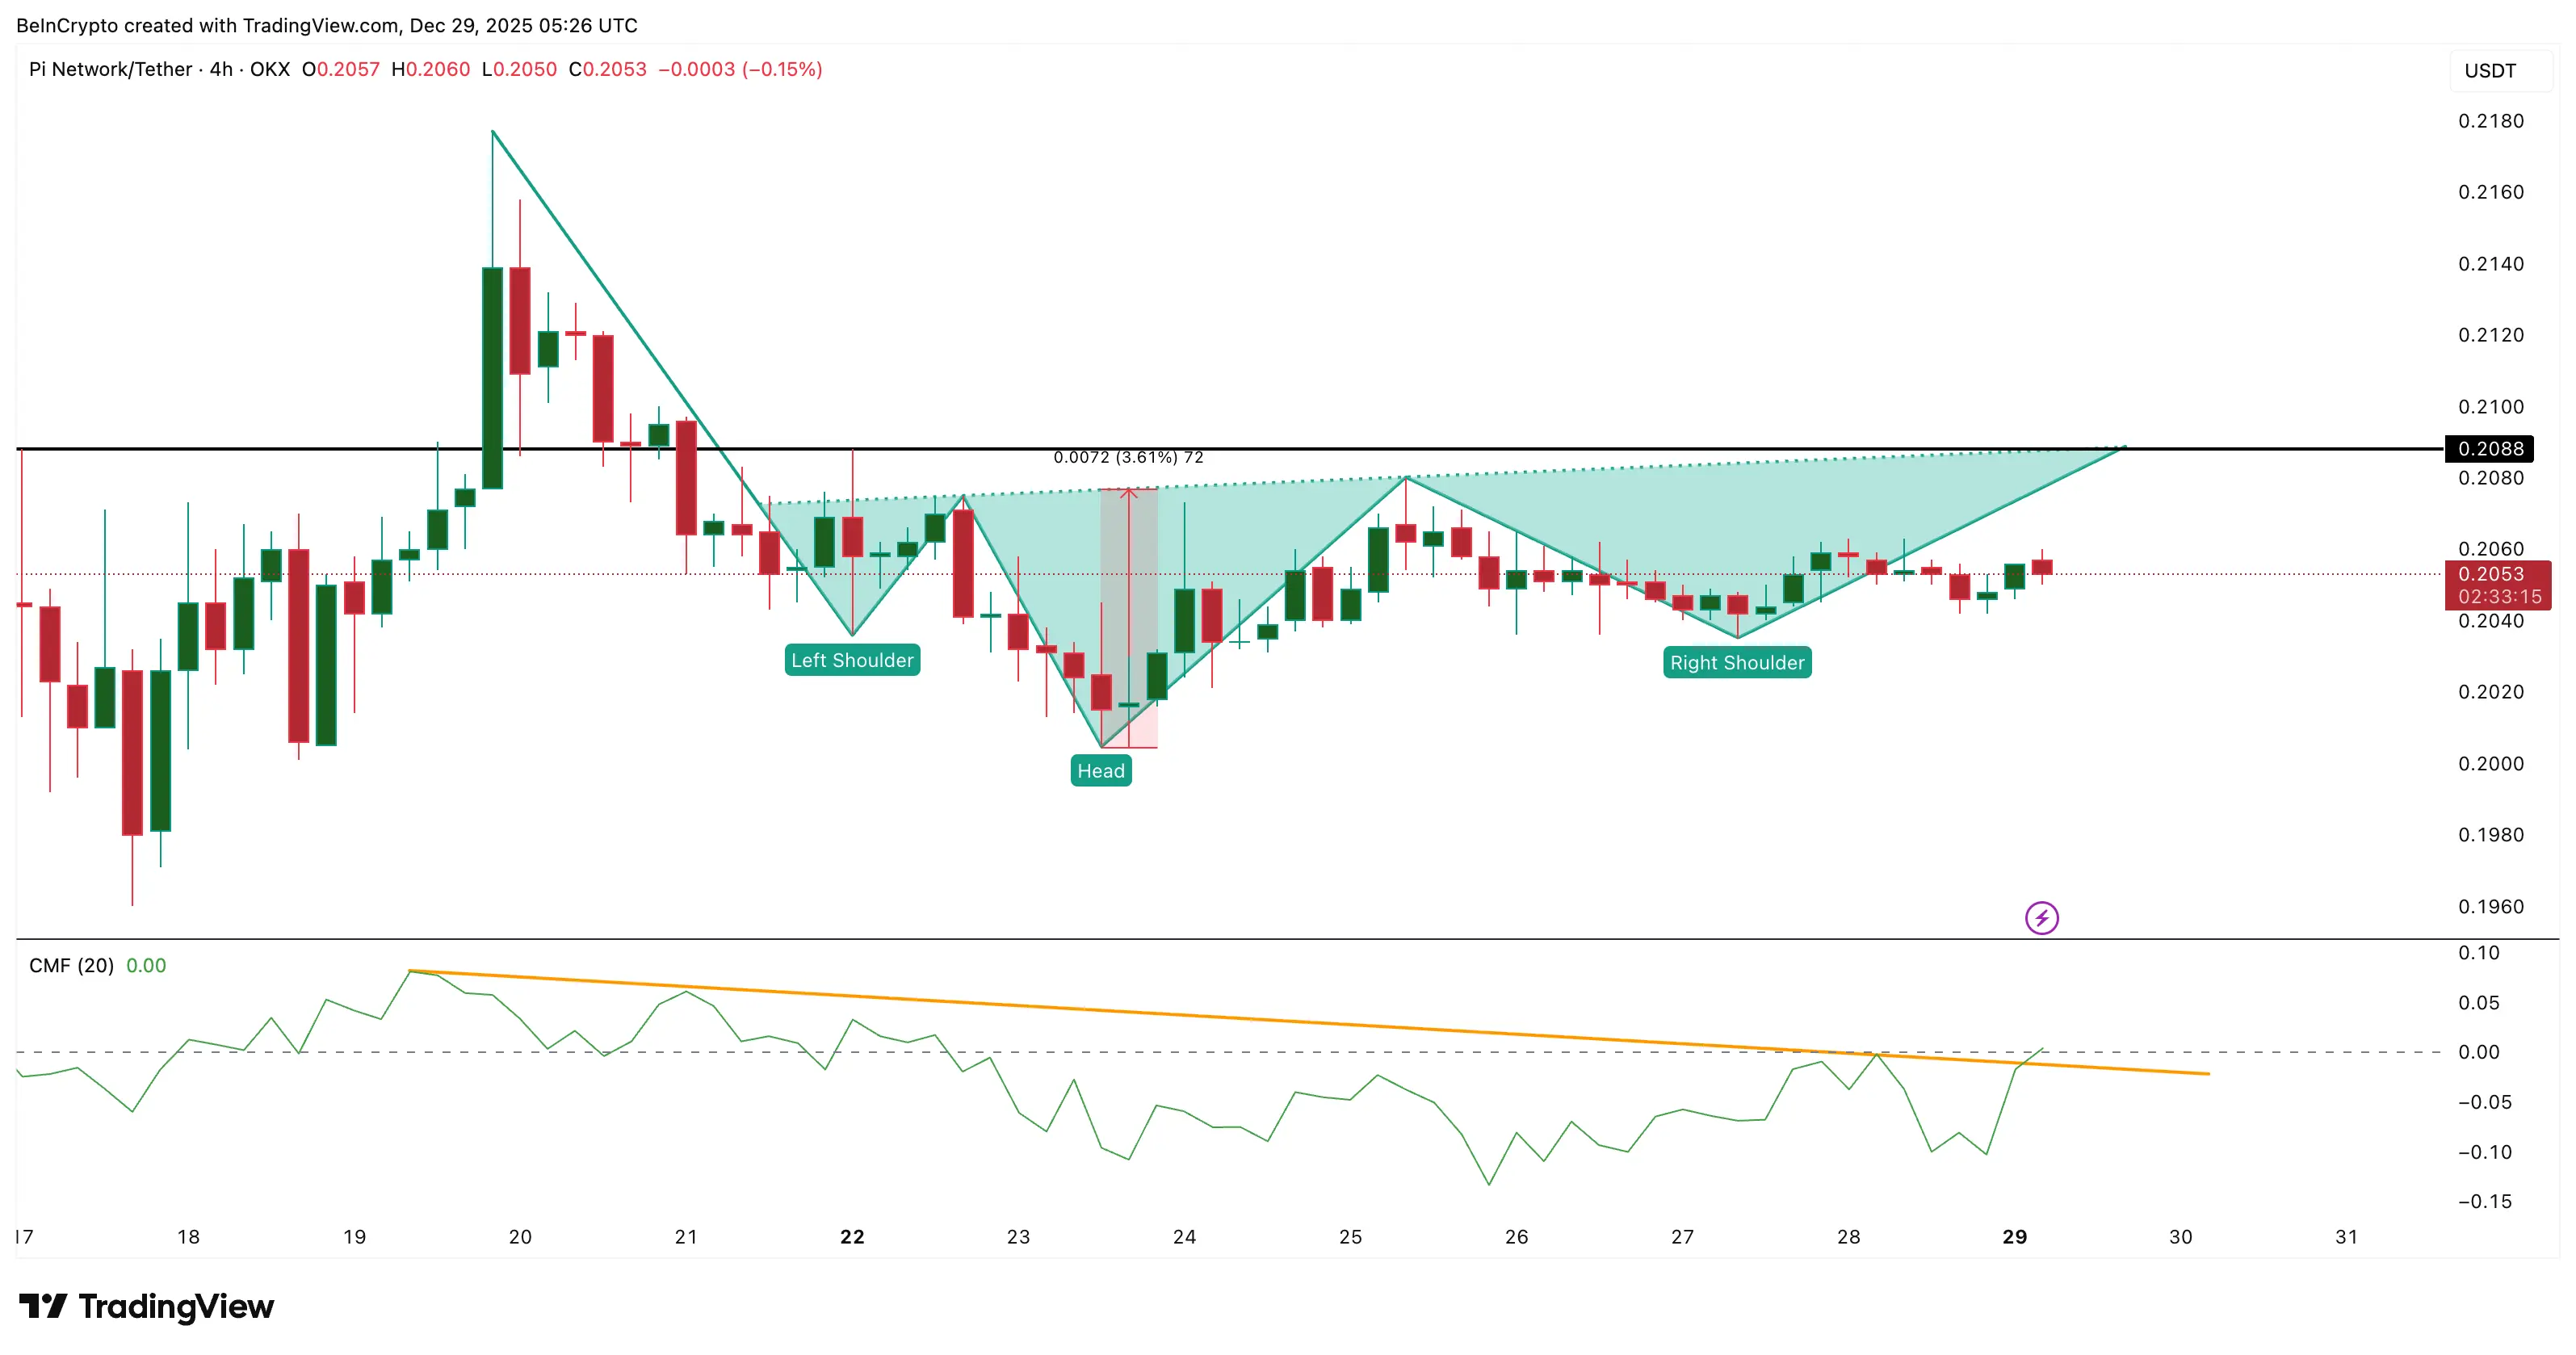 Capital flow improving | Source: TradingView Currently, PI is still in the activation zone, without a clear confirmation of recovery. To gain more insight into the recovery prospects via breakout, close attention should be paid to the indicators on the daily chart.
Catching buying interest on the daily chart, but price range remains unbroken
On the daily timeframe, the PI price outlook remains neutral to bearish.
From December 19 to 29, PI’s price continuously declined, while the Money Flow Index (MFI) — an indicator showing buy-the-dip interest — recorded new highs. This is a slight bullish divergence, reflecting investors taking advantage of lower prices to buy in. The MFI is trending upward, supporting recovery efforts, but on its own, it’s not enough to confirm a trend reversal.
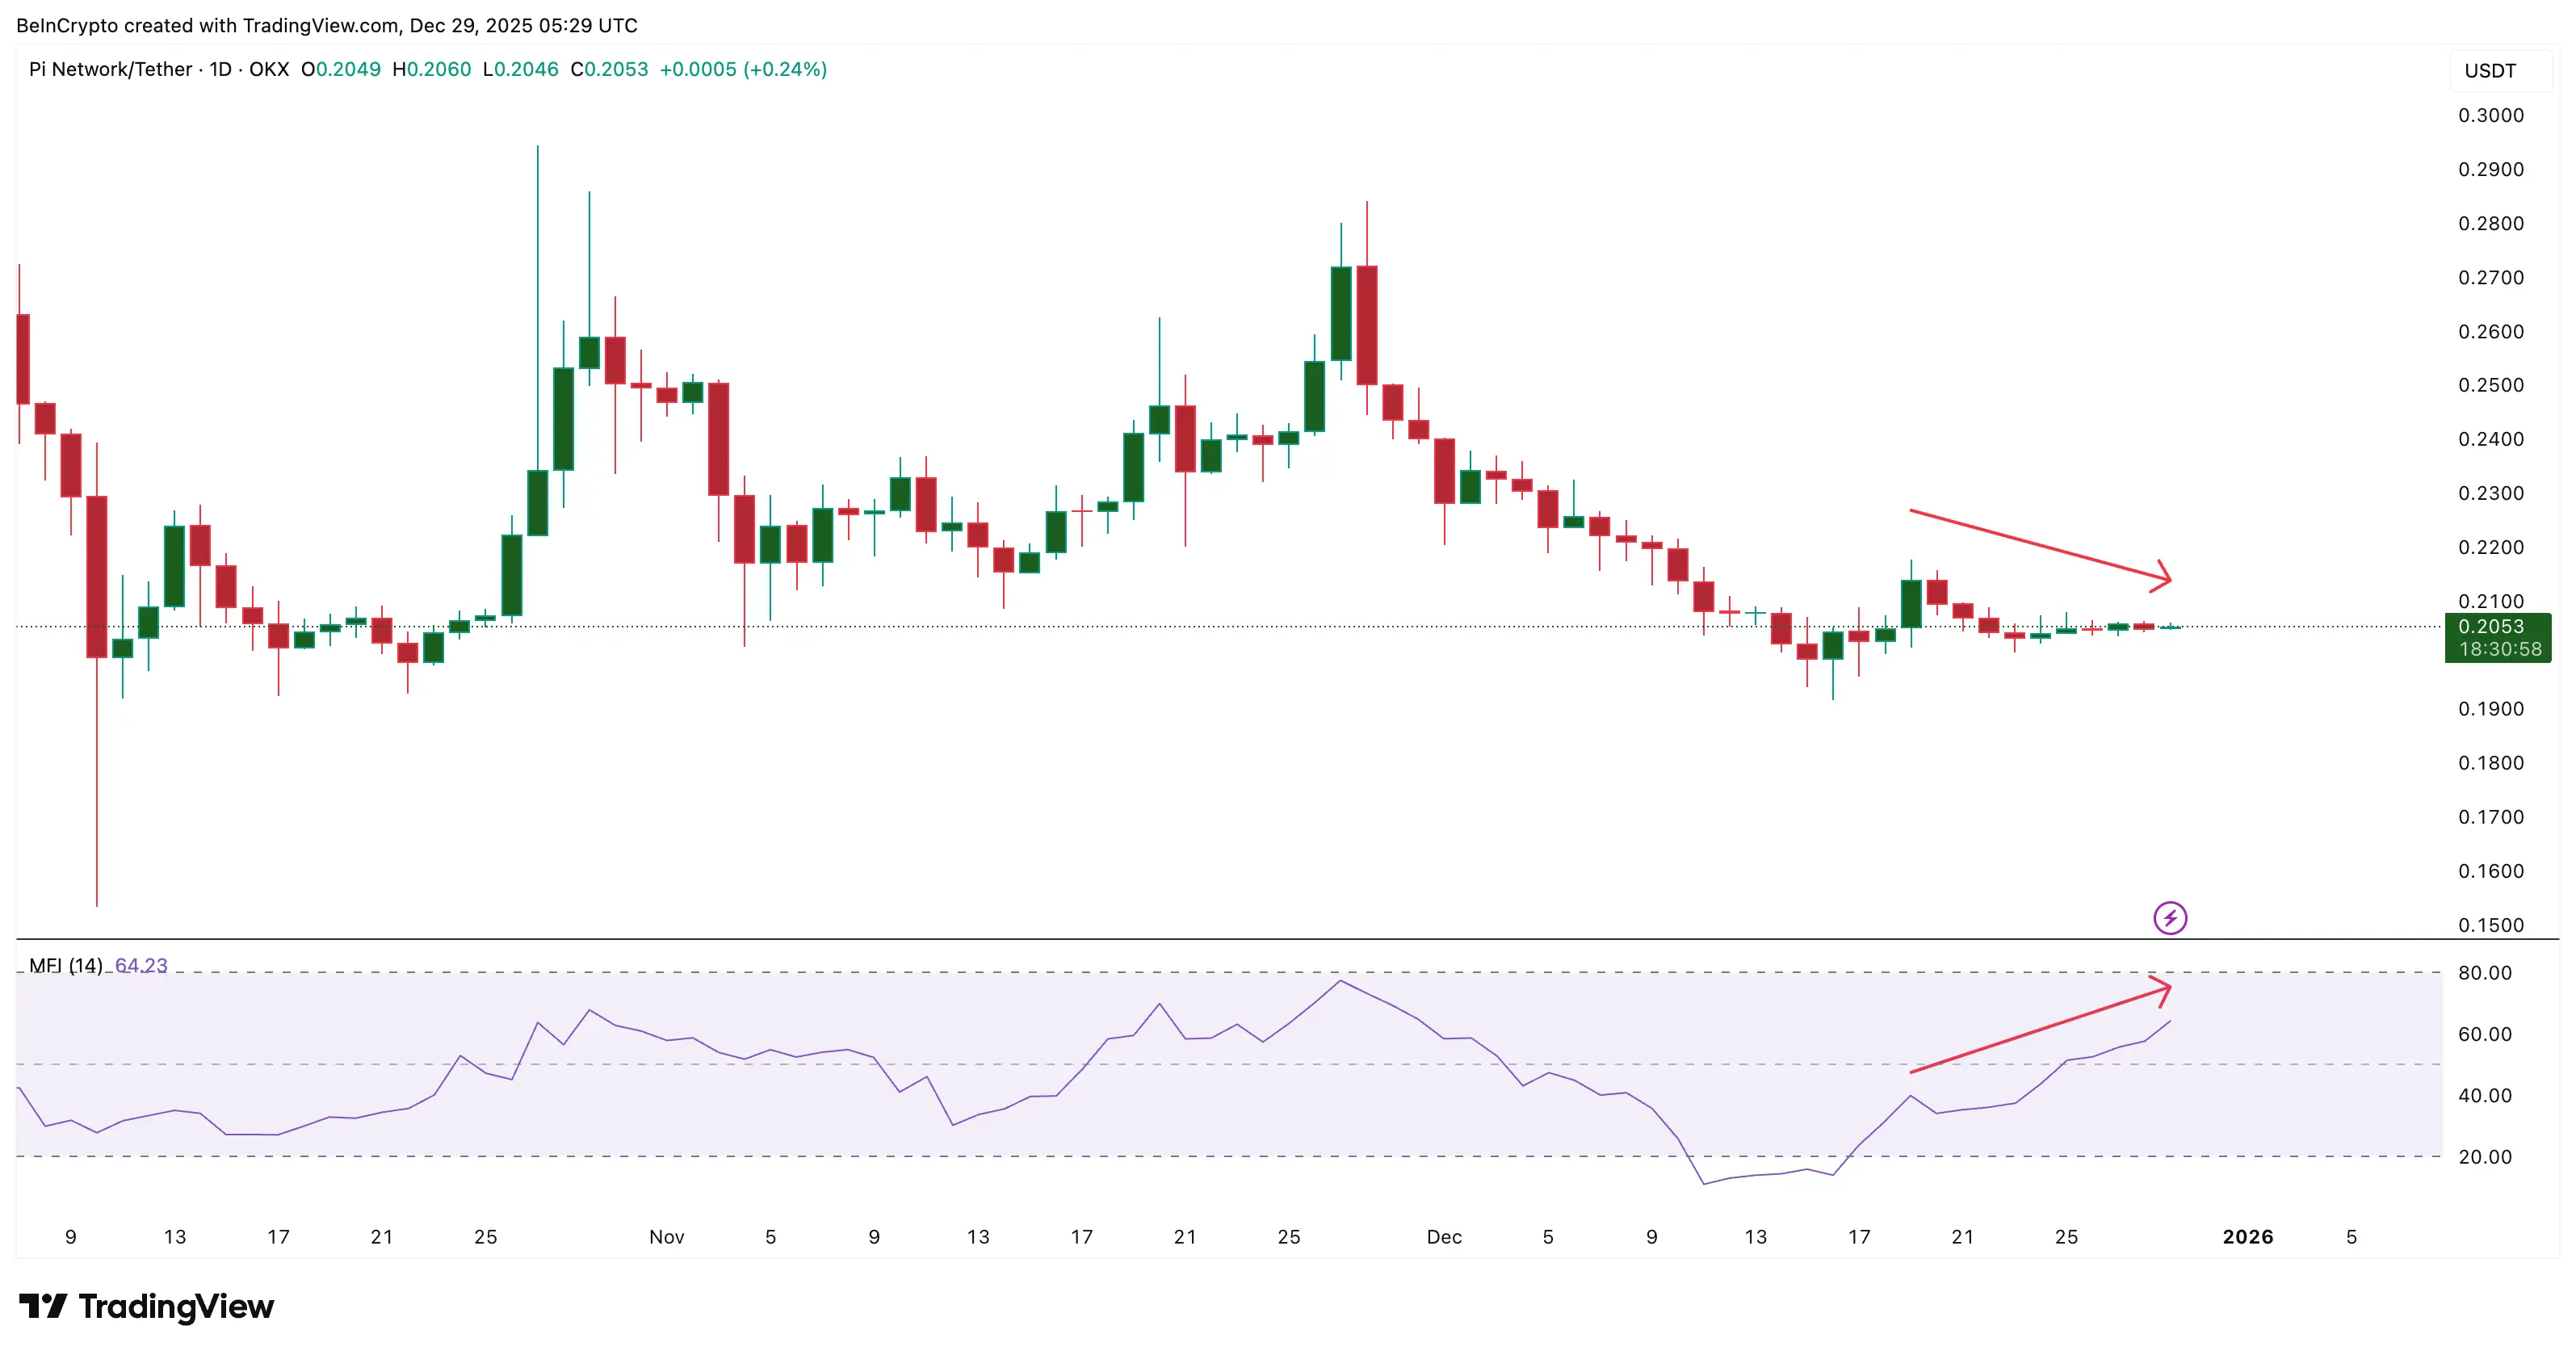 Pi Coin sees buying interest when the price drops | Source: TradingView The daily trading range is currently defined by resistance at $0.213 and support at $0.191.
If PI can break above $0.213 on the daily chart, it will be the first strong signal indicating buying interest is ready to challenge the long-term downtrend. This level is more significant than the 4-hour breakout because it coincides with a resistance zone maintained since early December.
If PI reaches $0.216 as per the 4-hour breakout scenario, the price will automatically surpass the key daily resistance at $0.213. This makes $0.216 a crucial short-term target.
Subsequently, PI could aim for the $0.248 zone — a level that this coin has not recovered since November 29. This is also where the real bullish momentum begins to matter.
Conversely, if PI drops below $0.191, all bullish setups will be invalidated (including the breakout scenario on the 4-hour chart), and the market will revert to a deeper downtrend.
Disclaimer: The information on this page may come from third parties and does not represent the views or opinions of Gate. The content displayed on this page is for reference only and does not constitute any financial, investment, or legal advice. Gate does not guarantee the accuracy or completeness of the information and shall not be liable for any losses arising from the use of this information. Virtual asset investments carry high risks and are subject to significant price volatility. You may lose all of your invested principal. Please fully understand the relevant risks and make prudent decisions based on your own financial situation and risk tolerance. For details, please refer to
Disclaimer.