Solana (SOL) is trading around $82, sparking a debate among technical analysts about whether it has hit the cycle bottom or is facing a deeper decline to $50. Trader Ali Martinez identified two key levels: $74.11 and $50.18, considered major support and resistance levels for SOL in the near future.
Market analysis platform Blockcircle previously posted on February 19 that SOL’s price chart is clearly showing a short-term downtrend.
Technical Analysis and Support Zones
According to the chart, Solana’s price was rejected at the upper trend channel bottom, with key support levels at $80 and $77. Additionally, another support level was identified below the current trading range, around $69.50.
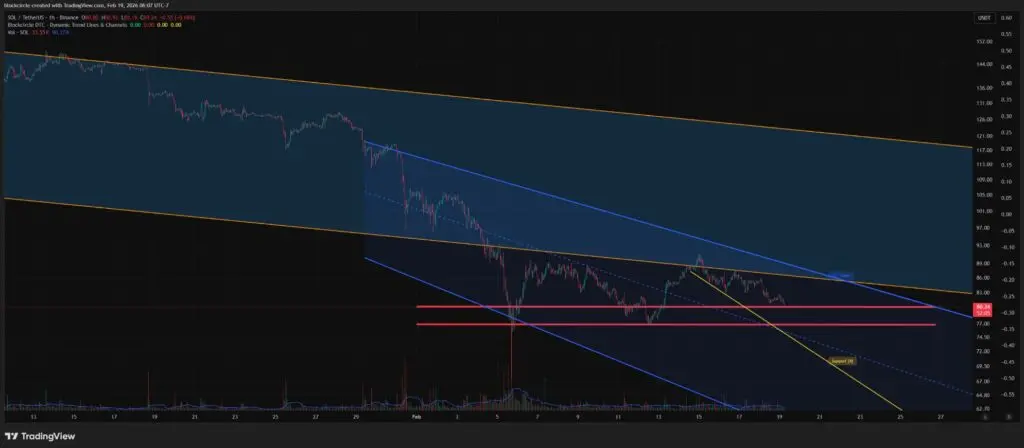 Solana price chart on 1-hour timeframe | Source: Blockcircle/TradingView The chart depicts a descending channel pattern, with SOL price oscillating within clearly defined limits. The rejection at the upper trendline indicates continued selling pressure within the current downtrend structure. Trading volume indicators also show subdued activity, reflecting weak market sentiment in recent movements.
Accumulation or Reversal?
Trader Bluntz, on February 19, shared the view that SOL’s current price is in the early stages of accumulation, and a bottom has formed. His technical chart indicates an accumulation zone between $75 and $90. According to this analysis, if the $90 resistance is broken and then retested as support, SOL could rise to $108.
Bluntz’s chart also includes annotations about wave patterns and highlights a rectangular area marked as a potential accumulation zone. This perspective views recent price weakness as a buying opportunity rather than a sign of a deeper correction.
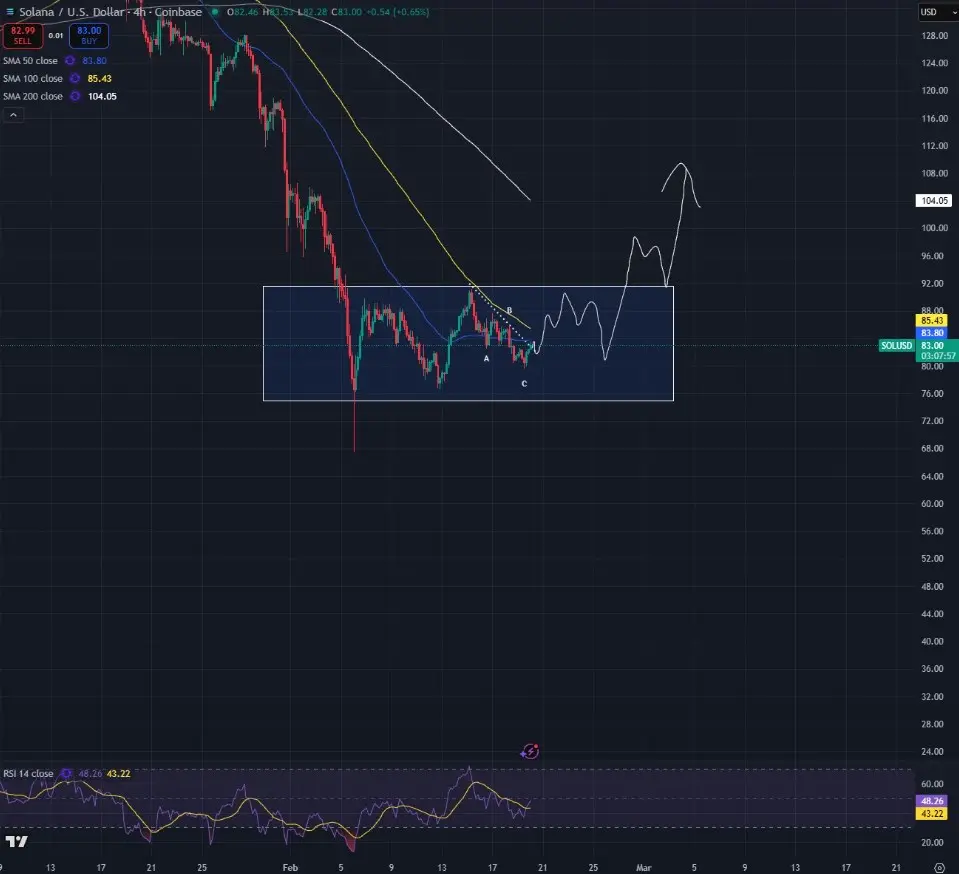 Solana price chart on 4-hour timeframe | Source: Bluntz/TradingView Meanwhile, trader SZ on February 20 shared a chart showing SOL losing support around $100. However, he emphasized this was only a temporary deviation, not a true breakdown. SZ’s analysis highlights that the support zone near $75 remains intact despite weakness at higher levels.
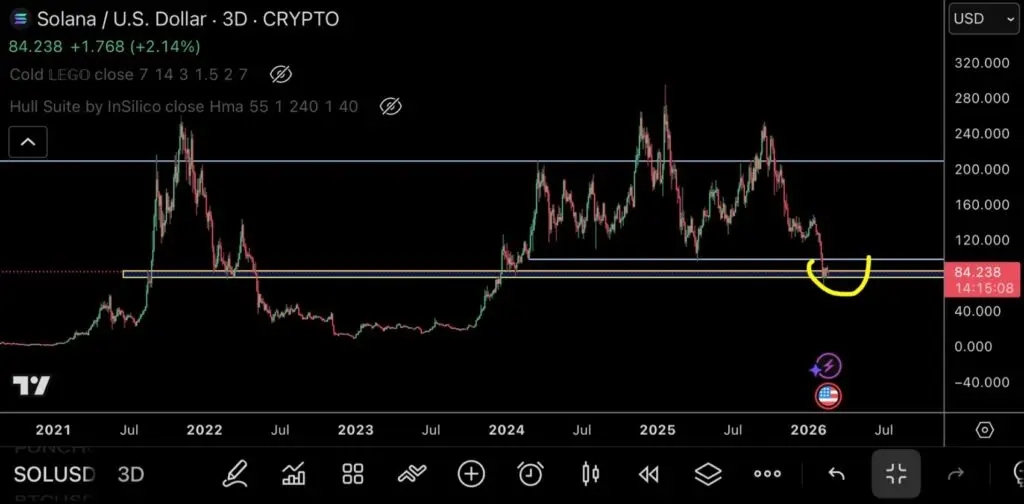 SOL price chart over 3 days | Source: TraderSZ/TradingView His chart emphasizes that short-term fluctuations below key support levels do not invalidate the overall support structure if the price quickly recovers.
Long-term Forecast: Solana Could Reach $500 by Mid-2026
Trader curb.sol, on February 15, issued an optimistic long-term outlook for SOL. His analysis, based on the “megaphone pattern,” suggests SOL could rise to $500 by July 2026 after hitting the bottom of this pattern.
The pattern indicates convergence of trendlines, hinting at a compression phase before a breakout. The chart also shows increasingly wider price swings within a larger range, with Solana’s current price action near the lower boundary of the pattern.
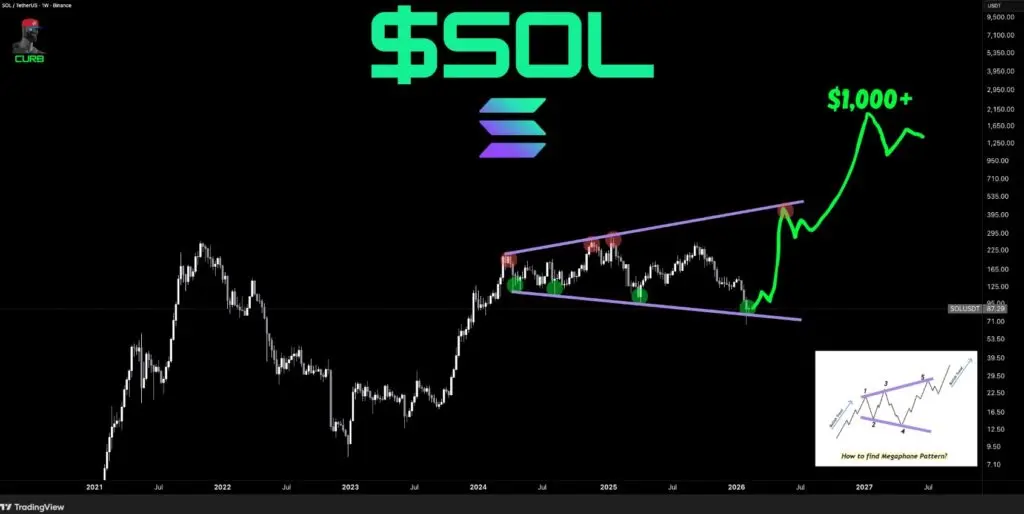 Weekly SOL price chart with megaphone pattern | Source: curb.sol/TradingView This forecast implies a significant increase from current levels if the pattern plays out as expected. Additionally, a target above $1,000 is considered a more distant possibility after reaching $500.
Debate on Solana’s Bottom Range: From $10 to $75
Trader TedPillows on February 18 shared that the most likely bottom range in the current cycle for SOL is between $50 and $10. His chart highlights $50 as a critical support level to test before potentially dropping to as low as $10.
His analysis also highlights accumulation phases in 2022 and 2023, when SOL traded within similar ranges. These phases often precede strong upward rallies.
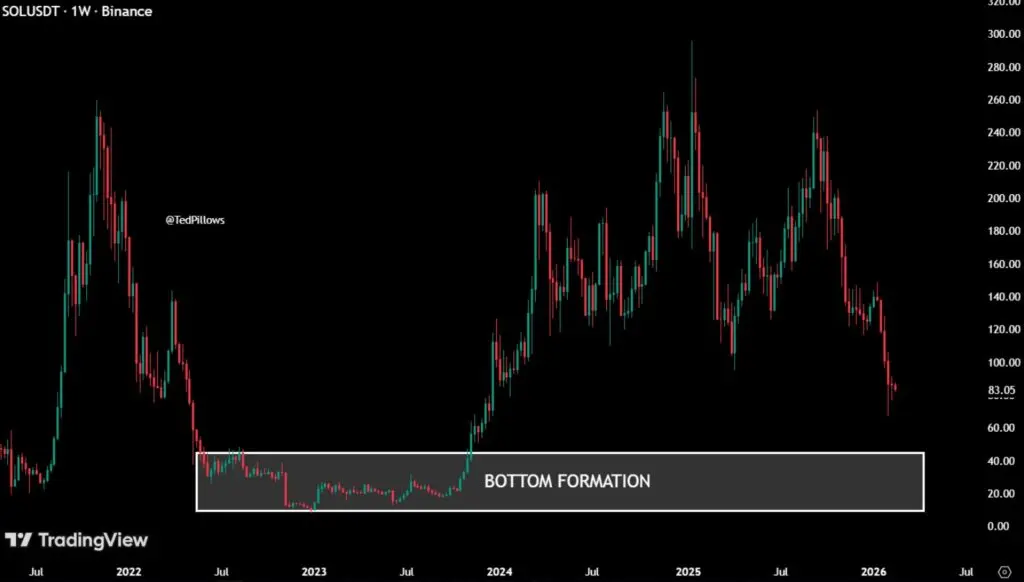 Weekly SOL price chart | Source: TedPillows/TradingView Technical structures from multiple analysts converge around the $70–$80 zone, seen as a key area. If SOL maintains above this zone, the accumulation thesis is supported, enabling short-term recoveries to $90–$100. Conversely, breaking below $70 could open the door to a decline toward $50, which many analysts identify as a deeper support level.
Conclusion
Currently, Solana’s price has fallen sharply from its 2025 peak near $260 but is stabilizing above the important psychological level of $80. Relative Strength Index (RSI) indicators show oversold conditions on shorter timeframes, though overall momentum still leans bearish. The 50-day and 100-day moving averages are also trending downward, reinforcing the short-term bearish outlook. However, strong support zones present opportunities for accumulation and potential future recovery.
Disclaimer: The information on this page may come from third parties and does not represent the views or opinions of Gate. The content displayed on this page is for reference only and does not constitute any financial, investment, or legal advice. Gate does not guarantee the accuracy or completeness of the information and shall not be liable for any losses arising from the use of this information. Virtual asset investments carry high risks and are subject to significant price volatility. You may lose all of your invested principal. Please fully understand the relevant risks and make prudent decisions based on your own financial situation and risk tolerance. For details, please refer to
Disclaimer.
Related Articles
Brera Stock Plunges Amid Growing Solana Pivot as 'Solmate' Firm Dumps Soccer Teams
In brief
Shares of Brera Holdings (SLMT) have dumped more than 19% on Wednesday.
The firm announced its intentions to shift focus to a UAE-centered Solana infrastructure firm late Tuesday.
One of its largest institutional shareholders, Ark Invest, began offloading small portions of its
Decrypt7m ago
Bitcoin ETF Records $238.46M Daily Inflow While Ethereum and Solana ETFs See Outflows on March 11
Gate News bot message, according to March 11 update data, Bitcoin ETFs recorded a daily net inflow of 3,392 BTC ($238.46 million) and a 7-day net inflow of 3,543 BTC ($249.1 million).
Ethereum ETFs showed a daily net outflow of 1,207 ETH ($2.49 million) and a 7-day net outflow of 21,846 ETH ($45 m
GateNews34m ago
XRP Price Prediction 2026: DeepSnitch AI’s 100x Case Dwarfs XRP & Solana, While Wall Street Pushes $540M in SOL ETFs
Goldman Sachs, Morgan Stanley, and Citadel collectively poured over $540 million into US spot Solana ETFs in a single quarter. When the most conservative names in traditional finance start filing disclosed positions in altcoin ETFs, the narrative moves permanently.
That institutional
CaptainAltcoin53m ago
Chainlink Expands on Solana With Jupiter Prediction Market Integration
Jupiter has plugged in Chainlink’s Data Streams for its 5-minute and 15-minute prediction markets on Solana.
While Jup Predict now relies on Data Streams for its short-duration crypto markets, Jupiter has not added Chainlink to its wider DeFi protocol.
Chainlink has announced a new
CryptoNewsFlash1h ago
Solana Price Lags Major Cryptos Despite Record On-Chain Activity
There is a strange phenomenon that was recently noticed by CoinMarketCap in the crypto market. This week, Solana provided a high output of blockchain activity. Nonetheless, its market price could not compete with other major digital assets. Although some of the most popular cryptocurrencies, such as
Coinfomania4h ago
Nasdaq-Listed Solmate Plans Corporate Restructuring and to Build Solana Hub in UAE
Brera Holdings rebranded to Solmate Infrastructure, focusing on building a Solana hub in the UAE. The company also announced a reverse stock split to align with institutional investor preferences, enhancing flexibility and addressing share structure.
TheNewsCrypto4h ago