Trade
Basic
Futures
Futures
Hundreds of contracts settled in USDT or BTC
TradFi
Gold
Trade global traditional assets with USDT in one place
Options
Hot
Trade European-style vanilla options
Unified Account
Maximize your capital efficiency
Demo Trading
Futures Kickoff
Get prepared for your futures trading
Futures Events
Participate in events to win generous rewards
Demo Trading
Use virtual funds to experience risk-free trading
Earn
Launch
CandyDrop
Collect candies to earn airdrops
Launchpool
Quick staking, earn potential new tokens
HODLer Airdrop
Hold GT and get massive airdrops for free
Launchpad
Be early to the next big token project
Alpha Points
Trade on-chain assets and enjoy airdrop rewards!
Futures Points
Earn futures points and claim airdrop rewards
Investment
Simple Earn
Earn interests with idle tokens
Auto-Invest
Auto-invest on a regular basis
Dual Investment
Buy low and sell high to take profits from price fluctuations
Soft Staking
Earn rewards with flexible staking
Crypto Loan
0 Fees
Pledge one crypto to borrow another
Lending Center
One-stop lending hub
VIP Wealth Hub
Customized wealth management empowers your assets growth
Private Wealth Management
Customized asset management to grow your digital assets
Quant Fund
Top asset management team helps you profit without hassle
Staking
Stake cryptos to earn in PoS products
Smart Leverage
New
No forced liquidation before maturity, worry-free leveraged gains
GUSD Minting
Use USDT/USDC to mint GUSD for treasury-level yields
More
vanabin
Crypto Market Momentum: What Charts Are Saying
98
- Reward
- like
- Comment
- Repost
- Share
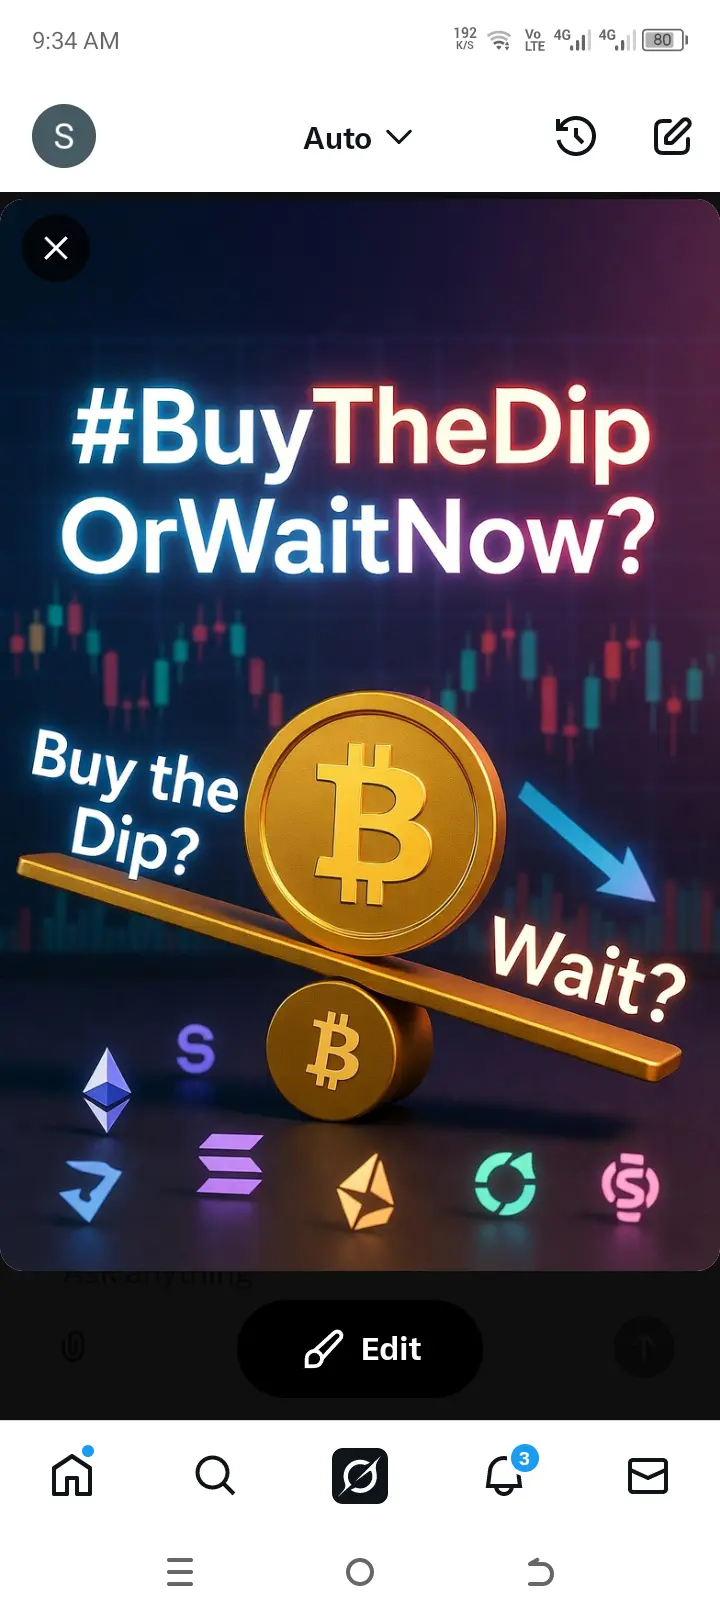
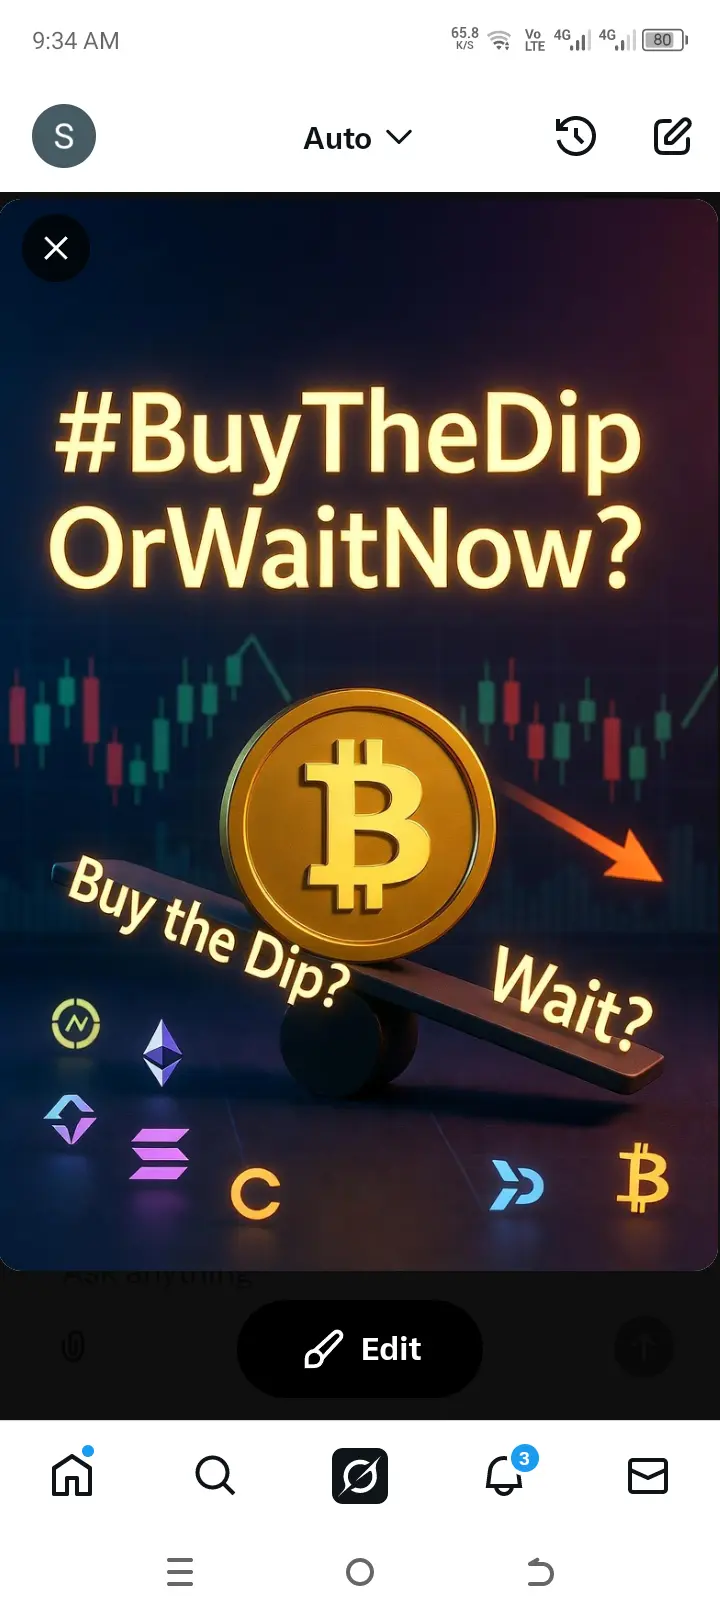
#BuyTheDipOrWaitNow? 🚨 #BuyTheDipOrWaitNow? 🚨
The crypto market has been showing some turbulence lately. Prices are dipping, and the classic question arises: should you buy now or hold back? 🤔
Here’s what to consider:
🔹 Market Sentiment: Fear is high, but dips can also be opportunities for long-term gains.
🔹 Technical Levels: Watch key support and resistance zones—these often hint at potential reversal points.
🔹 Fundamentals: Strong projects usually recover faster; weak ones may continue downward.
🔹 Risk Management: Only invest what you can afford to hold without stress.
💡 Tip: Sometim
- Reward
- 4
- 2
- Repost
- Share
Tea_Trader:
To The Moon 🌕View More
Participate in horse racing betting, complete tasks to earn horse racing tickets, and enjoy a million red envelope rain daily, sharing a prize pool of 100,000 USDT at the Gate 2026 Spring Festival Celebration. https://www.gate.com/competition/year-of-horse-2026?ref_type=165&utm_cmp=7EQB9Jba&ref=UwUWVw9Y
View Original
- Reward
- 4
- Comment
- Repost
- Share
OD
one dollar
Created By@MMS06
Listing Progress
0.00%
MC:
$0.1
More Tokens
- Reward
- 1
- Comment
- Repost
- Share
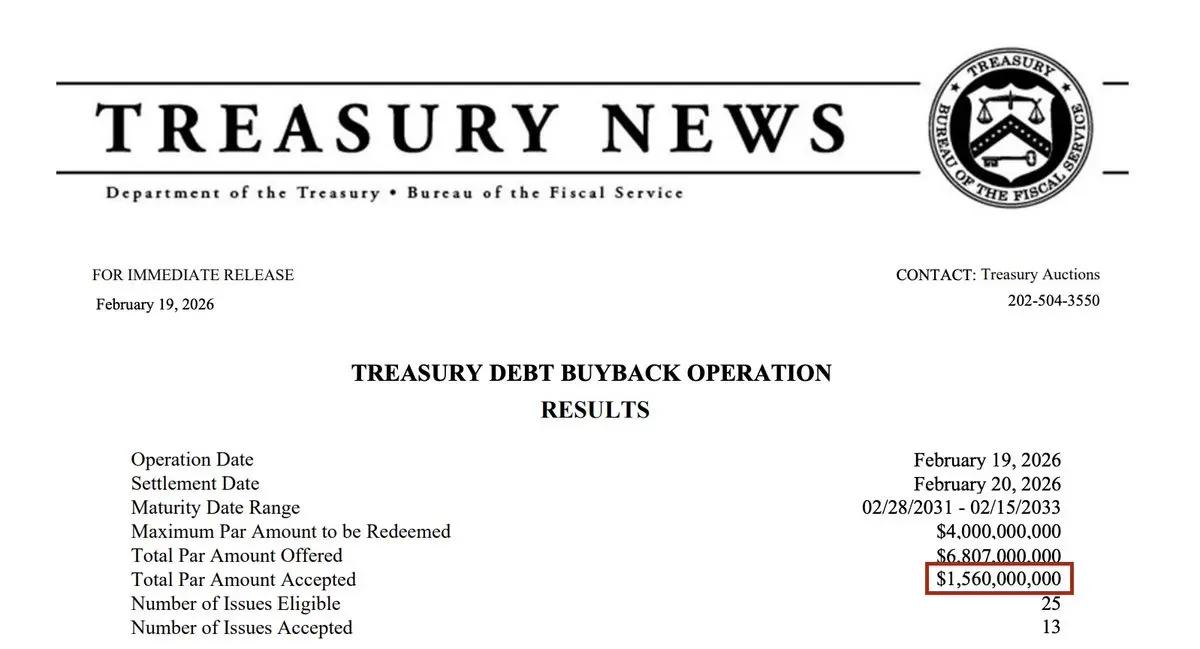
🚨 US TREASURY DEBT BUYBACK!
US Treasury has bought back $1,560,000,000 of debt today under its liquidity support program.
Why? Its purpose is to increase liquidity in the market and remove old illiquid bonds from the system.
US Treasury has bought back $1,560,000,000 of debt today under its liquidity support program.
Why? Its purpose is to increase liquidity in the market and remove old illiquid bonds from the system.
- Reward
- 2
- Comment
- Repost
- Share
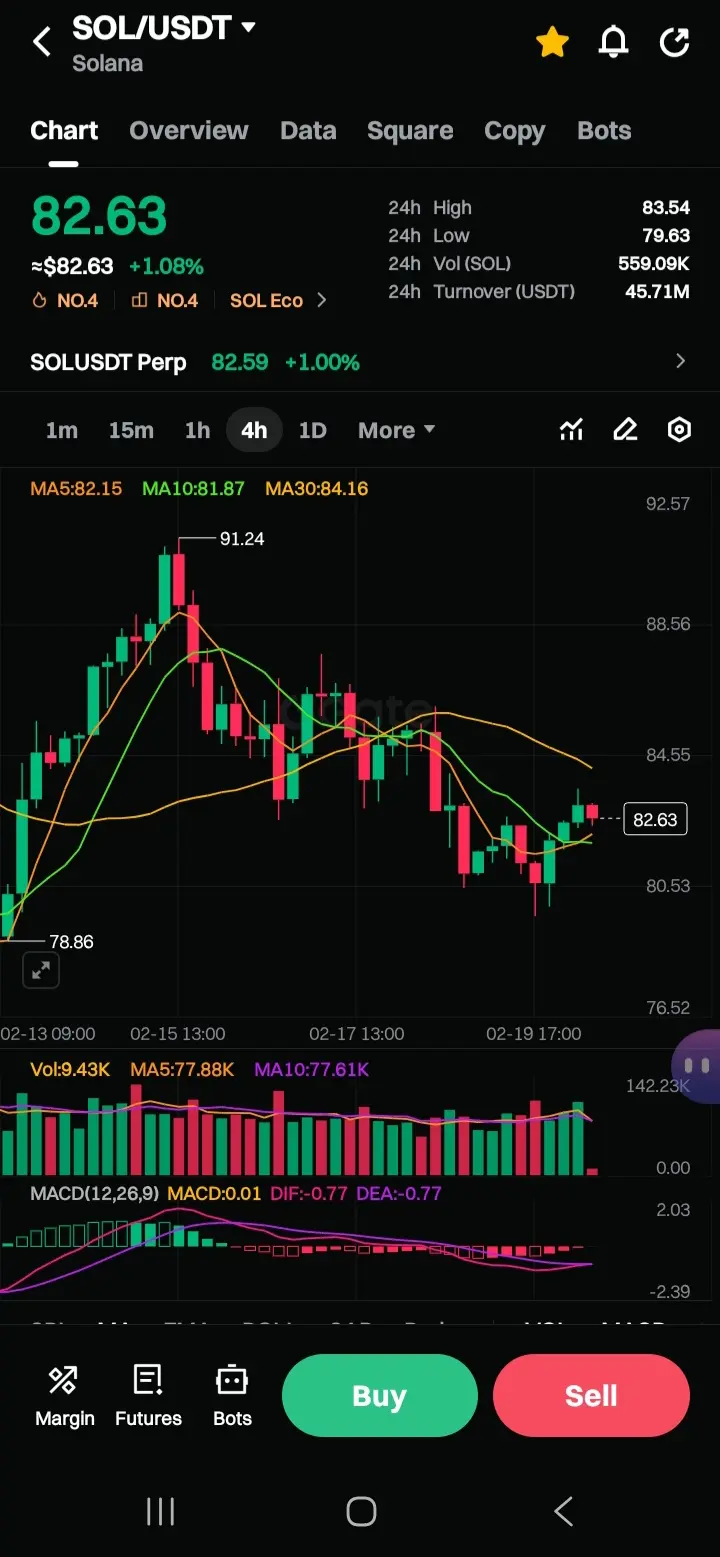
$SOL #SOLStandsStrong
This is an in-depth technical analysis of the SOL/USDT 4-hour (4h) chart provided. Based on the indicators visible (Moving Averages, Volume, and MACD), here is the breakdown of the current market structure.
1. Price Action & Trend Structure
The chart shows Solana (SOL) in a short-term corrective phase following a local peak.
Recent High: The price hit a resistance level around $91.24, followed by a series of lower highs and lower lows.
Current Support: Price found temporary footing near $79.00 - $80.00. It is currently attempting a minor bounce, trading at $82.63.
C
SOL1,51%

- Reward
- 3
- Comment
- Repost
- Share
Don't worry, I'll restock for you. I'm going out to deliver some takeout.
View Original
[The user has shared his/her trading data. Go to the App to view more.]
- Reward
- 2
- Comment
- Repost
- Share
- Reward
- like
- Comment
- Repost
- Share
#HongKongPlansNewVAGuidelines
Hong Kong’s recent announcement regarding new virtual asset (VA) guidelines marks a decisive moment in the region’s approach to digital finance, and it has far-reaching implications for the broader crypto ecosystem. Unlike past initiatives that left significant ambiguity, these guidelines aim to provide a clear, structured, and enforceable framework for projects, investors, and service providers operating in the territory. Hong Kong has long positioned itself as a global financial hub, and these reforms reflect its intention to not only protect investors but also
Hong Kong’s recent announcement regarding new virtual asset (VA) guidelines marks a decisive moment in the region’s approach to digital finance, and it has far-reaching implications for the broader crypto ecosystem. Unlike past initiatives that left significant ambiguity, these guidelines aim to provide a clear, structured, and enforceable framework for projects, investors, and service providers operating in the territory. Hong Kong has long positioned itself as a global financial hub, and these reforms reflect its intention to not only protect investors but also


- Reward
- 4
- 1
- Repost
- Share
neesa04:
To The Moon 🌕Crypto Market Structure & Trend Continuation Explained
85
- Reward
- like
- Comment
- Repost
- Share
- Reward
- 2
- Comment
- Repost
- Share
#USSECPushesCryptoReform
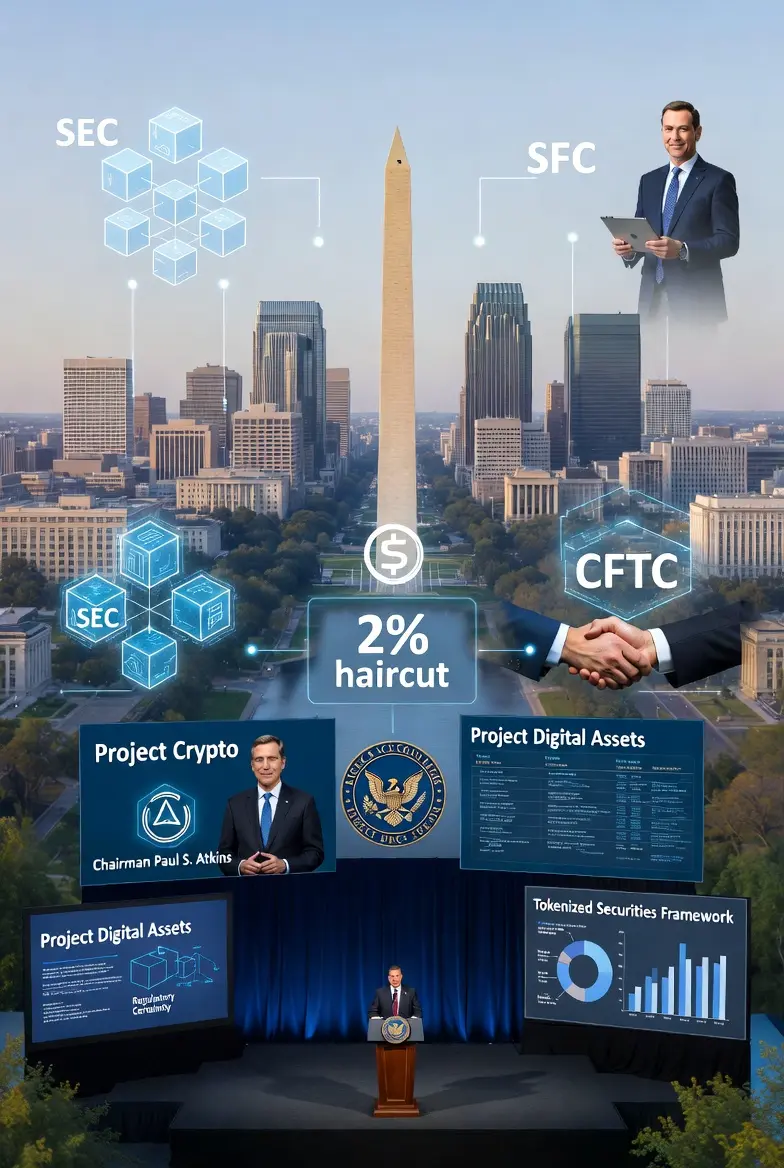
The SEC’s Historic 2026 Crypto Reform Push: From Enforcement to Enablement – A Full Breakdown
Just weeks into February 2026, the U.S. Securities and Exchange Commission (SEC) under Chairman Paul S. Atkins has unleashed a coordinated, pro-innovation wave of crypto reforms that is reshaping America’s digital asset landscape.
On February 13, 2026, the Division of Corporation Finance (under Director James Moloney) released its “Coming Attractions” statement, explicitly prioritizing crypto assets reform as the top agenda item. This was followed by Chairman Atkins’ detailed

- Reward
- 8
- 5
- Repost
- Share
repanzal :
:
2026 GOGOGO 👊View More
孔子
孔子
Created By@PiggyFromTheOcean
Listing Progress
100.00%
MC:
$71.05K
More Tokens
#GateSquare$50KRedPacketGiveaway 🚀 GateSquare’s $50K Red Packet Campaign: From Viral Event to Ecosystem Engine (2026 Update)
In a market where attention is fragmented and loyalty is fragile, Gate.io’s GateSquare $50,000 Red Packet Giveaway has evolved beyond a seasonal campaign — it has become a case study in scalable, community-driven growth.
With over 244,000+ participants, the initiative did more than distribute rewards. It activated network effects, strengthened platform stickiness, and reinforced GateSquare’s identity as a culture-first engagement hub within the broader Gate ecosystem.
�

- Reward
- 2
- 1
- Repost
- Share
MasterChuTheOldDemonMasterChu :
:
2026 Go Go Go 👊
- Reward
- 4
- Comment
- Repost
- Share
I found out that I can't resist old men acting cute.
Little boys acting cute, I don't pay any attention to—they just make me think "naughty kid" or "disgusting."
Usually, little boys don't dare to act cute around me because the power dynamic is obvious.
When old men act cute, I just accept it (here, anyone over 30 is called an old man).
Whenever an old man acts cute, I always think "whatever," "he won't last much longer anyway," "bide your time and things will calm down," or "don't let him latch onto me..."
View OriginalLittle boys acting cute, I don't pay any attention to—they just make me think "naughty kid" or "disgusting."
Usually, little boys don't dare to act cute around me because the power dynamic is obvious.
When old men act cute, I just accept it (here, anyone over 30 is called an old man).
Whenever an old man acts cute, I always think "whatever," "he won't last much longer anyway," "bide your time and things will calm down," or "don't let him latch onto me..."

- Reward
- 2
- Comment
- Repost
- Share
Participate in horse racing betting, complete tasks to earn horse racing tickets, and enjoy a million red envelope rain daily, sharing a prize pool of 100,000 USDT at the Gate 2026 Spring Festival Celebration. https://www.gate.com/competition/year-of-horse-2026?ref_type=165&utm_cmp=7EQB9Jba&ref=VGVBUL4KBQ
View Original
- Reward
- 2
- Comment
- Repost
- Share
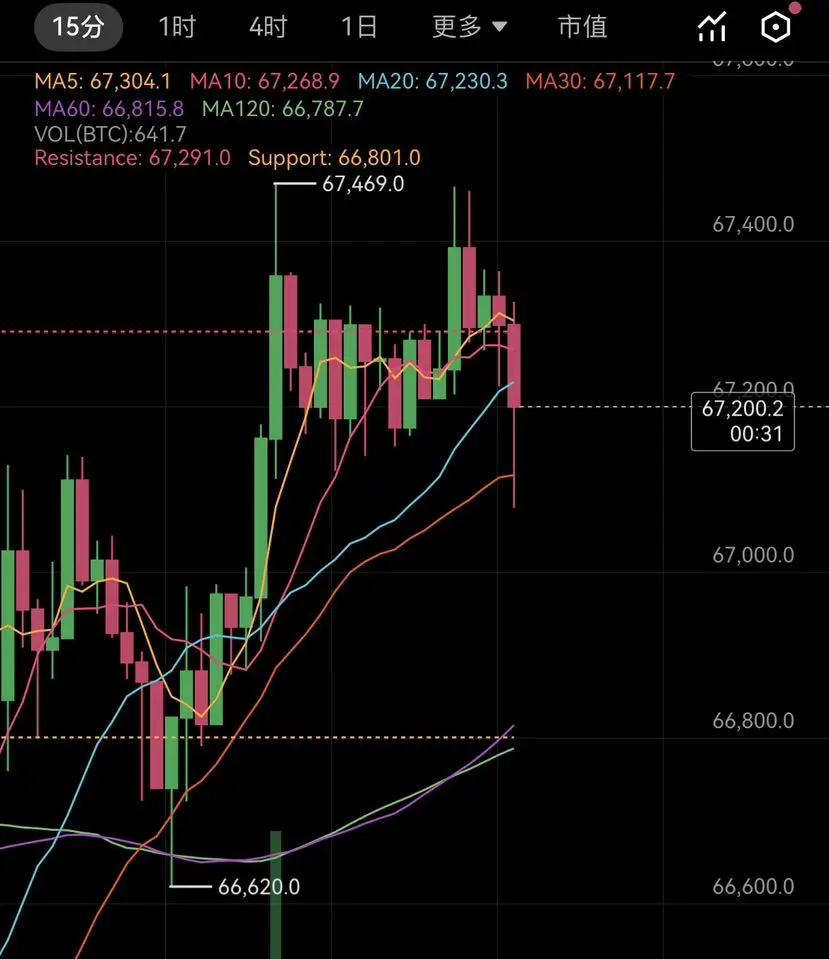
August 20th Bitcoin Public Outlook
The previous support level has held during the pullback. Standing firm above 66,790 and breaking out signals a bullish flag pattern; the W bottom neckline at 67,320 is the key dividing line.
• Bullish conditions: Break above 67,320 with volume → W bottom confirmed, rebound target 68,360–69,300; only after breaking 68,490 can we look higher
• Bearish risk: Fall back inside the flag pattern → test 65,300 again, if support fails, continue to decline
Trading suggestions:
• Long positions: Enter on volume breakout above 67,320 on the right side
• Short positions:
View OriginalThe previous support level has held during the pullback. Standing firm above 66,790 and breaking out signals a bullish flag pattern; the W bottom neckline at 67,320 is the key dividing line.
• Bullish conditions: Break above 67,320 with volume → W bottom confirmed, rebound target 68,360–69,300; only after breaking 68,490 can we look higher
• Bearish risk: Fall back inside the flag pattern → test 65,300 again, if support fails, continue to decline
Trading suggestions:
• Long positions: Enter on volume breakout above 67,320 on the right side
• Short positions:
- Reward
- 1
- Comment
- Repost
- Share
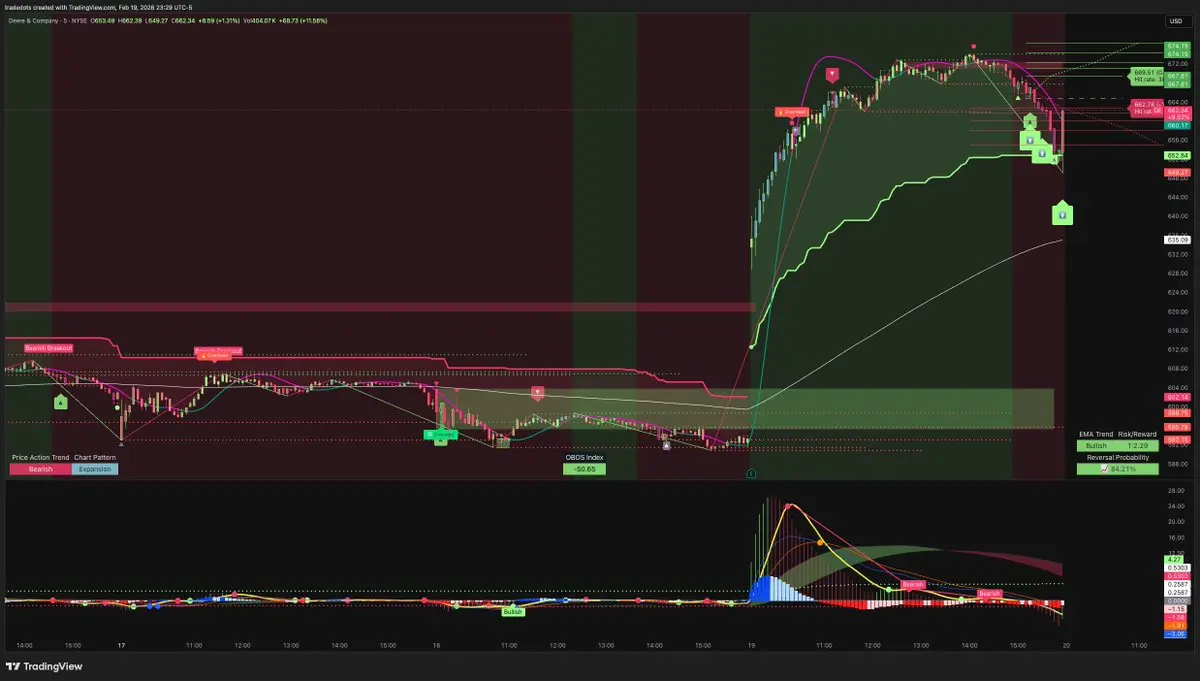
$DE: Record Peaks in Machinery
Sentiment: Very Positive
'''Deere continues to reach record highs, reflecting bullish momentum tied to agricultural and construction sectors.'''
Insight: A sustained demand boost signals long-term scalability for machinery investments.
Sentiment: Very Positive
'''Deere continues to reach record highs, reflecting bullish momentum tied to agricultural and construction sectors.'''
Insight: A sustained demand boost signals long-term scalability for machinery investments.
- Reward
- 2
- Comment
- Repost
- Share
Load More
Join 40M users in our growing community
⚡️ Join 40M users in the crypto craze discussion
💬 Engage with your favorite top creators
👍 See what interests you
Trending Topics
View More249.16K Popularity
872.72K Popularity
10.63M Popularity
99.65K Popularity
521.6K Popularity
Hot Gate Fun
View More- MC:$2.51KHolders:20.12%
- MC:$2.48KHolders:10.12%
- MC:$0.1Holders:10.00%
- MC:$2.44KHolders:10.00%
- MC:$2.44KHolders:10.00%
News
View MoreHyperliquid Policy Center CEO: Opposes mandatory monitoring of non-custodial developers; financial privacy is a fundamental right
17 m
If Bitcoin breaks through $70,000, the total liquidation strength of mainstream CEXs' short positions will reach 606 million.
18 m
BTC Breaks Through 68,000 USDT
22 m
Glassnode: Bitcoin recently repeatedly surged past $70,000, with weak liquidity putting pressure on the rebound
23 m
Strategy CEO: Basel Accord impacts bank participation in Bitcoin; the U.S. should reassess capital provisioning
41 m
Pin