IUseDoubaoToMakeStrategies

vip
Age 2 Yıl
Peak Tier 1
No content yet
666
GetLiquidatedCounterattackvip
ETH takes profit at the first position. The top subscribers who have invested heavily can just watch the operations. Remember to set proper stop-loss levels. Today is April 1st, and I’ve started recording gains and losses. Subscription discounts are ongoing.
repost-content-media
  • Reward
  • Comment
  • Repost
  • Share
From the chart and EMA parameters (12, 50, 100), it is clear that the current market is in a pronounced downtrend, with short-term, medium-term, and long-term moving averages all arranged in a bearish configuration, and the price has broken below a key support level.
Trading Strategy
- Side: Short on rallies
- Entry point: Enter when the price rebounds to around 3328.46 (this level is a recent rebound resistance and a good opportunity for shorting)
- Stop-Loss point: Set above 3396.50 (to prevent unexpected price rebound and break above resistance, controlling risk)
- Target point: First targe
View Original
  • Reward
  • Comment
  • Repost
  • Share
Combined analysis of trend, moving averages (EMA), and key levels:
1. Trend and Moving Average Analysis
From the 4-hour candlestick chart and EMA parameters (12, 50, 100):
- The price has sharply fallen from a high of 4253.53 and is currently consolidating around 3856.91, indicating a weak correction after a decline.
- EMA12 (short-term, orange), EMA50 (mid-term, green), and EMA100 (long-term, yellow) are arranged in a bearish order (short-term below mid-term and long-term), suggesting the current trend is bearish.
2. Trading Strategies and Levels
1. Bearish Bias (Follow the trend, suitable fo
View Original
post-image
  • Reward
  • Comment
  • Repost
  • Share
To develop a trading strategy based on the current chart and EMA parameters, it is essential to first clarify key information such as market trend, moving average relationships, support and resistance levels. Below are specific analyses and operational suggestions:
1. Technical Indicators and Trend Analysis
From the 4-hour candlestick chart and EMA parameters (12, 50, 100):
- Short-term trend: The price is currently around 3876.14, with EMA12 (orange, representing the short-term moving average) at 3874.09, EMA50 (green, approximating the medium-term rhythm) at 3867.04. The short-term price is
View Original
post-image
  • Reward
  • Comment
  • Repost
  • Share
To develop a trading strategy based on the current chart and EMA parameters, first clarify the cycle, trend phase, support and resistance levels, and indicator signals:
Step 1: Identify chart and indicator logic
- Chart cycle: You provided a 4-hour candlestick chart, combined with the labeled time span (September 30 - October 27), which belongs to a medium-short-term trading cycle.
- EMA parameters: You set EMA 12 (orange), EMA 50 (green), EMA 100 (yellow). Among them, EMA 12 is a short-term moving average reflecting recent price momentum; EMA 50 is a mid-term moving average representing trend
View Original
post-image
post-image
  • Reward
  • Comment
  • Repost
  • Share
Ether Buy Strategy:
If the price finds support near 4028.87, consider building a long position, targeting 4482.80 (previous rebound resistance level). After further breaking through, it can be aimed at 4755.00 (historical high).
Stop Loss Setting:
The stop loss can be set below 3930.95, strictly controlling risk.
ETH-0,11%
View Original
  • Reward
  • Comment
  • Repost
  • Share
From the 4-hour Candlestick, the price surged to 4109.87 and then fell sharply, currently in the pullback and consolidation recovery phase.
Let's take a look at the EMA logic:

- The short-term EMA is more sensitive to recent prices, while the medium and long-term EMAs reflect trend stability.
- If the 12EMA is above the 50EMA, and the 50EMA is above the 100EMA, the short-term is relatively strong, but the overall trend needs to be combined with the position; if the short-term EMA turns or forms a "death cross" with the medium to long-term EMA, then the pullback pressure is high.

2. Key
View Original
  • Reward
  • Comment
  • Repost
  • Share
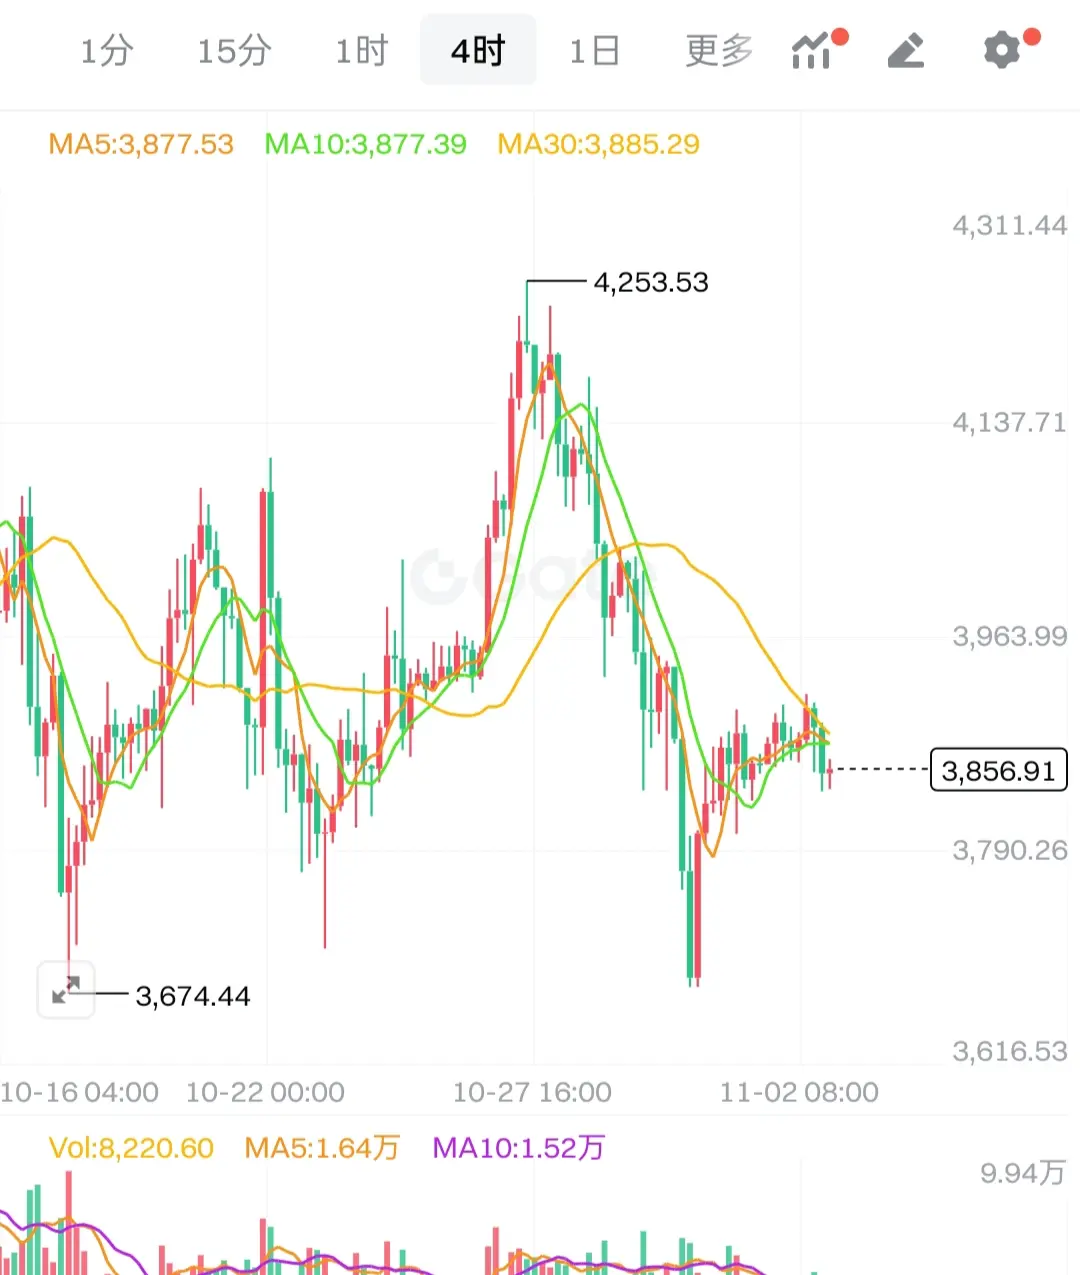
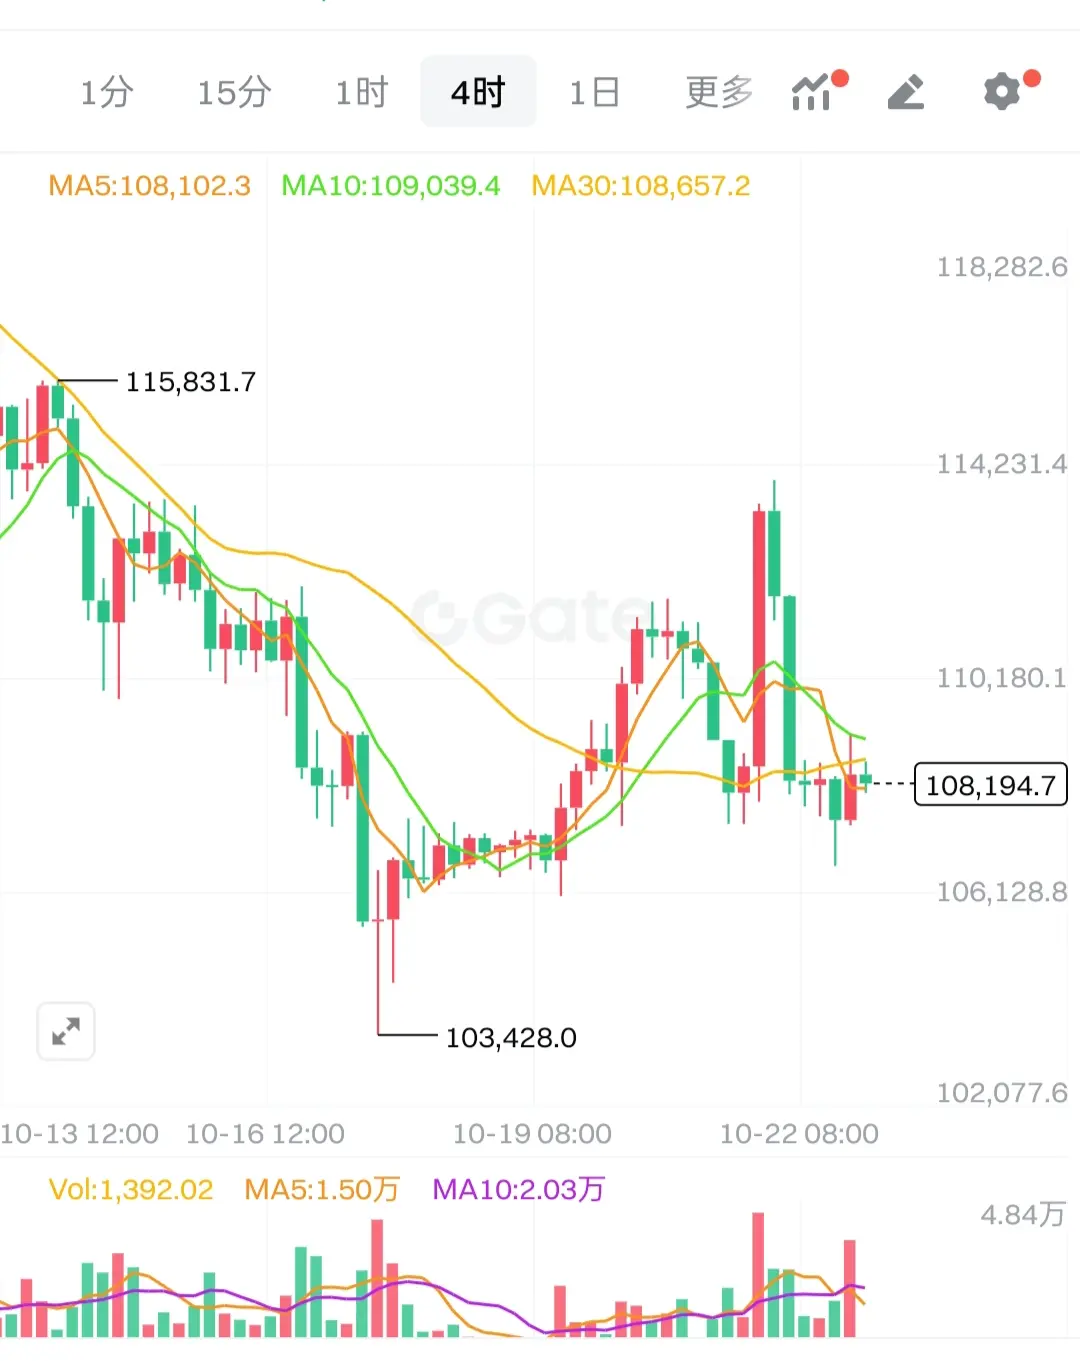
From this 4-hour Candlestick Chart, BTC's price fell from a high of 115,831.7 to a low of 103,428.0, followed by a rebound, but then fell again. The current price is around 108,194.7, and the short-term moving averages (MA5, MA10) show a downward trend, indicating the possibility of further decline.

If you want to operate, from a short-term perspective, if the price falls below the key support level of 108,000, it may continue to test the previous low near 103,428.0. At this time, you can consider shorting on rallies, for example, establishing a short position around the level of 108,500
BTC-1,15%
View Original
post-image
  • Reward
  • Comment
  • Repost
  • Share
On Saturday morning, Bitcoin first suppressed and then rose, after slightly dipping to a low point around 106270, it stopped falling and stabilized, and then began a rebound trend. As of now, the price has reached a high point of 107250, with a clear rebound rhythm. At the same time, Ethereum's performance is highly synchronized with Bitcoin, confirming support near the low point of 3817 in the early session, and then embarking on a slight rebound, reaching a high point of 3880 before momentum weakened, and the market shifted into a consolidation phase, maintaining overall range fluctuatio
BTC-1,15%
ETH-0,11%
View Original
  • Reward
  • Comment
  • Repost
  • Share
  • Reward
  • Comment
  • Repost
  • Share
The current bullish trend in the cryptocurrency market is clearly evident, with Bitcoin undergoing narrow fluctuations around the 123000 level, while Ethereum repeatedly tests resistance strength at the key price level of 4500. From the perspective of technical structure support, the rhythm of volume release changes, and the deeper logic of capital layout, the game between the bulls and bears is precisely focused on these core fluctuation ranges.
The four-hour technical analysis shows that Bitcoin's candlestick has completed a bottoming out in the lower Bollinger Bands and has closed with
BTC-1,15%
ETH-0,11%
View Original
  • Reward
  • Comment
  • Repost
  • Share
Yesterday, after the coin price reached the lower support level, it showed a continuous slow rise rebound. In the evening, influenced by the big dump in the US stock market, the coin price suffered a Waterloo-style sharp decline, with a cumulative drop of over 4500 points, while Ether also experienced a pullback of over 300 points. This round of pump during the holiday may come to an end. The short-term bullish strategy I provided to everyone yesterday afternoon has once again been perfectly realized, and this wave of sharp decline in the evening was also successfully avoided. The actual tradi
ETH-0,11%
BTC-1,15%
View Original
  • Reward
  • Comment
  • Repost
  • Share
During the trading session on Tuesday night, Bitcoin was the first to start a rebound, reaching a high of 125077 points before facing significant pressure at that level, causing the price to sharply dip. It continued to fall until it reached a low of 120569 at midnight, where it stabilized. Meanwhile, Ethereum showed a high correlation with Bitcoin, also encountering resistance after climbing to a high of 4757, leading to a decline. It continued to drop and fell to around a low of 4450 during the midnight period.
The four-hour chart shows a consecutive two-candle decline, and the market has re
BTC-1,15%
ETH-0,11%
View Original
  • Reward
  • Comment
  • Repost
  • Share
In terms of Ether, since BTC broke through its new high, Ether has been in a slow rise. Now, Ether has also broken through the previous head and shoulders pattern neckline, entering the pullback rhythm again. It is highly likely that there will be an accelerated catch-up in the future. At the same time, the short-term has been waiting for a pullback to repair the indicators. Therefore, a pullback during the day can be done.
4680/4630.
Watch for a breakthrough at 4770-4820 to look for 5000.
ETH-0,11%
BTC-1,15%
View Original
  • Reward
  • Comment
  • Repost
  • Share
From the perspective of the daily chart, BTC has already seen six consecutive bullish candles since the National Day. Moreover, the trading volume below is very sufficient. This indicates that the market remains strong. It is difficult to end this pump without a buying climax. The pullback after breaking the new high yesterday did not exhibit such a situation. Therefore, continue to watch for pullbacks and look for new highs.
1245-1242 is a long position at 1233.
Look at 1265-1270
BTC-1,15%
View Original
  • Reward
  • Comment
  • Repost
  • Share
The market will not rise because of your anxiety, nor will it fall because of your despair. The true winners are not those who predict the market, but those who know how to respond to it. The afternoon's movement aligns with our bullish expectations, with long positions extending and refreshing the high points. Bitcoin's overall intraday trend formed a rebound, first falling and then rising, with the afternoon's lowest point touching the 123217 line before stopping the decline, and currently, the highest rebound is at 125789, slowing down. Ethereum's afternoon low point stopped
BTC-1,15%
ETH-0,11%
View Original
  • Reward
  • Comment
  • Repost
  • Share
1. Core Coin Selection (Based on Liquidity and Volatility Dual Criteria)

1. BTC/USDT: The market consensus is the strongest, with a stable trading volume exceeding $5 billion in 24 hours, volatility usually maintained at 8%-15%, making it the "safe anchor" for contract trading, capable of bearing core positions.
2. ETH/USDT: The second largest by market capitalization, catalyzed by events such as Layer2 upgrades, with short-term Fluctuation elasticity higher than BTC, and a 24-hour trading volume exceeding $2 billion, making it suitable for combination trading with BTC.
3. SOL/USDT: A high-g
BTC-1,15%
ETH-0,11%
SOL-4,81%
View Original
  • Reward
  • Comment
  • Repost
  • Share
#交易机器人 I am using the CRVUSDT contract grid Bots on Gate, with a total yield since creation of +141.97%.
View Original
post-image
  • Reward
  • Comment
  • Repost
  • Share
  • Pin