The price of Bitcoin is currently on a downward trajectory since it faced resistance at $30K in April. However, there are notable support levels that may prevent further decline.
Technical Analysis
By: Edris
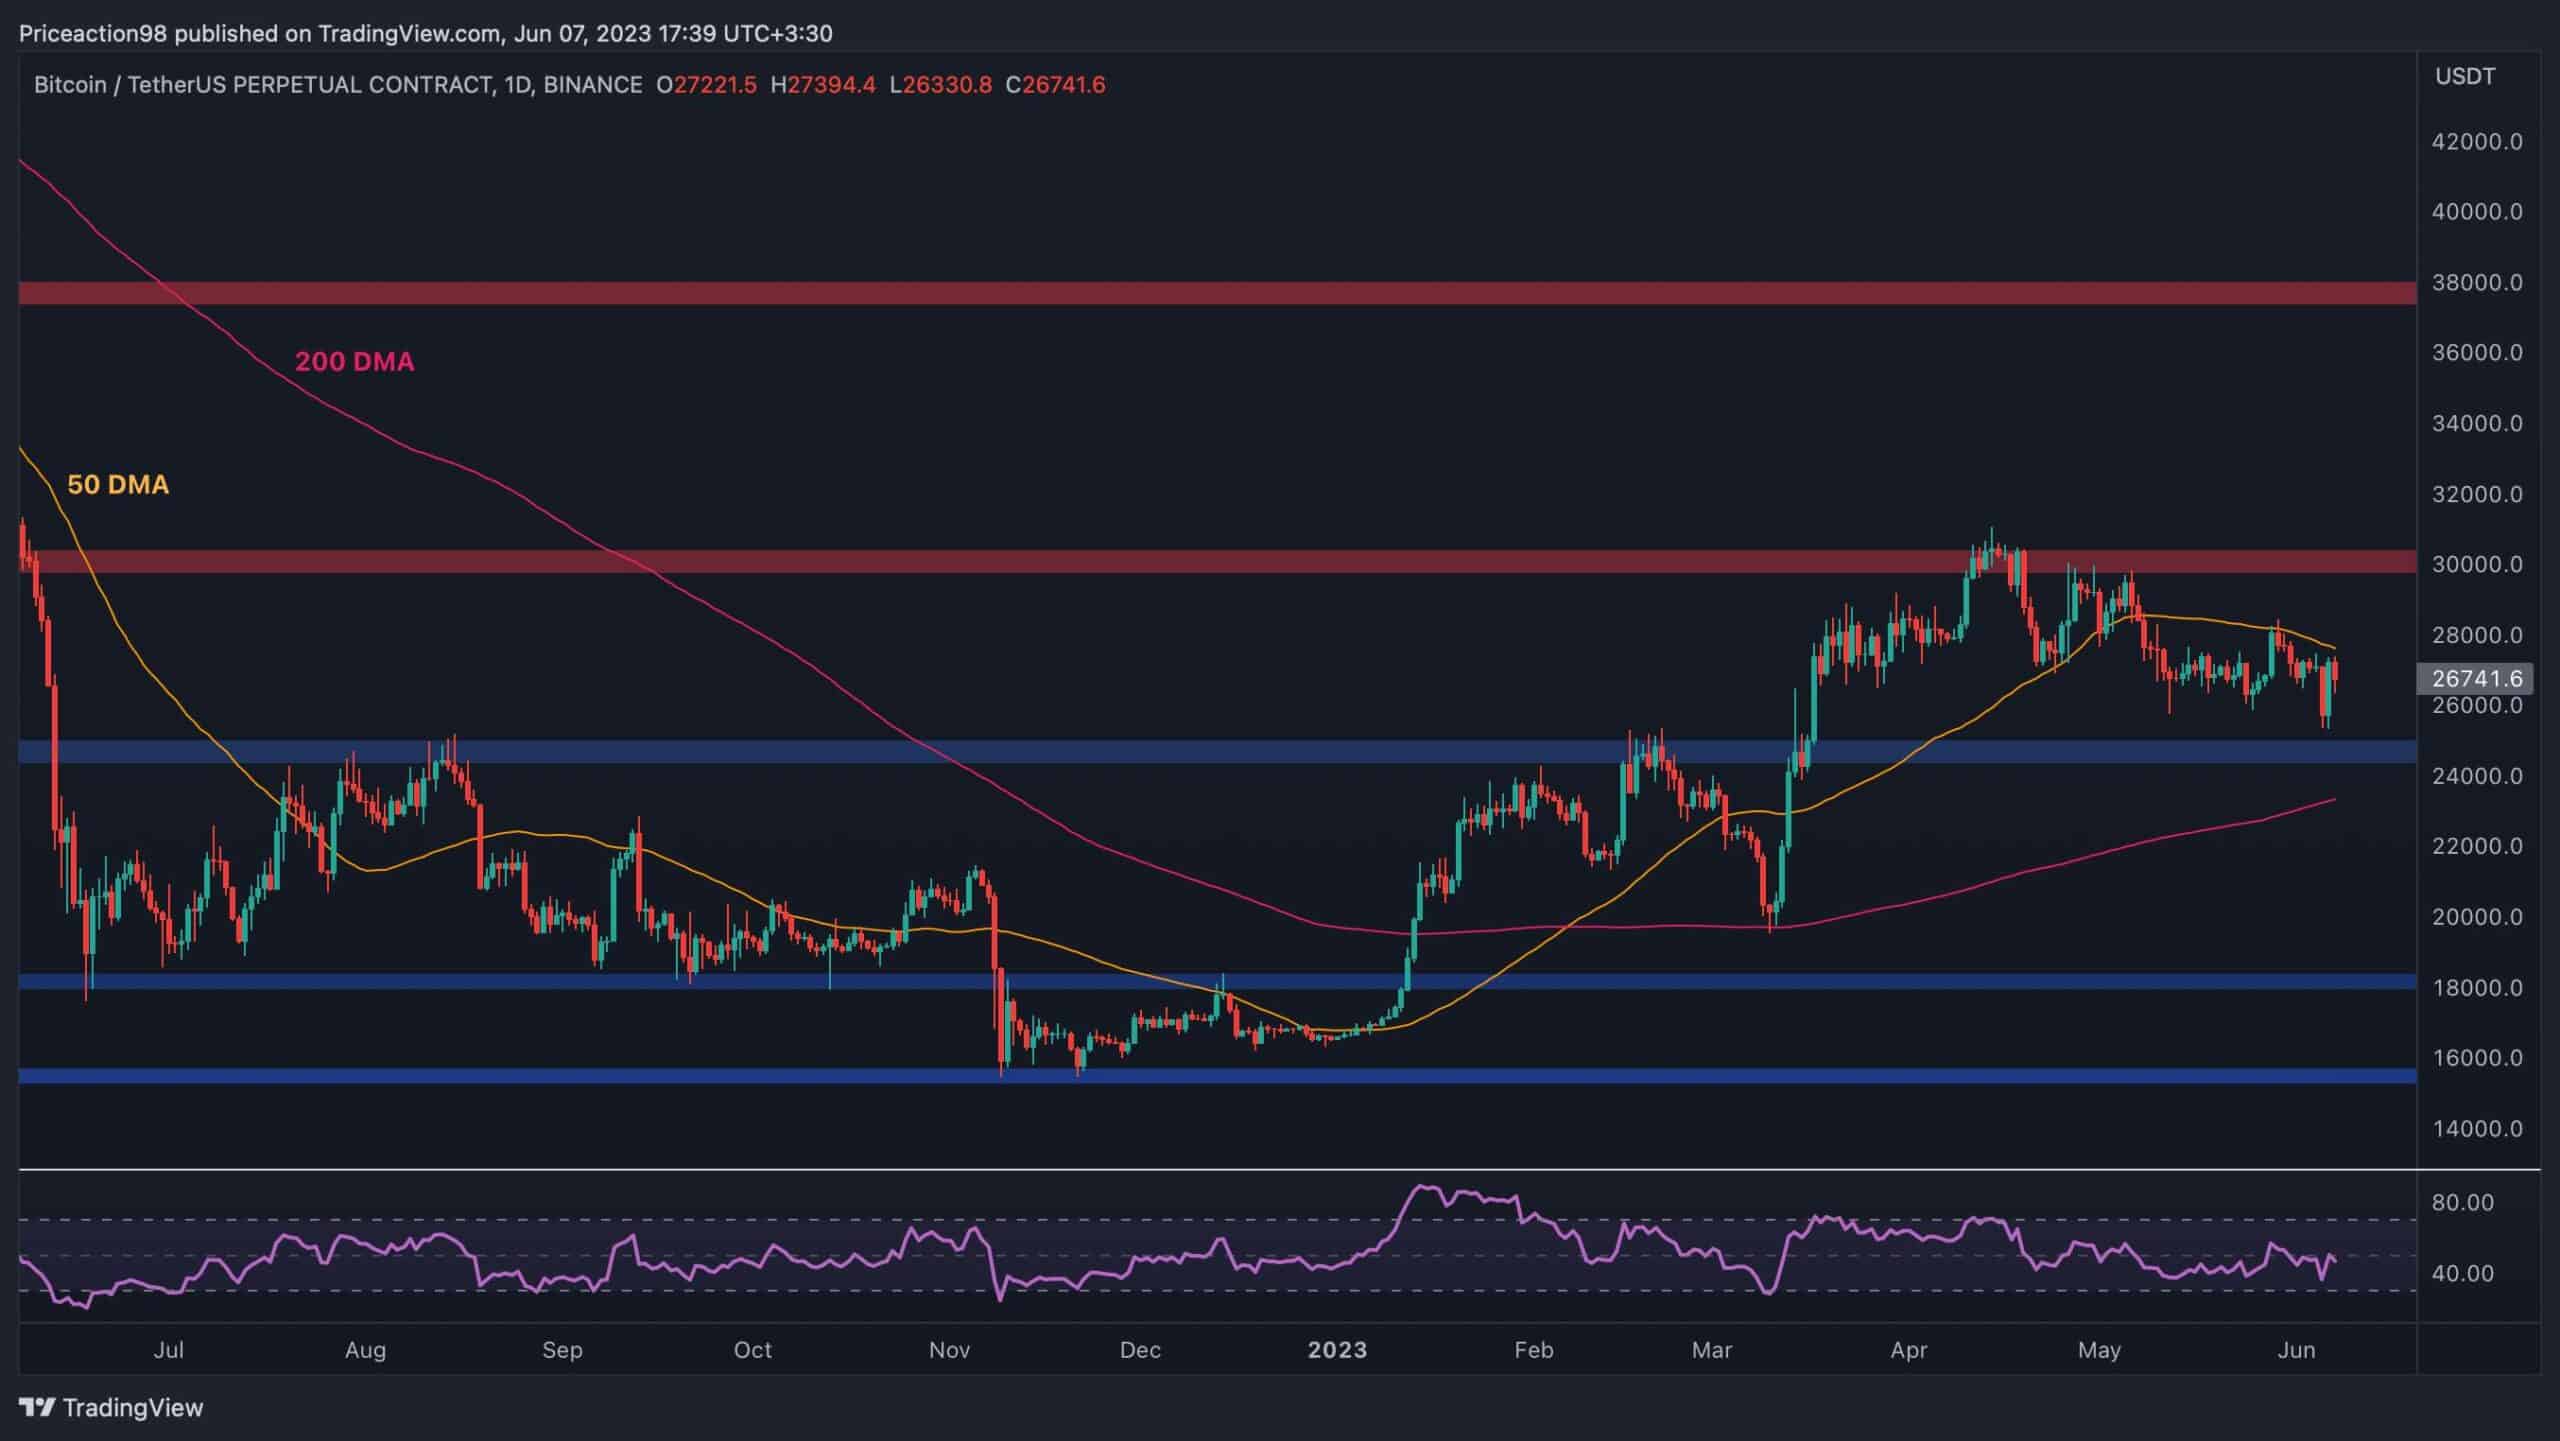
The Daily Chart:
On the daily timeframe, the Bitcoin price has consistently formed lower highs and lows in the past couple of months. The 50-day moving average acted as a strong resistance, causing a downward rejection near the $28K level.
Following yesterday’s rebound, the price is testing the 50-day moving average again. A bullish breakout would result in a rally towards the $30K level, while another rejection would lead to a drop-down to the $25K support level and the key 200-day moving average located around the $24K mark.
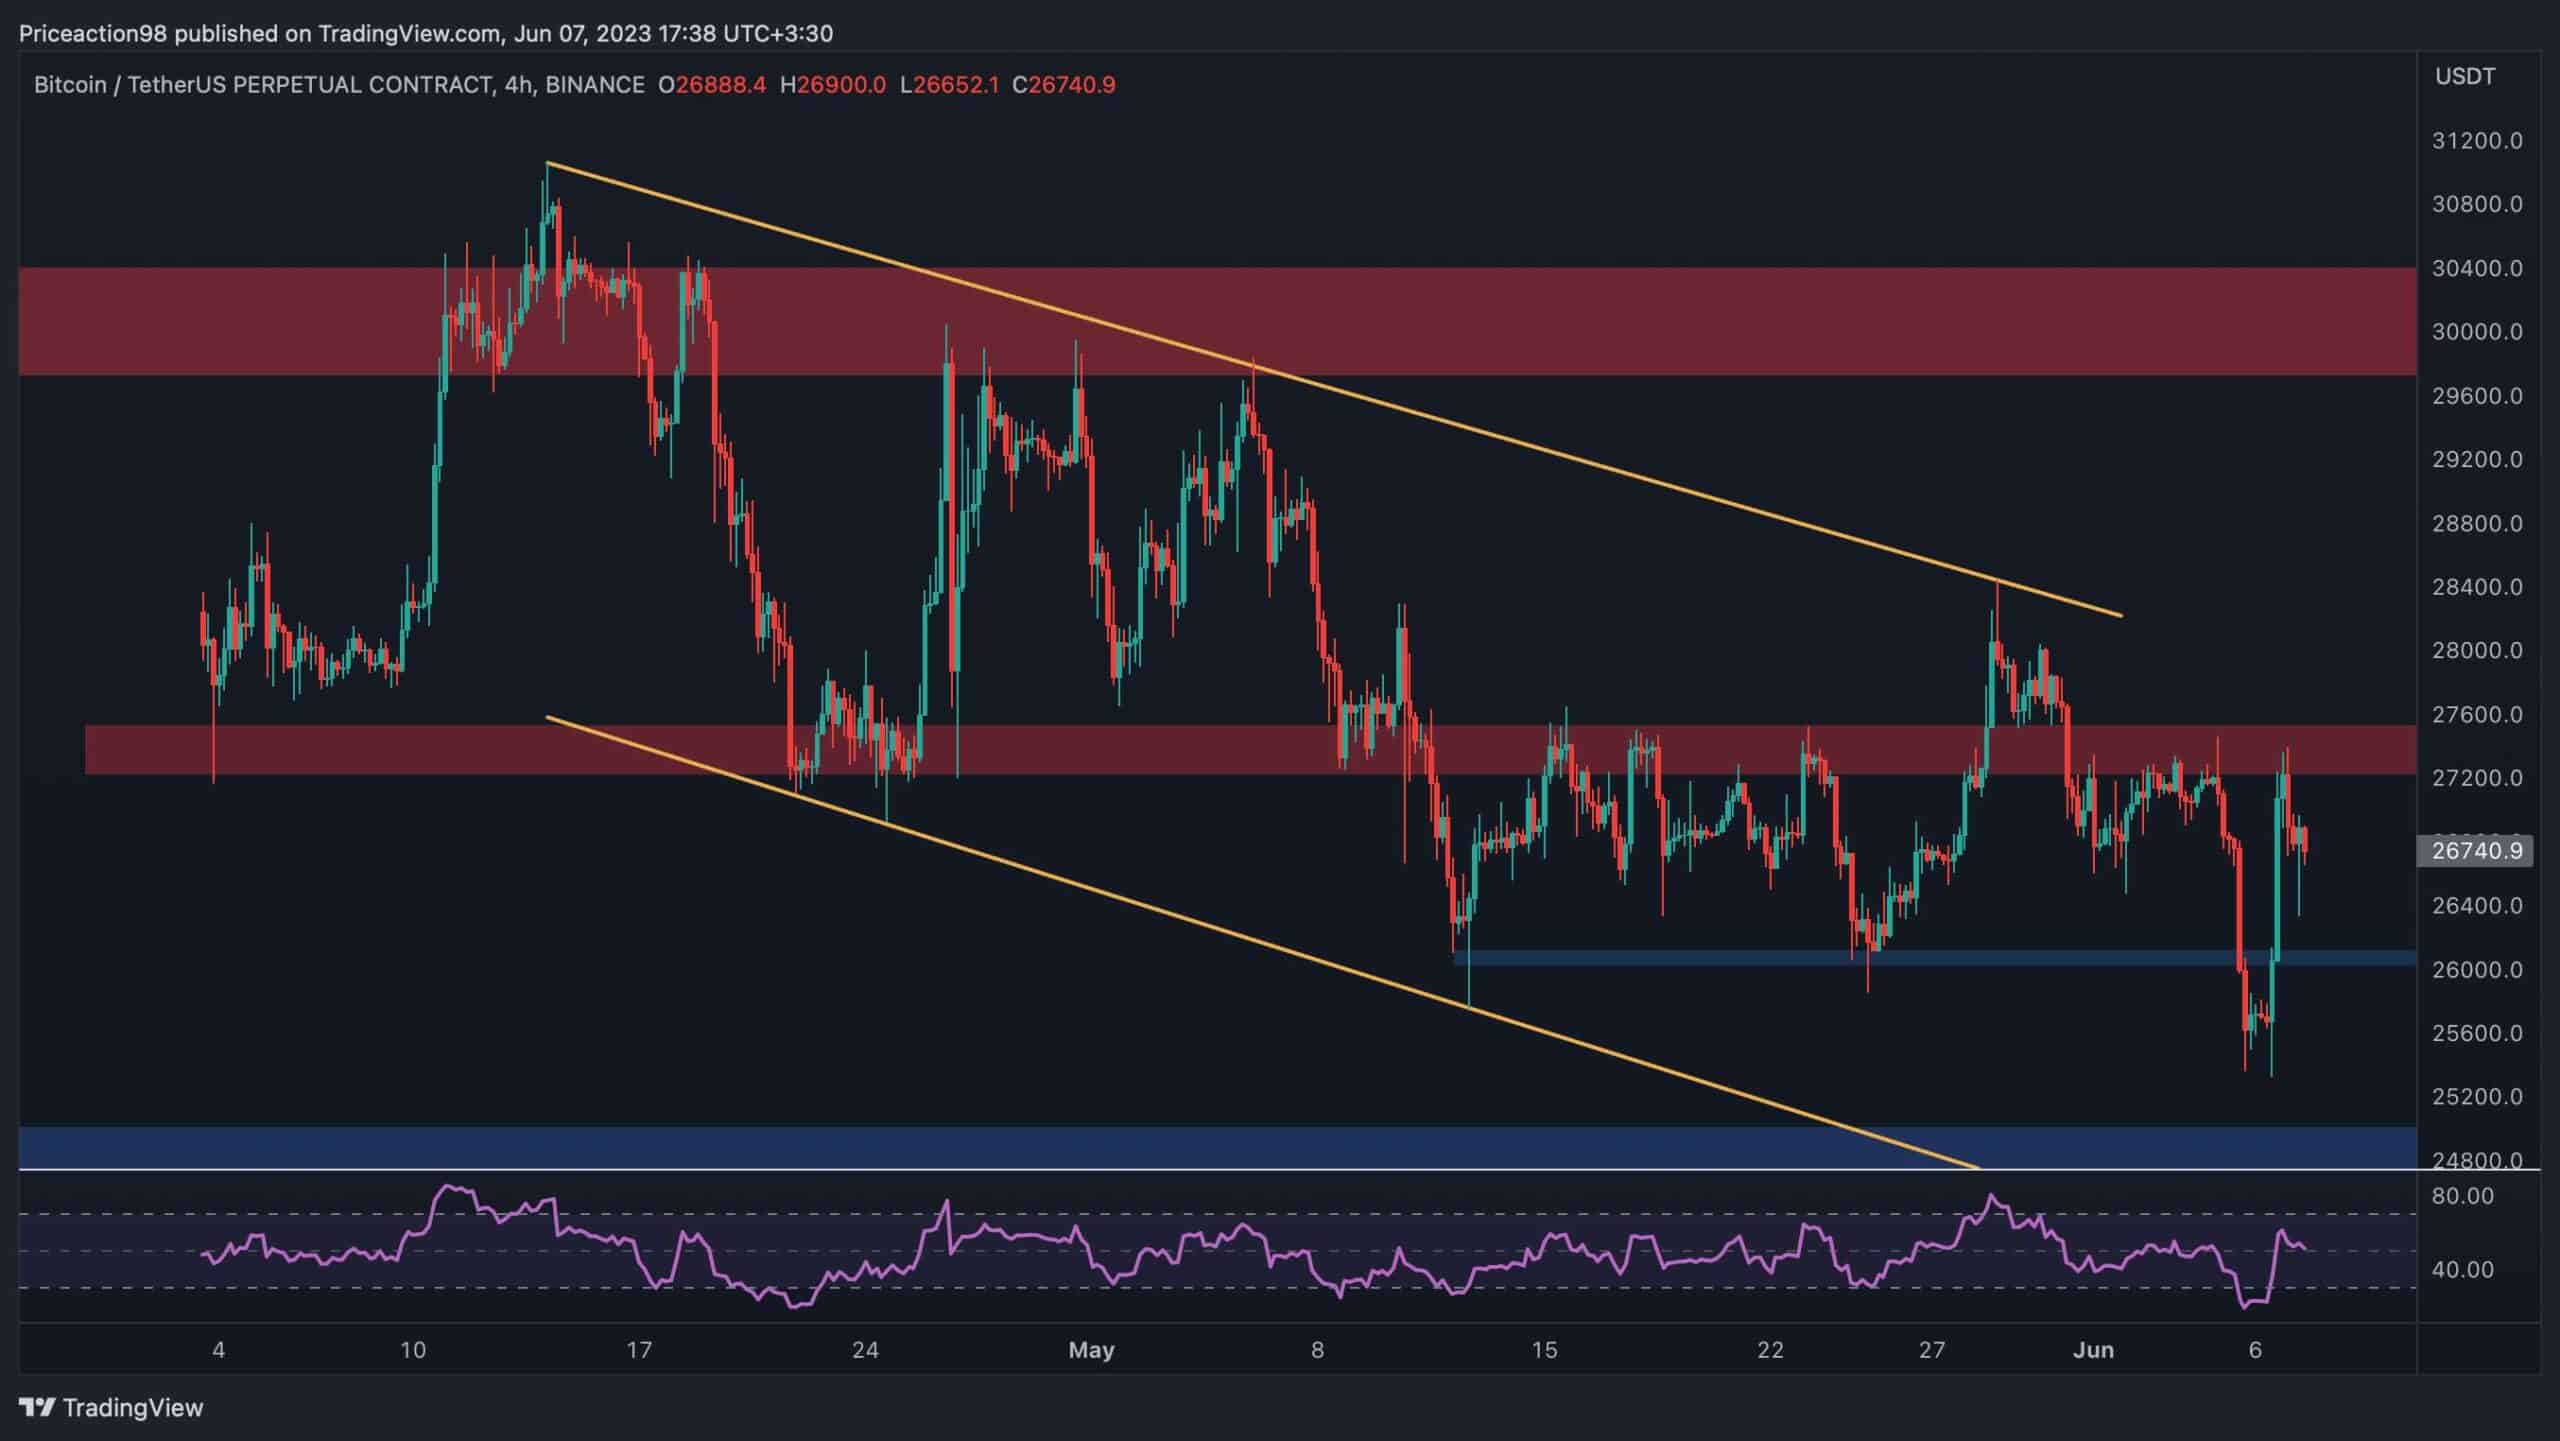
 Source: TradingView### The 4-Hour Chart:
Looking at the 4-hour timeframe, it is clear that the Bitcoin price faced a significant barrier at the $27,500 resistance level and experienced a sharp decline thereafter. The short-term support level at $26K has also been breached, indicating a continued downward movement with strong momentum.
However, the BTC price has now reversed following the RSI’s overbought signal and is currently retesting the $27,500 resistance area. If it breaks above this point, the descending channel is likely to be broken as well, paving the way for the market to rise toward the $30K level once again.
 Source: tradingVIew## On-chain Analysis
By Shayan
While many were optimistic about the beginning of a bull market, a wave of fear and uncertainty spread through the industry because of what happened lately. On Monday, the Securities and Exchange Commission (SEC) filed a lawsuit against Binance, leading to a 5% drop in the price of Bitcoin. The next day, it field a lawsuit against Coinbase as well.
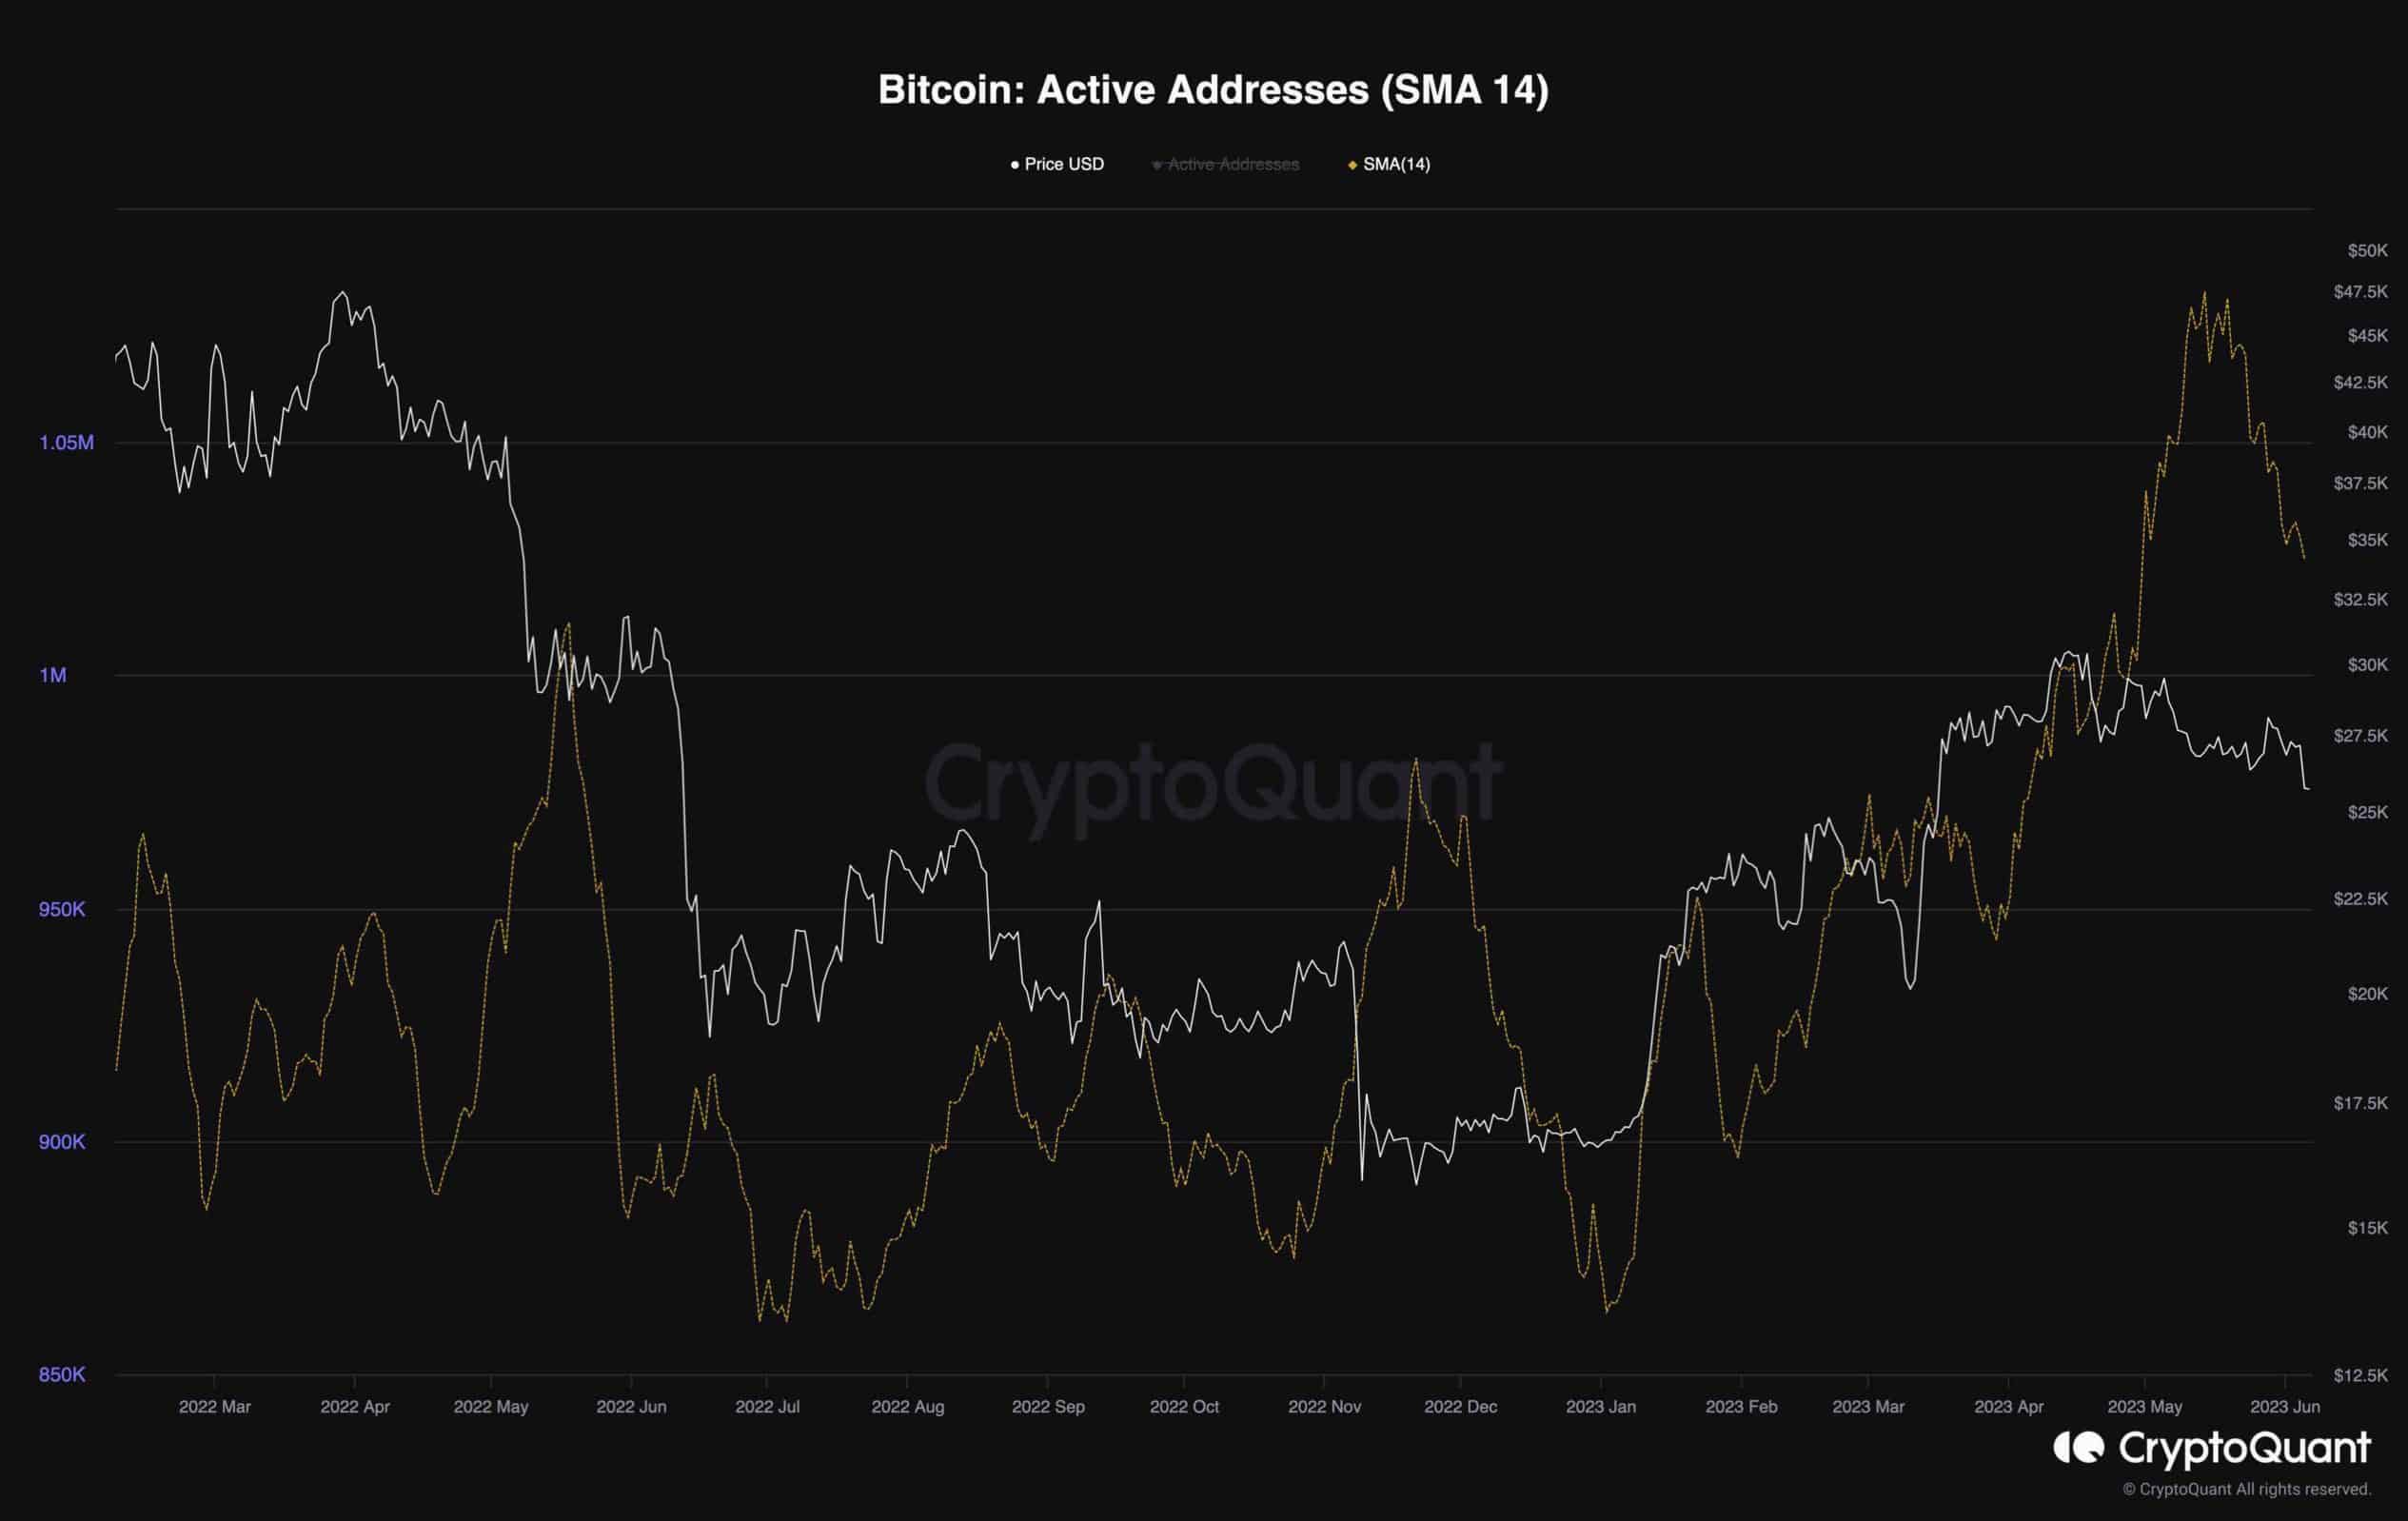
A graph representing the Active Addresses metric, which indicates the number of participants actively engaging with Bitcoin’s network alongside the price, provides valuable insights. The chart demonstrates an upward trend, signaling a positive outlook for network activity and the demand for Bitcoin.
Unfortunately, this trend has recently reversed, and the metric is now experiencing a significant decline, primarily attributed to the recent FUD.
 Source: CryptoQuant
Tuyên bố miễn trừ trách nhiệm: Thông tin trên trang này có thể đến từ bên thứ ba và không đại diện cho quan điểm hoặc ý kiến của Gate. Nội dung hiển thị trên trang này chỉ mang tính chất tham khảo và không cấu thành bất kỳ lời khuyên tài chính, đầu tư hoặc pháp lý nào. Gate không đảm bảo tính chính xác hoặc đầy đủ của thông tin và sẽ không chịu trách nhiệm cho bất kỳ tổn thất nào phát sinh từ việc sử dụng thông tin này. Đầu tư vào tài sản ảo tiềm ẩn rủi ro cao và chịu biến động giá đáng kể. Bạn có thể mất toàn bộ vốn đầu tư. Vui lòng hiểu rõ các rủi ro liên quan và đưa ra quyết định thận trọng dựa trên tình hình tài chính và khả năng chấp nhận rủi ro của riêng bạn. Để biết thêm chi tiết, vui lòng tham khảo
Tuyên bố miễn trừ trách nhiệm.