#Gate广场AI测评官
#Gate廣場AI評測官|20天打卡
財富大門鑰匙給你:
2026啟程3650天守倉|BTC/ETH/大門現貨囤底·合約輕倉博弈
堅定預判2036年必達:BTC 368888美元 ETH 48888美元 大門 888.88美元
專注對沖套利·微利複利,ETH/大門增速領跑BTC,嚴控風控穿越牛熊
今日已堅持 20天,時間進度:0.548%,倒計時剩餘 3630天
比特幣支撐阻力清晰,GateAI輔助研判更精準
理念:複利放大器,風控生命線
內容為個人觀點,不構成投資建議
#十年守仓人 #BTC368888 #ETH48888 #大门888.88
查看原文#Gate廣場AI評測官|20天打卡
財富大門鑰匙給你:
2026啟程3650天守倉|BTC/ETH/大門現貨囤底·合約輕倉博弈
堅定預判2036年必達:BTC 368888美元 ETH 48888美元 大門 888.88美元
專注對沖套利·微利複利,ETH/大門增速領跑BTC,嚴控風控穿越牛熊
今日已堅持 20天,時間進度:0.548%,倒計時剩餘 3630天
比特幣支撐阻力清晰,GateAI輔助研判更精準
理念:複利放大器,風控生命線
內容為個人觀點,不構成投資建議
#十年守仓人 #BTC368888 #ETH48888 #大门888.88

- 讚賞
- 1
- 留言
- 轉發
- 分享
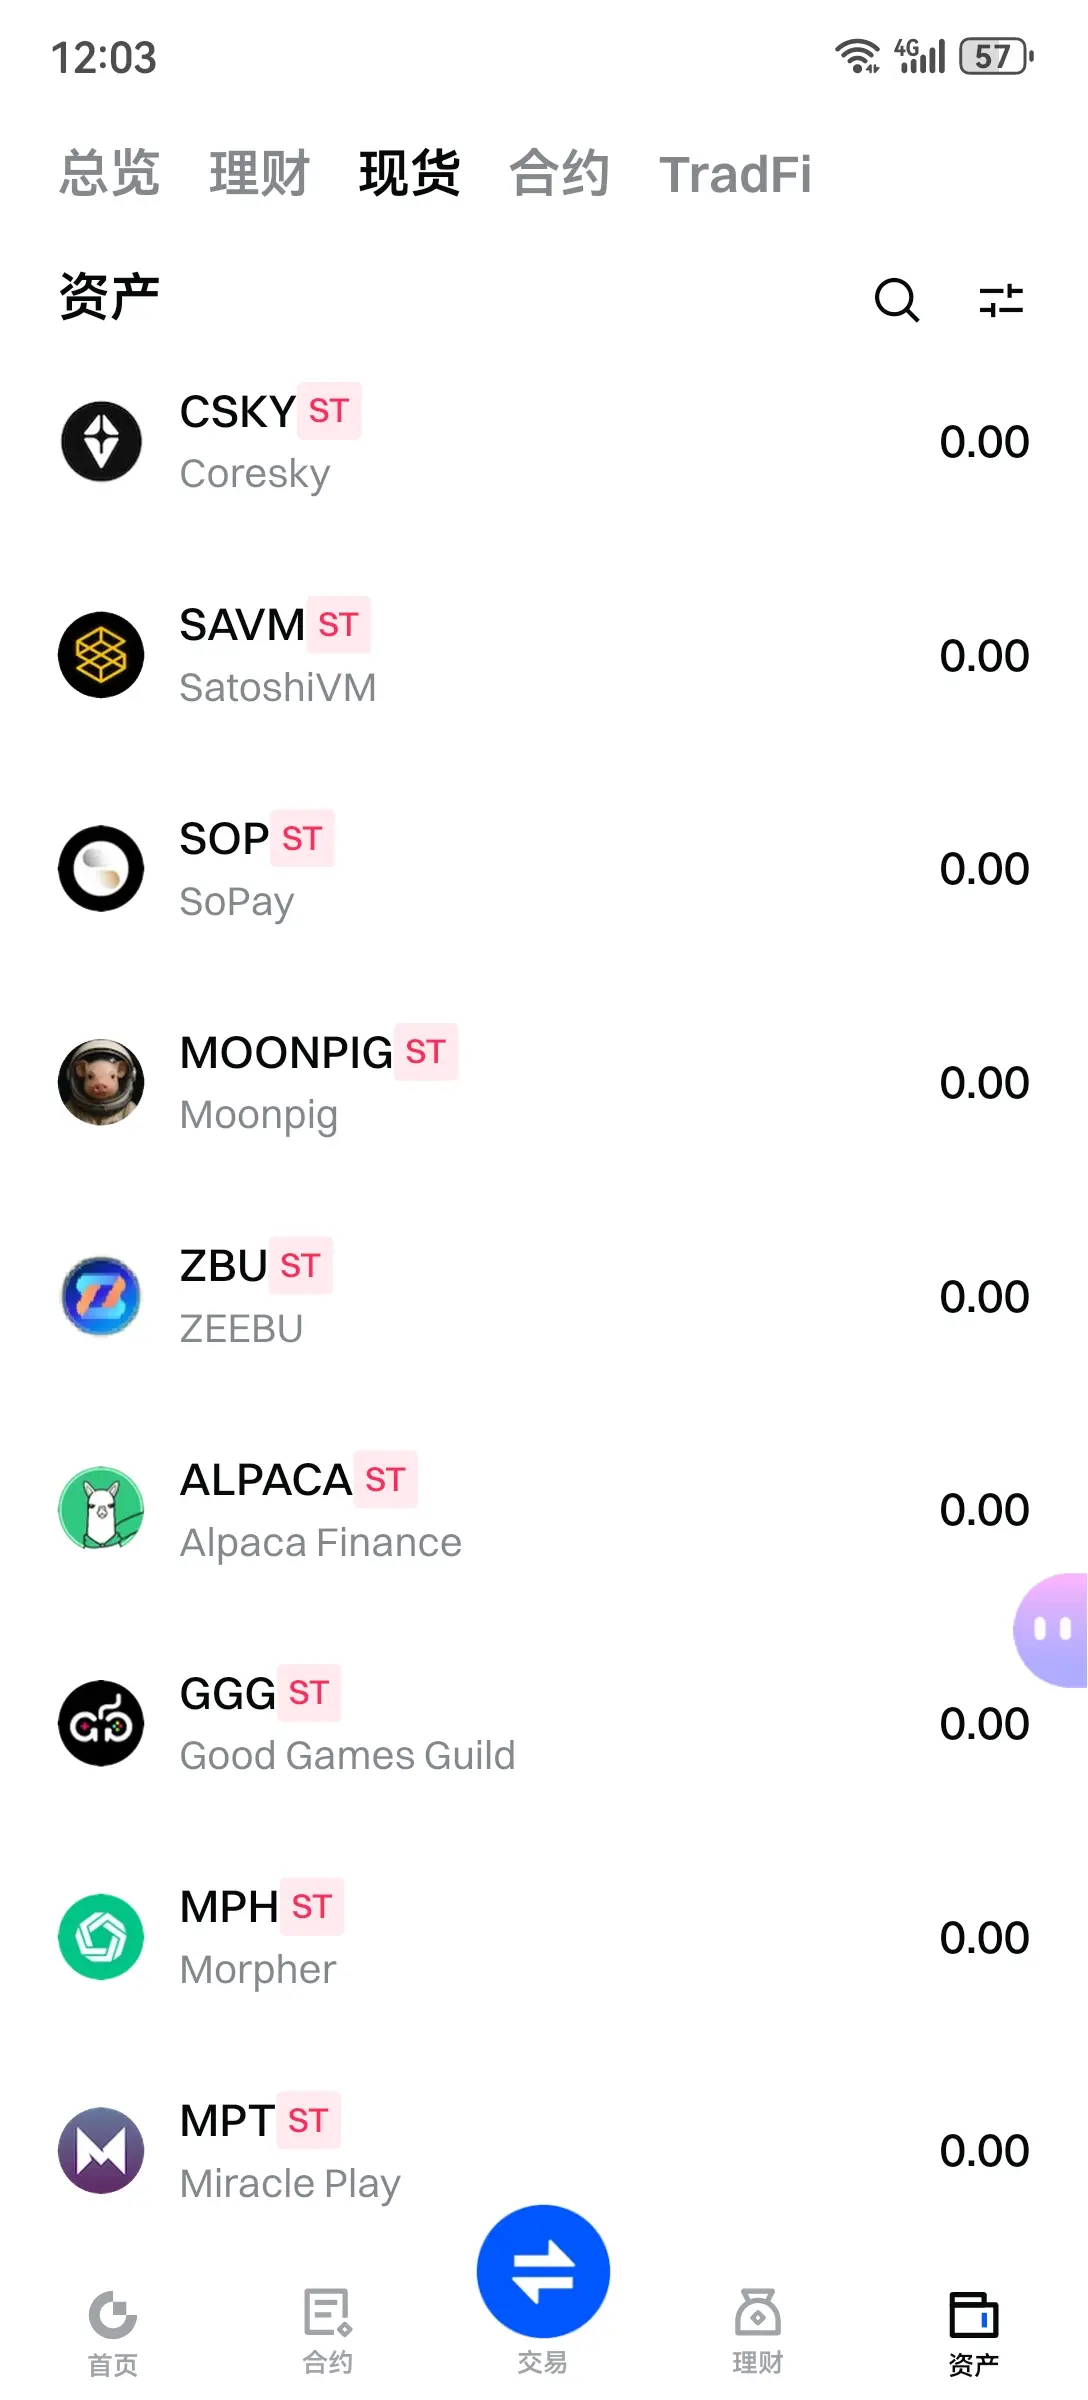
芝麻开门
芝麻开门
創建人@梦想旅途
上市進度
100.00%
市值:
$2102.33
更多代幣
META 可能裁員 20%。內部人士表示為 30%。
15.8K 個職位消失。
Reality Labs 被大幅縮減。
$135B 改為投入 AI。
以下是所有人忽略的地方:
這不是裁員。這是一個藍圖。
Meta 不是因為收入下降而裁員。他們裁員是因為 AI 做得更快。
需要 50 人的支持團隊?現在只需要 5 人。
需要數週的代碼?現在幾天就能發布。
目標:到 2026 年員工減少 40%。
當職位消失時,新職位應運而生:
- AI 訓練師,年薪 $200K+
- 提示詞工程師
- 自動化架構師
問題不是「AI 會搶走我的工作嗎?」
而是「我能比身邊的人更好地使用 AI 嗎?」
Meta 剛剛就此答案下注 $135B 。
你的賭注是什麼?
查看原文15.8K 個職位消失。
Reality Labs 被大幅縮減。
$135B 改為投入 AI。
以下是所有人忽略的地方:
這不是裁員。這是一個藍圖。
Meta 不是因為收入下降而裁員。他們裁員是因為 AI 做得更快。
需要 50 人的支持團隊?現在只需要 5 人。
需要數週的代碼?現在幾天就能發布。
目標:到 2026 年員工減少 40%。
當職位消失時,新職位應運而生:
- AI 訓練師,年薪 $200K+
- 提示詞工程師
- 自動化架構師
問題不是「AI 會搶走我的工作嗎?」
而是「我能比身邊的人更好地使用 AI 嗎?」
Meta 剛剛就此答案下注 $135B 。
你的賭注是什麼?

- 讚賞
- 1
- 留言
- 轉發
- 分享
新華社華盛頓3月17日電 美軍中央司令部17日晚稱,美軍「數小時前」使用多枚重達5000磅(約2.7噸)的鑽地炸彈襲擊霍爾木茲海峽沿岸的伊朗導彈陣地。#Gate广场AI测评官
查看原文- 讚賞
- 1
- 留言
- 轉發
- 分享
昨晚你可能做了一件有點蠢的事。
設了鬧鐘等凌晨 2 點。或者沒設,但睜眼第一件事是摸手機,找價格
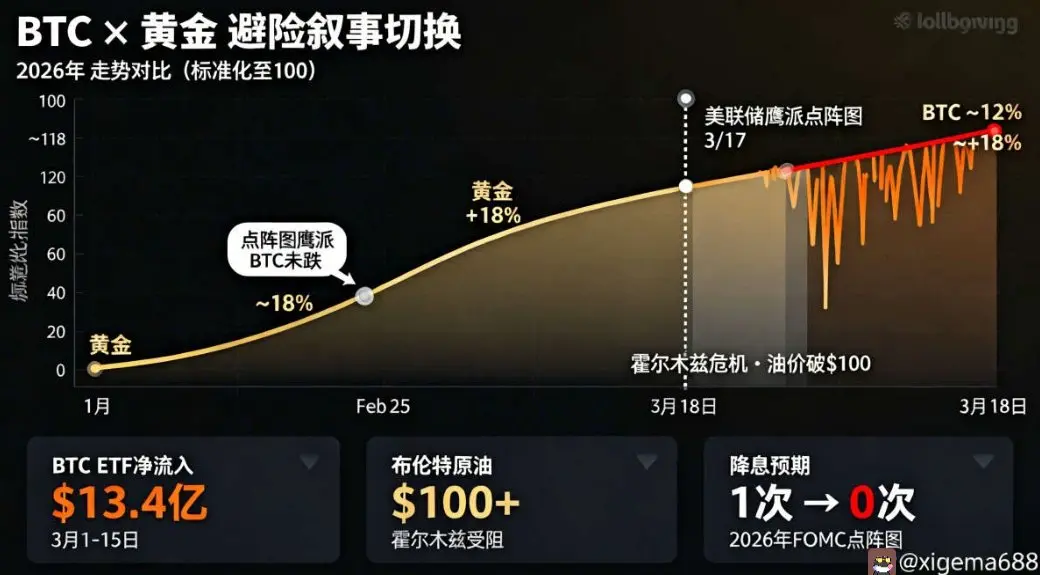
美聯儲宣布:利率不動。點陣圖出來,2026 年降息預期從 1 次壓到接近 0
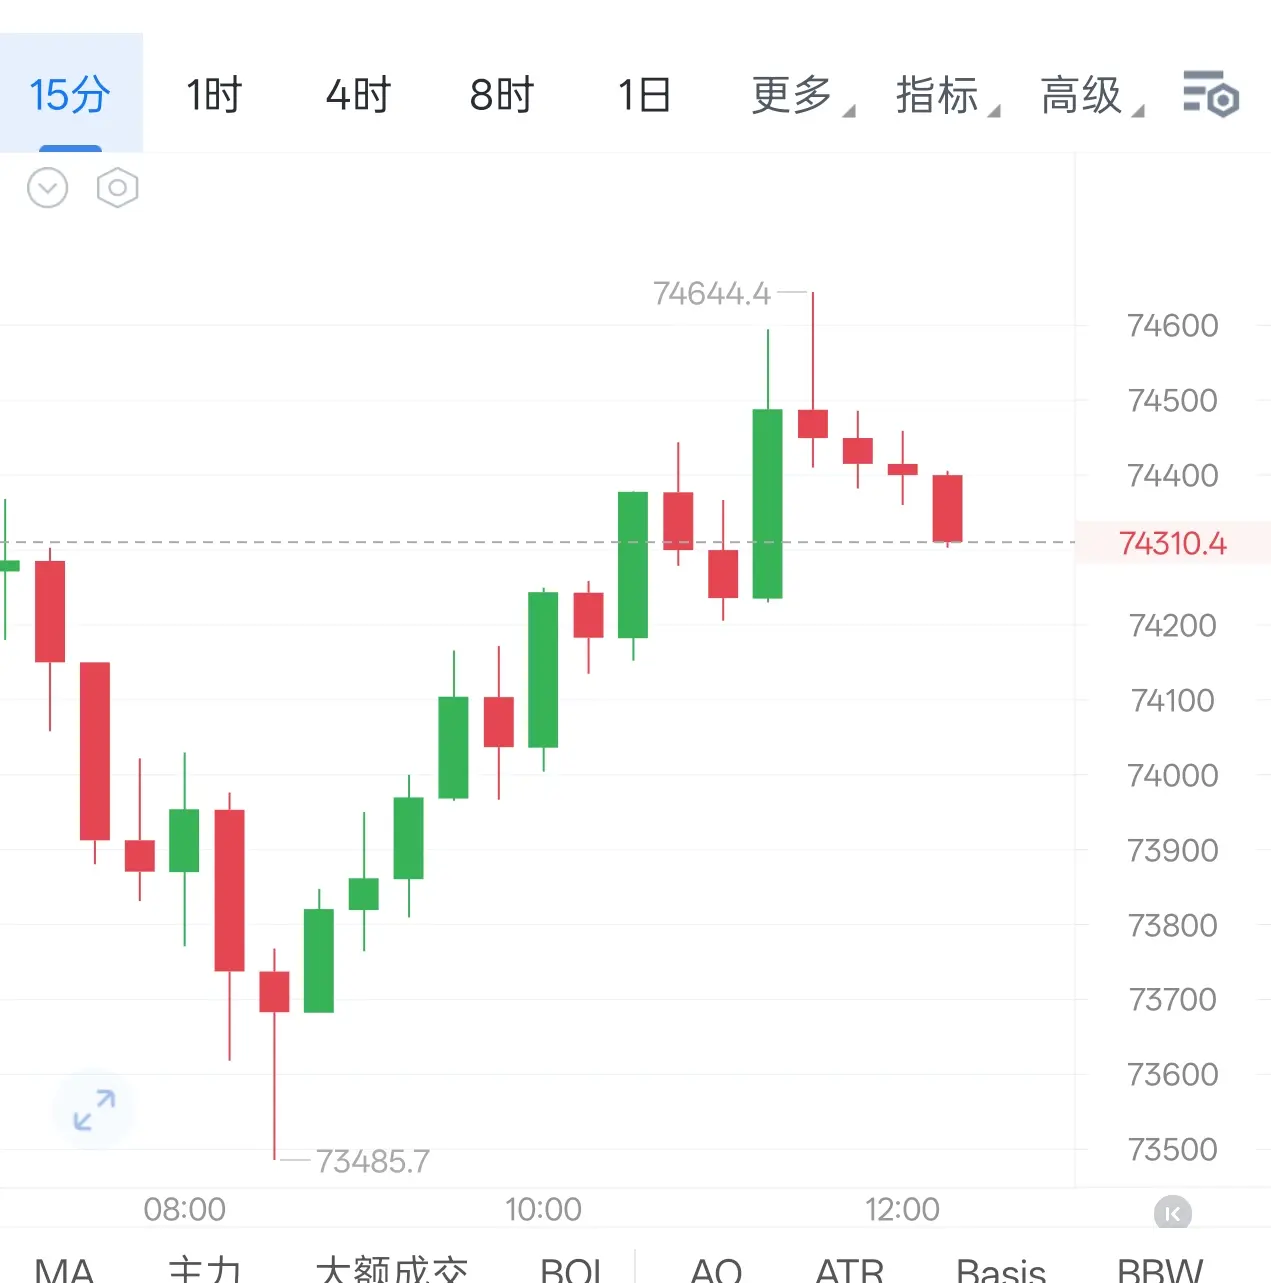
然後……BTC 沒怎麼動。還在 $74000 附近
很多人看完,又把手機放下了。不知道該怎麼想。
這個"不知道怎麼想",本身就是一個信號。
過去兩年,BTC 和美聯儲的關係非常清晰:鴿派點陣圖,BTC 漲;鷹派點陣圖,美元走強,BTC 跌。邏輯簡單,好操作,大家都學會了。
點陣圖昨晚是鷹的。按這套邏輯,今早應該回踩 $68,000–$70,000。
沒有。
所以你不知道怎麼想——因為你一直用的框架,給出了它自己也沒兌現的預測。
是框架壞了,還是市場變了?
看一個數字:3 月上半月,現貨 BTC ETF 淨流入超過 13.4 億美元。BlackRock、Fidelity 沒有停。
同期背景是:以色列-伊朗衝突第三周,霍爾木茲海峽受阻,油價破 $100,全球通脹預期再起。這種宏觀組合放兩年前,BTC 早就被一起砸了。
這次沒有。機構在最亂的三周裡還在買,他們買的顯然不是"降息預期"。
黃金今年漲了約 18%。BTC 同期走出了幾乎一模一樣的曲線。
這筆錢持有 BTC 的理由,已經不是你以為的那個了。
當然,風險沒有消失。
Powell 的繼任者
設了鬧鐘等凌晨 2 點。或者沒設,但睜眼第一件事是摸手機,找價格
美聯儲宣布:利率不動。點陣圖出來,2026 年降息預期從 1 次壓到接近 0
然後……BTC 沒怎麼動。還在 $74000 附近
很多人看完,又把手機放下了。不知道該怎麼想。
這個"不知道怎麼想",本身就是一個信號。
過去兩年,BTC 和美聯儲的關係非常清晰:鴿派點陣圖,BTC 漲;鷹派點陣圖,美元走強,BTC 跌。邏輯簡單,好操作,大家都學會了。
點陣圖昨晚是鷹的。按這套邏輯,今早應該回踩 $68,000–$70,000。
沒有。
所以你不知道怎麼想——因為你一直用的框架,給出了它自己也沒兌現的預測。
是框架壞了,還是市場變了?
看一個數字:3 月上半月,現貨 BTC ETF 淨流入超過 13.4 億美元。BlackRock、Fidelity 沒有停。
同期背景是:以色列-伊朗衝突第三周,霍爾木茲海峽受阻,油價破 $100,全球通脹預期再起。這種宏觀組合放兩年前,BTC 早就被一起砸了。
這次沒有。機構在最亂的三周裡還在買,他們買的顯然不是"降息預期"。
黃金今年漲了約 18%。BTC 同期走出了幾乎一模一樣的曲線。
這筆錢持有 BTC 的理由,已經不是你以為的那個了。
當然,風險沒有消失。
Powell 的繼任者
BTC-0.11%
- 讚賞
- 1
- 留言
- 轉發
- 分享
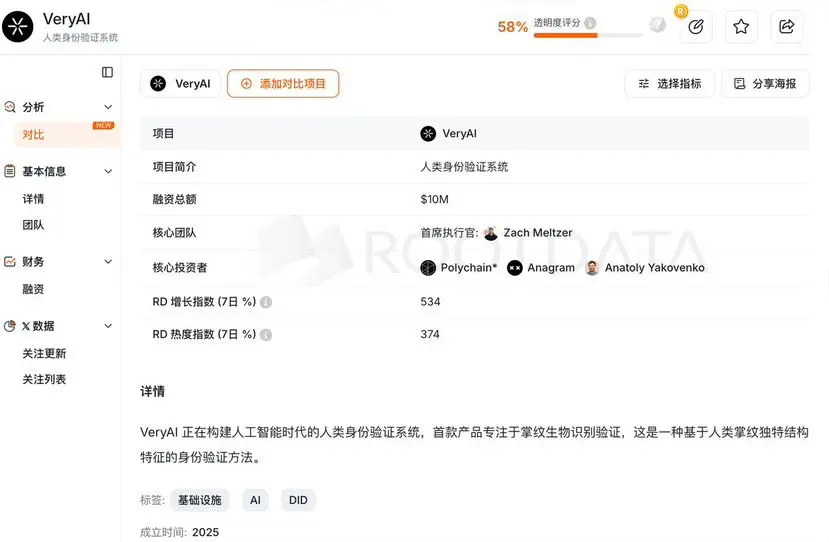
【🚀 5分钟撸空投:顶级机构背书的 VeryAI 零撸空投指南!!!】
VeryAI (@VeryAI) 是 Solana 生态的"人格证明"项目,刚融资 $1000万,投资方包括 Polychain 和 Solana 創始人 Anatoly。
📌 操作步驟(完全免費):
1️⃣下載 App:前往 (圖二) 安裝並郵箱註冊。
2️⃣掌紋識別:打開 App 按照提示掃描手掌(採用 ZK 零知識證明,不存儲原始生物信息,安全)。
3️⃣Discord 認證:加入 (圖二)
4️⃣在 #Get-Verified 頻道,用 VeryAI App 掃描電腦屏幕上的 QR 碼。
5️⃣坐等空投:驗證完成即算卡位成功。
💡 友情提示:
成本:$0 | 時間:5分鐘
注意:App 新上線可能有 Bug,若識別失敗嘗試切換網絡或重裝。
SOL0.1%
- 讚賞
- 按讚
- 留言
- 轉發
- 分享

- 讚賞
- 按讚
- 留言
- 轉發
- 分享
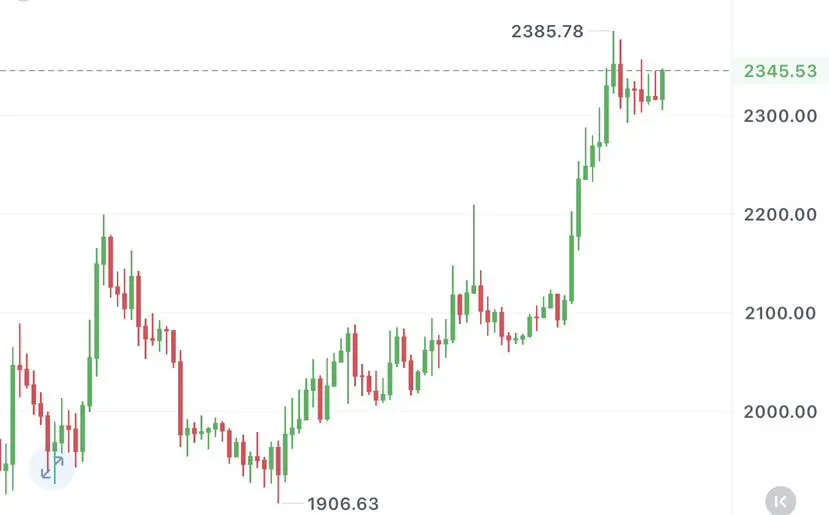
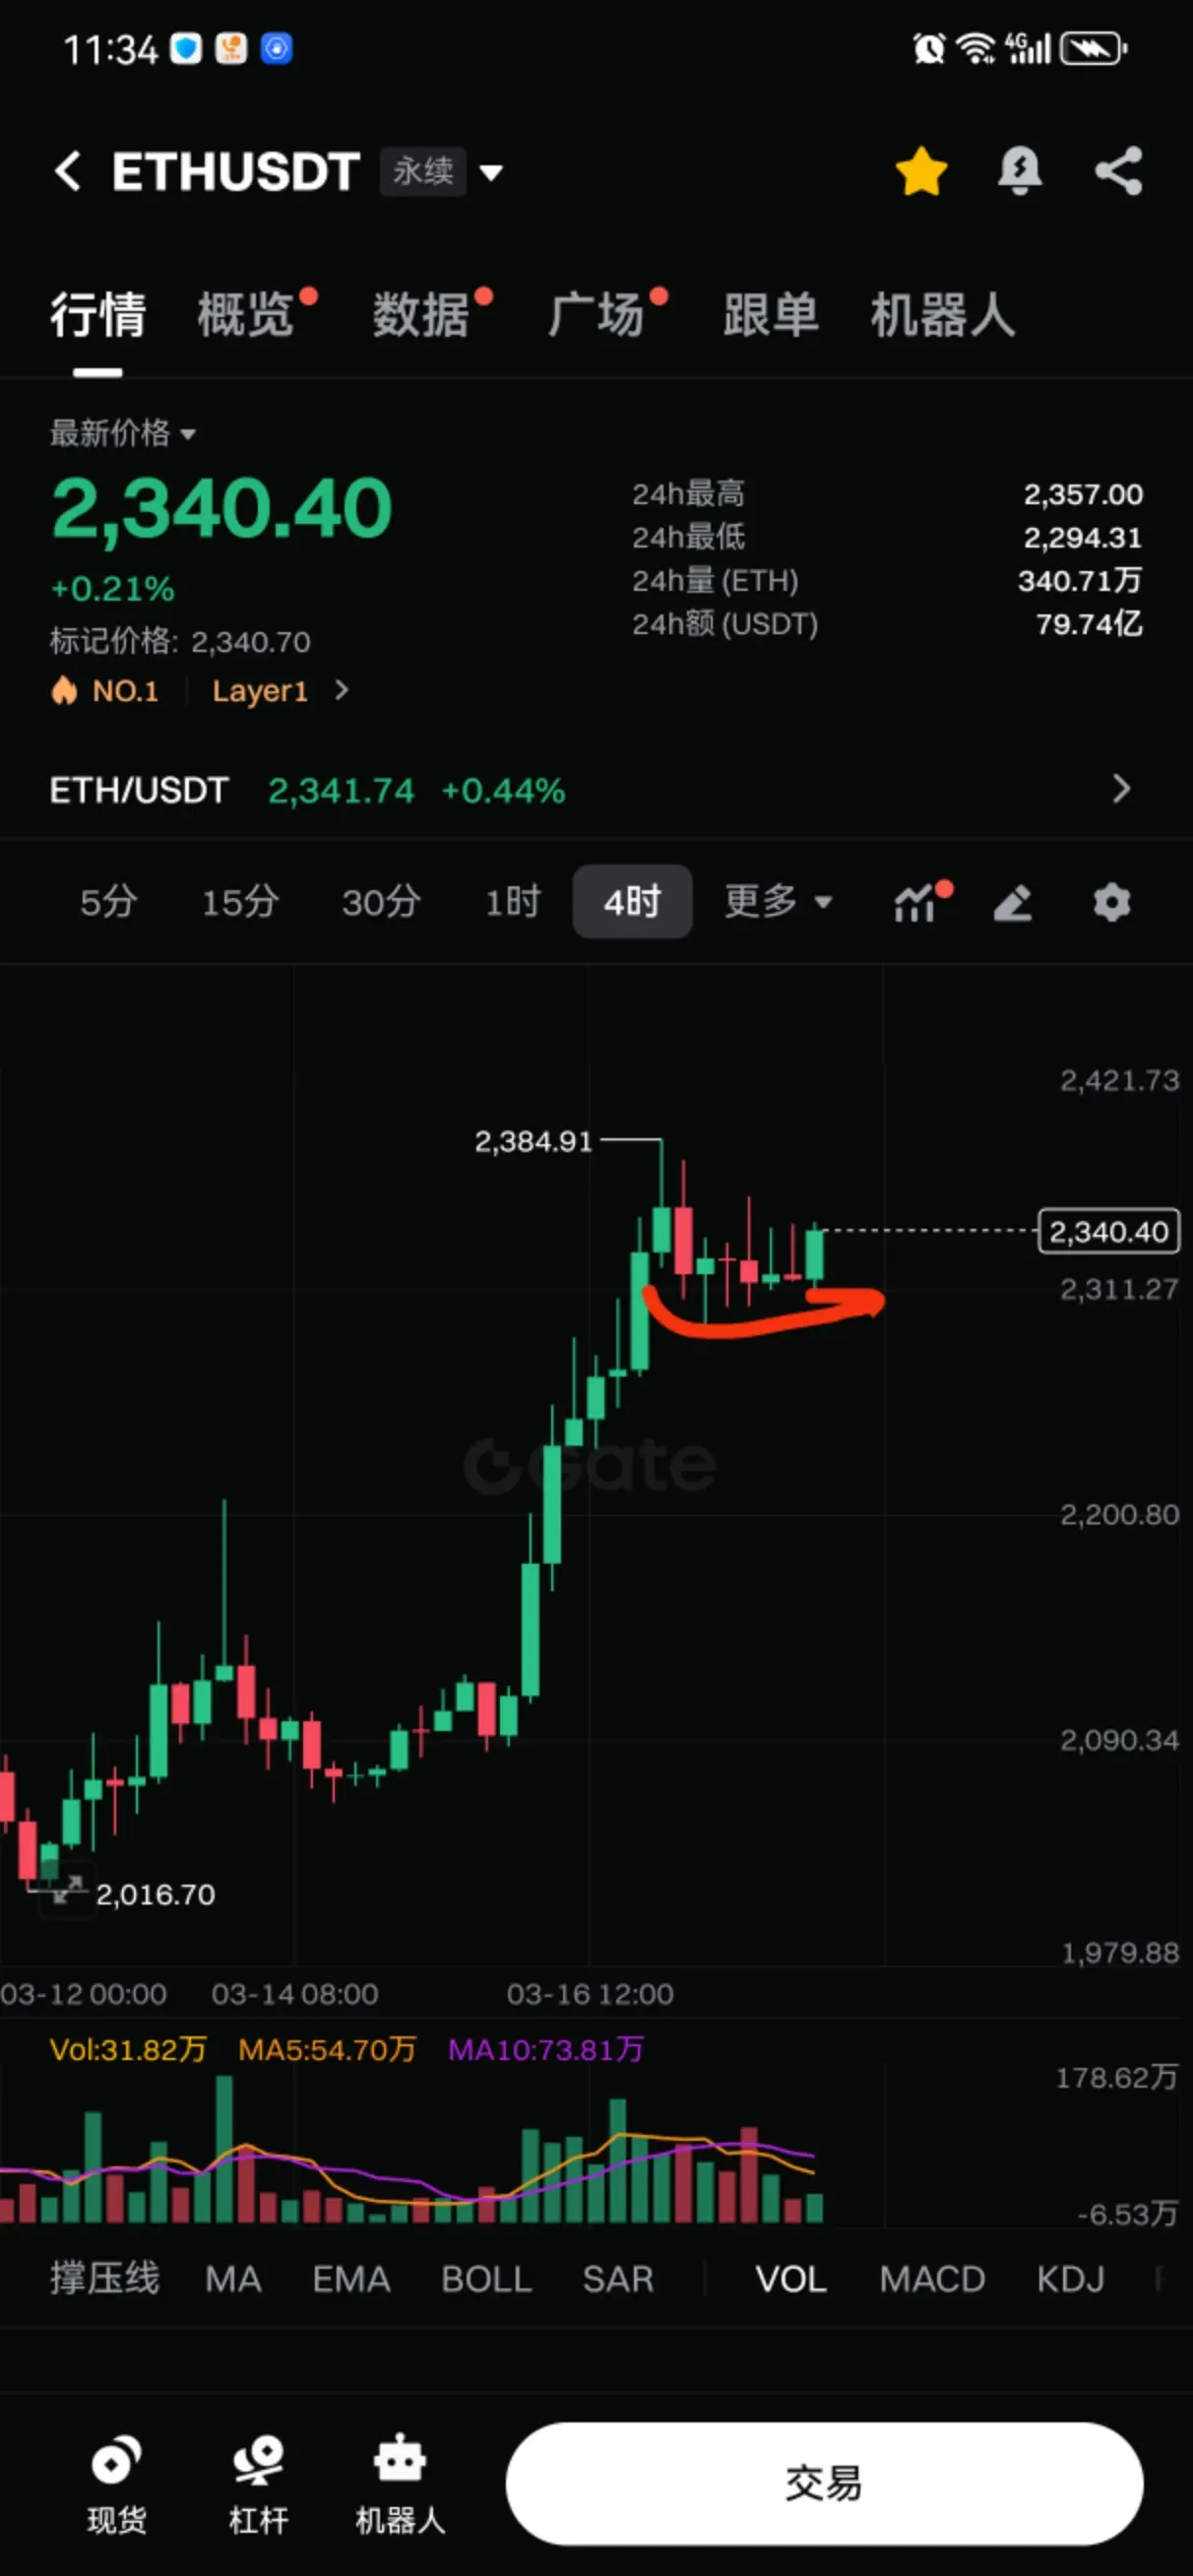
March 18 Midday Ethereum Outlook: Institutional Exodus + Technical Top, ETH May Face Significant Pullback Tonight
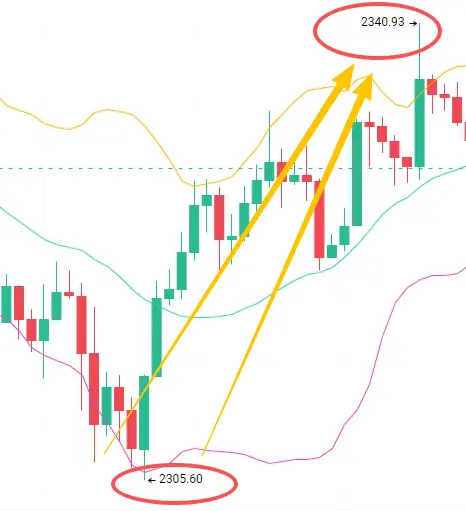
Dual headwinds from macro conditions and institutions; if the Federal Reserve signals hawkish policy tonight, tightening liquidity will directly impact risk assets. Technical setup also forms a double top, with 2380-2385 USD creating strong double top resistance on the 4-hour chart. After multiple failed bullish attempts, price has retreated.
Short in batches at the 2350-2380 resistance zone, with stop loss set above 2400. Initial target 2250-2260, break below targets 2200 and 2158
ETH0.58%
- 讚賞
- 2
- 留言
- 轉發
- 分享

Ethereum bulls supporting at 2290-2300
Bears resistance above 2345-2355
Everyone trading should set stop losses
4-hour formed solid candle, I'm bullish! #Gate广场AI测评官
Bears resistance above 2345-2355
Everyone trading should set stop losses
4-hour formed solid candle, I'm bullish! #Gate广场AI测评官
ETH0.58%
- 讚賞
- 2
- 留言
- 轉發
- 分享
KDC
KlondikeCoin
創建人@GateUser-283da7f1
上市進度
0.00%
市值:
$2448.27
更多代幣
#GateSquareAIReviewer
🤖 Gate Square AI 評測官計劃 — AI 驅動內容洞察的新時代
人工智能正在迅速改變我們交易、分析數據和理解金融市場的方式。認識到這一轉變,Gate Square 推出了 AI 評測官計劃——一項專注性計劃,旨在賦能創作者、交易者和分析師分享真實的 AI 洞察,並為不斷增長的知識生態系統做出貢獻。
💡 為什麼這項計劃很重要
AI 不再只是一個概念——它已在以下領域得到積極應用:
演算法和自動化交易
市場預測模型
情緒分析和數據解讀
風險管理和投資組合優化
Gate Square 正在打造一個空間,讓用戶將這些創新轉化為可行的洞察,使 AI 對更廣泛的社區更加實用易得。
🧠 專門的 AI 內容創作中心
AI 評測官計劃的結構旨在鼓勵:
使用 AI 工具進行交易的體驗類內容
解釋 AI 策略和工作流程的教育性帖子
AI 驅動的性能和結果的分析分解
這不僅僅是發帖——而是提供價值、清晰度和他人可以學習和應用的真實用例。
📈 獎勵質量、一致性與深度
該計劃旨在表彰以下貢獻者:
發佈高質量和原創的 AI 焦點帖子
分享可驗證的洞察,包括策略和結果
在社區內保持一致性和參與度
特別強調深度文章和實際演示,確保有意義的貢獻脫穎而出並獲得可見性。
🏆 多個認可類別
參與者可以在不同領域進行定位,例如:
AI 體驗分享 — 討論工
查看原文🤖 Gate Square AI 評測官計劃 — AI 驅動內容洞察的新時代
人工智能正在迅速改變我們交易、分析數據和理解金融市場的方式。認識到這一轉變,Gate Square 推出了 AI 評測官計劃——一項專注性計劃,旨在賦能創作者、交易者和分析師分享真實的 AI 洞察,並為不斷增長的知識生態系統做出貢獻。
💡 為什麼這項計劃很重要
AI 不再只是一個概念——它已在以下領域得到積極應用:
演算法和自動化交易
市場預測模型
情緒分析和數據解讀
風險管理和投資組合優化
Gate Square 正在打造一個空間,讓用戶將這些創新轉化為可行的洞察,使 AI 對更廣泛的社區更加實用易得。
🧠 專門的 AI 內容創作中心
AI 評測官計劃的結構旨在鼓勵:
使用 AI 工具進行交易的體驗類內容
解釋 AI 策略和工作流程的教育性帖子
AI 驅動的性能和結果的分析分解
這不僅僅是發帖——而是提供價值、清晰度和他人可以學習和應用的真實用例。
📈 獎勵質量、一致性與深度
該計劃旨在表彰以下貢獻者:
發佈高質量和原創的 AI 焦點帖子
分享可驗證的洞察,包括策略和結果
在社區內保持一致性和參與度
特別強調深度文章和實際演示,確保有意義的貢獻脫穎而出並獲得可見性。
🏆 多個認可類別
參與者可以在不同領域進行定位,例如:
AI 體驗分享 — 討論工

- 讚賞
- 2
- 留言
- 轉發
- 分享
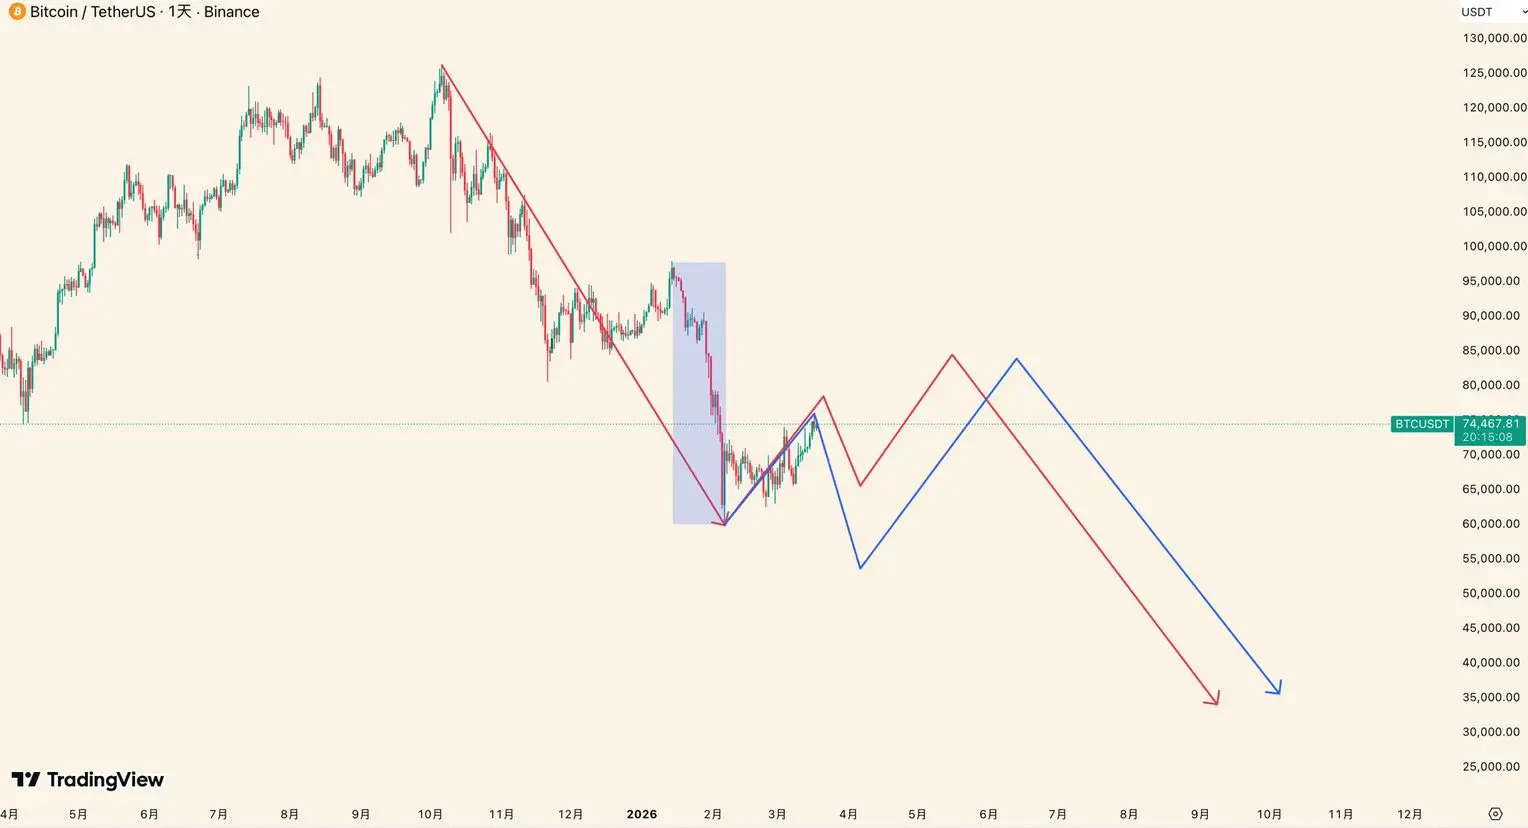
The rebound has lasted 39 days. If this rebound is targeting the decline from 97,900 to 60,000 (blue route), then we must find the rebound endpoint this week and turn downward. Otherwise, the possibility is that the rebound starting from 60,000 is targeting the entire decline from 126,000 to 60,000 (red route).
Based on our division of BTC structure, I've presented two possible routes in the chart:
Red route: The rebound starting from 60,000 overall forms a three-wave structure. This week's highest weekly candle point is the endpoint of the first rebound wave. After the first rebound completes
Based on our division of BTC structure, I've presented two possible routes in the chart:
Red route: The rebound starting from 60,000 overall forms a three-wave structure. This week's highest weekly candle point is the endpoint of the first rebound wave. After the first rebound completes
BTC-0.11%
- 讚賞
- 1
- 留言
- 轉發
- 分享
新主播 BTC突破75,000 24小時漲幅超反彈是否重新點燃
320
- 讚賞
- 按讚
- 留言
- 轉發
- 分享
- 讚賞
- 3
- 留言
- 轉發
- 分享
No holding positions, exit when profitable, don't get greedy, this is a short-term bounce, exit immediately when target is reached, stand by if volatility is small #SEC与CFTC新监管指引 $BTC
BTC-0.12%
- 讚賞
- 2
- 留言
- 轉發
- 分享

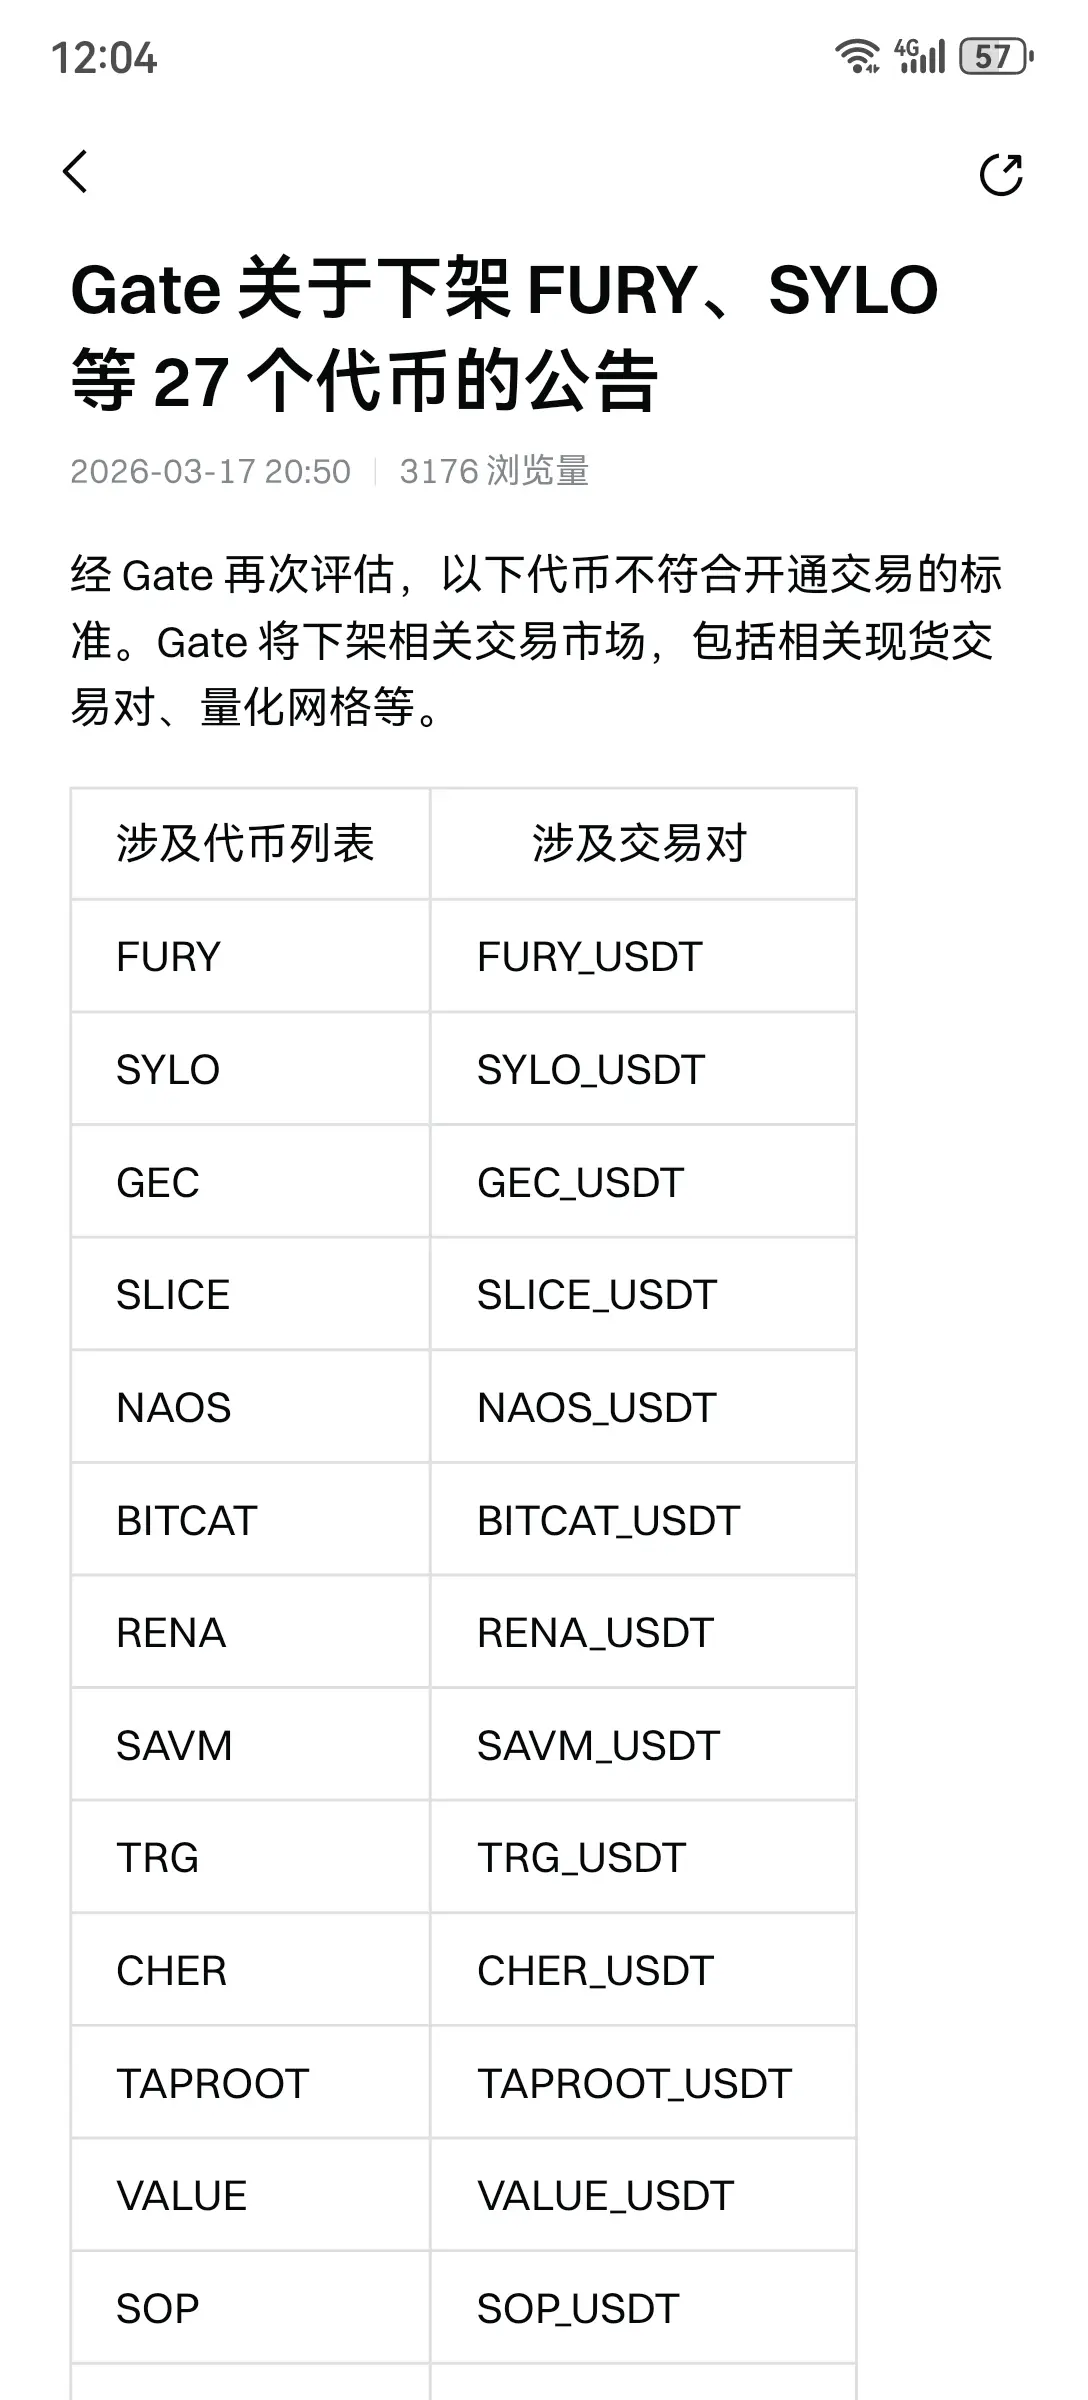
感谢GateCEO及所有团队的辛苦!每个月集中几次定点的下架垃圾币!只有所有交易所团结起来下架所有的垃圾币才会有健康的上涨和回调!币种数量越少资金越集中才有爆发力,才会回归山寨季和指日可待的大饼100万刀!加油
- 讚賞
- 3
- 留言
- 轉發
- 分享
2026 AI Agent的三大趋势來襲,錯過等一年!
1️⃣多模態融合將成主流,AI能同時理解文字、圖片、語音、視頻,信息處理能力大飛躍,交互體驗直接拉滿!
2️⃣個人化助手會成標配,它能深度了解你的習慣,幫你處理重複繁瑣工作,讓你告別低效忙碌。
3️⃣AI工具鏈整合是大勢,多個AI協同作戰,效率提升不止一點點。
別等AI完美無缺才去用,現在就可以讓AI幫你整理會議紀要、生成週報,把時間省下來,專注在投資決策、行情分析這些真正重要的事上,一起擁抱AI新時代!
查看原文1️⃣多模態融合將成主流,AI能同時理解文字、圖片、語音、視頻,信息處理能力大飛躍,交互體驗直接拉滿!
2️⃣個人化助手會成標配,它能深度了解你的習慣,幫你處理重複繁瑣工作,讓你告別低效忙碌。
3️⃣AI工具鏈整合是大勢,多個AI協同作戰,效率提升不止一點點。
別等AI完美無缺才去用,現在就可以讓AI幫你整理會議紀要、生成週報,把時間省下來,專注在投資決策、行情分析這些真正重要的事上,一起擁抱AI新時代!
- 讚賞
- 1
- 留言
- 轉發
- 分享
加載更多
加入 4000萬 人匯聚的頭部社群
⚡️ 與 4000萬 人一起參與加密貨幣熱潮討論
💬 與喜愛的頭部創作者互動
👍 查看感興趣的內容
熱門話題
查看更多39.25萬 熱度
293.6萬 熱度
75.67萬 熱度
356.26萬 熱度
43.08萬 熱度
熱門 Gate Fun
查看更多- 市值:$2451.72持有人數:10.00%
- 市值:$0.1持有人數:10.00%
- 市值:$2451.72持有人數:10.00%
- 市值:$2503.18持有人數:20.00%
- 市值:$2490.11持有人數:20.07%
最新消息
查看更多2 个新地址在 Polymarket 押注 3.62 万美元买入美军今年进入伊朗
7 分鐘前
International oil prices decline, on-chain largest crude oil short seller Abraxas Capital's $27.8 million position turns profitable
15 分鐘前
Starknet主網計劃今日升級,將區塊哈希計算遷移至去中心化Apollo節點
26 分鐘前
阿里雲 AI 算力和存儲產品最高漲價 34%
27 分鐘前
ZetaChain 生態應用 Anuma 推出短信原生 AI 助手 Anuma Friends
35 分鐘前
置頂
Gate Booster 第 4 期:發帖瓜分 1,500 $USDT
🔹 發布 TradFi 黃金福袋原創內容,可得 15 $USDT,名額有限先到先得
🔹 本期支持 X、YouTube 發布原創內容
🔹 無需複雜操作,流程清晰透明
🔹 流程:申請成為 Booster → 領取任務 → 發布原創內容 → 回鏈登記 → 等待審核及發獎
📅 任務截止時間:03月20日16:00(UTC+8)
立即領取任務:https://www.gate.com/booster/10028?pid=allPort&ch=KTag1BmC
更多詳情:https://www.gate.com/announcements/article/50203🤖 尋找 Gate 廣場 AI 評測官!$50,000 懸賞令發布!
發帖聊 AI,獎金拿到手軟!新人首帖獎勵翻倍,單帖最高 200U!
📝 立即報名:https://www.gate.com/questionnaire/7477
1️⃣ 發帖得紅包,單帖最高 100U!
2️⃣ Top 體驗分享官:帶 #Gate广场AI测评官 聊技巧,贏國米球衣!
3️⃣ 收益率 PK 王:曬 AI 收益截圖,贏 Gate 定制運動套裝!
4️⃣ 深度好文額外加碼 30U 每篇張榜公布!
💬 來 Gate 廣場,把握行業新趨勢:https://www.gate.com/post
時間:3/12 18:00 – 3/27 24:00 (UTC+8)
詳情:https://www.gate.com/announcements/article/50206Gate 廣場內容挖礦獎勵繼續升級!無論您是創作者還是用戶,挖礦新人還是頭部作者都能贏取好禮獲得大獎。現在就進入廣場探索吧!
創作者享受最高60%創作返佣
創作者獎勵加碼1500USDT:更多新人作者能瓜分獎池!
觀眾點擊交易組件交易贏大禮!最高50GT等新春壕禮等你拿!
詳情:https://www.gate.com/announcements/article/49802