Consulte análises especializadas e previsões de mercado aprofundadas sobre a ARPA para 2025. Este guia completo explora tendências de preços, estratégias de investimento e os principais fatores que poderão influenciar o valor futuro da ARPA. Aceda a insights profissionais acerca da tecnologia ARPA, impactos macroeconómicos e possíveis riscos. Visite a Gate para aceder a dados de negociação em tempo real e aprofundar os seus conhecimentos de investimento em privacy computing no contexto do mercado de criptomoedas. Descubra estratégias adequadas para holding de longo prazo e trading ativo. Mantenha-se atualizado sobre possíveis máximos e mínimos e otimize a gestão dos seus riscos de investimento.
Introdução: Posição de Mercado da ARPA e Valor de Investimento
A ARPA (ARPA) é uma rede de computação privada flexível, simples e compatível, que oferece camadas de protocolo para as principais blockchains públicas. Desde o lançamento em 2021, a ARPA consolidou-se como um agente relevante no segmento da computação privada. Em dezembro de 2025, a capitalização bolsista da ARPA ronda os 24,52 milhões USD, com cerca de 982,17 milhões de tokens em circulação e um valor aproximado de 0,01226 USD por token. Este ativo inovador, reconhecido pela sua “tecnologia de computação multipartidária segura”, ganha protagonismo ao permitir integração, partilha e processamento colaborativo de dados entre múltiplas entidades nos setores financeiro, de avaliação de crédito, marketing e saúde.
Este artigo disponibiliza uma análise completa da evolução do preço da ARPA para o período 2025-2030, integrando padrões históricos, dinâmicas da oferta e procura, desenvolvimento do ecossistema e fatores macroeconómicos, para apresentar previsões rigorosas de preço e estratégias de investimento práticas para investidores.
Histórico de Preço da ARPA e Relatório de Análise de Mercado
I. Análise Histórica do Preço da ARPA e Situação Atual de Mercado
Trajetória Histórica do Preço da ARPA
-
13 de março de 2020: A ARPA atingiu o mínimo histórico de 0,00339441 USD, iniciando a fase de descoberta de preço do projeto.
-
3 de novembro de 2021: A ARPA alcançou o máximo histórico de 0,268622 USD, refletindo o pico de valorização num ciclo de mercado mais amplo.
-
março de 2020 - novembro de 2021: O preço disparou de 0,00339441 USD para 0,268622 USD, evidenciando uma valorização expressiva neste intervalo.
-
novembro de 2021 - dezembro de 2025: O preço recuou de 0,268622 USD para aproximadamente 0,01226 USD, traduzindo uma queda de cerca de 75,42% num horizonte de um ano.
Situação Atual de Mercado da ARPA
A 21 de dezembro de 2025, a ARPA está a negociar nos 0,01226 USD, correspondendo a uma variação de -0,8% nas últimas 24 horas. Na última hora, o token registou uma ligeira subida de +0,33%, com intervalo diário entre 0,01214 USD (mínimo) e 0,01325 USD (máximo).
O desempenho dos últimos 7 dias assinala uma queda de -8,78%, enquanto o registo dos últimos 30 dias marca uma descida de -13,54%. O desempenho anual revela uma depreciação acentuada de -75,42% face ao máximo.
A capitalização bolsista da ARPA ronda os 12,04 milhões USD, com uma avaliação diluída total de 24,52 milhões USD. Existem 982 174 603 tokens ARPA em circulação, cerca de 49,11% do total máximo de 2 mil milhões de tokens. O token apresenta uma dominância de mercado de 0,00075% e ocupa a posição #1085 no ranking de capitalização bolsista.
O volume negociado em 24 horas foi de 13 406,14 USD, estando o ativo cotado em 27 plataformas. O número de detentores situa-se nos 26 276 endereços, refletindo uma distribuição moderadamente dispersa.
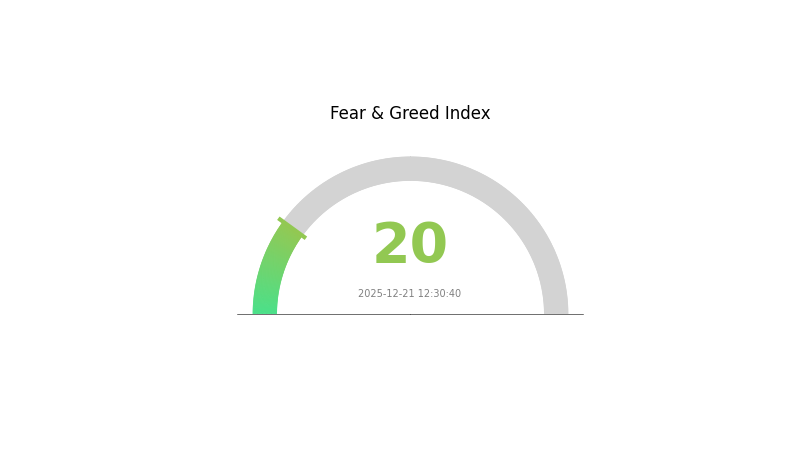
O sentimento de mercado revela condições de medo extremo, conforme indicadores globais do setor.
Clique para consultar o preço de mercado atual da ARPA

Índice de Sentimento de Mercado ARPA
21-12-2025 Fear and Greed Index: 20 (Medo Extremo)
Clique para consultar o Fear & Greed Index
O mercado cripto encontra-se em estado de medo extremo, com o índice a fixar-se em 20. Este valor muito baixo revela um pessimismo acentuado e forte aversão ao risco face aos ativos digitais. Situações de pânico podem gerar oportunidades contrárias para investidores de longo prazo, pois as quedas podem ter empurrado os preços para níveis abaixo dos fundamentais. Contudo, níveis extremos de medo justificam cautela, pois podem revelar agravamento das condições de mercado. É recomendável acompanhar suportes técnicos e diversificar o portefólio por ativos estáveis na Gate.com para uma gestão de risco adequada neste contexto volátil.
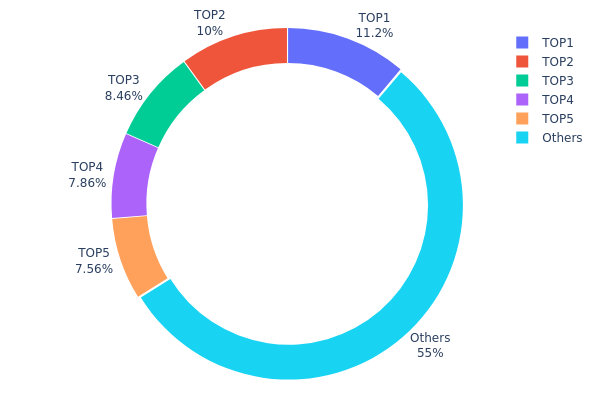
Distribuição de Detenção ARPA
O gráfico de distribuição de detentores mostra a concentração de tokens ARPA entre endereços blockchain, permitindo visualizar a proporção do total detido pelos principais intervenientes. Esta métrica é essencial para avaliar o grau de descentralização, estrutura de mercado e potenciais riscos sistémicos do ecossistema.
A distribuição atual apresenta concentração moderada. Os cinco maiores detentores agregam cerca de 45,03% do total, sendo o principal responsável por 11,16% e o segundo por 10,00%. Estes números revelam concentração entre principais stakeholders, embora os restantes 54,97% dispersos indiquem uma base razoavelmente distribuída. O padrão reflete uma estrutura onde nenhum agente individual domina, ainda que os principais detentores mantenham forte influência sobre decisões e dinâmicas do mercado.
Estes níveis de concentração têm implicações estruturais e operacionais. Grandes detentores podem causar maior volatilidade em liquidações ou movimentos coordenados, mas a maioria dispersa contribui para alguma estabilidade. Em termos de descentralização, a ARPA apresenta um perfil intermédio—não excessivamente concentrada nem atomizada. O ecossistema mostra convivência entre institucionais e investidores de retalho, sugerindo resiliência contra manipulação unilateral e espaço para maior descentralização futura.
Clique para consultar a Distribuição de Detenções ARPA
| Top |
Endereço |
Qtd. Detida |
Detenção (%) |
| 1 |
0x5ec0...f8d3ab |
223 302,29K |
11,16% |
| 2 |
0x5a52...70efcb |
200 000,00K |
10,00% |
| 3 |
0x28c6...f21d60 |
169 230,39K |
8,46% |
| 4 |
0x1681...5b4f65 |
157 111,11K |
7,85% |
| 5 |
0x76ec...78fbd3 |
151 257,00K |
7,56% |
| - |
Outros |
1 099 099,21K |
54,97% |
II. Fatores-Chave que Influenciam o Futuro Preço da ARPA
Contexto Macroeconómico
-
Impacto da Política Monetária: Decisões de taxas dos principais bancos centrais (Fed, BCE, Banco do Japão) são determinantes para a dinâmica do preço ARPA. Políticas expansionistas—juros baixos e compras de ativos—favorecem os criptoativos, enquanto políticas restritivas têm efeito oposto.
-
Sentimento do Mercado Cripto: A evolução do preço da ARPA depende dos ciclos do mercado global de criptoativos. Em períodos bull, o interesse do investidor tende a valorizar o token. É crucial monitorizar as tendências gerais do setor e indicadores macro para antecipar movimentos relevantes.
Tecnologia e Arquitetura
- Threshold BLS Signature Network: A arquitetura da ARPA assenta na Threshold BLS Signature Network, que suporta funcionalidades como números aleatórios verificáveis. Esta base tecnológica sustenta a proposta de valor do projeto.
III. Previsão ARPA 2025-2030
Previsão 2025
- Cenário conservador: 0,00797 - 0,01226 USD
- Cenário neutro: 0,01226 USD
- Cenário otimista: 0,0179 USD (dependente de momentum sustentado e desenvolvimento do ecossistema)
Previsão 2026-2027
- Expectativa de mercado: Recuperação gradual com adoção crescente e interesse institucional acrescido
- Intervalos previstos:
- 2026: 0,01041 - 0,02171 USD
- 2027: 0,01435 - 0,02539 USD
- Catalisadores: Melhoria de funcionalidades, expansão de parcerias, aumento da liquidez e recuperação do mercado cripto
Previsão de Longo Prazo 2028-2030
- Cenário base: 0,01511 - 0,03218 USD (com adoção estável e crescimento moderado)
- Cenário otimista: 0,03218 - 0,03681 USD (dependente de upgrades e adoção empresarial relevante)
- Cenário de transformação: >0,03681 USD (com inovação tecnológica, adoção institucional e contexto regulatório favorável)
- 21 de dezembro de 2030: ARPA nos 0,03681 USD (cenário máximo base)
Nota: Estas previsões resultam da análise de dados históricos e do contexto atual. Movimentos reais podem divergir devido a volatilidade, alterações regulatórias, evolução tecnológica e fatores macroeconómicos. Investidores devem realizar diligência prévia e consultar profissionais antes de investir. Negociar na Gate.com ou outras plataformas envolve riscos inerentes.
| Ano |
Máximo Previsto |
Média Prevista |
Mínimo Previsto |
Variação (%) |
| 2025 |
0,0179 |
0,01226 |
0,00797 |
0 |
| 2026 |
0,02171 |
0,01508 |
0,01041 |
23 |
| 2027 |
0,02539 |
0,0184 |
0,01435 |
50 |
| 2028 |
0,03218 |
0,02189 |
0,01511 |
78 |
| 2029 |
0,0338 |
0,02704 |
0,01514 |
120 |
| 2030 |
0,03681 |
0,03042 |
0,01734 |
148 |
Relatório de Estratégia de Investimento e Gestão de Risco ARPA
IV. Estratégia Profissional de Investimento e Gestão de Risco ARPA
Metodologia de Investimento ARPA
(1) Estratégia de Longo Prazo
(2) Estratégia de Trading Ativo
-
Ferramentas Técnicas:
- RSI (Índice de Força Relativa): Monitorizar sobrecompra (>70) e sobrevenda (<30) em prazos de 4h e diários para identificar potenciais reversões.
- Médias Móveis: Usar médias de 50 e 200 dias para confirmar tendências; sinais de trading surgem quando a média curta cruza a longa.
-
Pontos-Chave:
- Intervalo atual em 24h: 0,01214 - 0,01325 USD; comprar próximo dos suportes e vender junto das resistências.
- Observar padrões de volume; volumes crescentes validam tendências de preço.
- Definir stop-loss 5-10% abaixo do preço de entrada para limitar risco de queda.
Estrutura de Gestão de Risco ARPA
(1) Princípios de Alocação
- Perfil conservador: Alocar 1-3% do portefólio total à ARPA, priorizando preservação de capital.
- Perfil moderado: Alocar 3-8%, equilibrando potencial de valorização e mitigação de risco.
- Perfil agressivo: Alocar 8-15%, aceitando maior volatilidade para captar valorização potencial.
(2) Soluções de Cobertura
- Diversificação: Combinar ARPA com criptomoedas consolidadas e stablecoins para diluir risco de concentração e volatilidade.
- Dimensionamento: Utilizar tamanho fixo por posição (não arriscar mais de 2% por trade) para uma gestão de capital sustentável.
(3) Soluções de Armazenamento Seguro
- Hot Wallet: A Web3 Wallet da Gate.com garante armazenamento seguro, controlo direto do utilizador, integração de trading e participação ativa no ecossistema.
- Cold Storage: Para posições superiores a 12 meses, privilegiar soluções hardware para máxima segurança.
- Boas Práticas de Segurança: Nunca partilhar chaves privadas ou frases-semente; ativar autenticação de dois fatores; conferir endereços de smart contracts antes de transferências; manter vigilância contra phishing.
V. Riscos e Desafios ARPA
Riscos de Mercado
- Elevada volatilidade: ARPA desvalorizou 75,42% no último ano e 13,54% no último mês, refletindo instabilidade pronunciada e potencial de novas quedas.
- Liquidez reduzida: Volume diário de 13 406 USD e capitalização limitada implicam maior risco de slippage em negociações de maior dimensão.
- Sensibilidade ao sentimento: Como projeto de pequena capitalização, a ARPA é vulnerável a alterações bruscas de sentimento e concorrência em infraestrutura de privacidade.
Riscos Regulatórios
- Scrutínio regulatório: Projetos de privacidade enfrentam escrutínio acrescido devido a riscos de uso ilícito.
- Conformidade transfronteiriça: Operação em múltiplas redes expõe a diferentes regimes legais, podendo restringir funcionalidades em certas jurisdições.
- Incertezas na adoção empresarial: A regulação sobre computação multipartidária e partilha de dados pode travar a adoção em setores regulados.
Riscos Tecnológicos
- Implementação criptográfica: Qualquer falha pode pôr em causa a segurança dos dados e a confiança do mercado.
- Interoperabilidade: A compatibilidade com blockchains exige manutenção técnica contínua para evitar fragmentação.
- Concorrência: Soluções alternativas e concorrentes já estabelecidos podem limitar a quota de mercado e adoção da ARPA.
VI. Conclusão e Recomendações
Avaliação do Valor de Investimento
A ARPA atua numa área crítica da infraestrutura de privacidade, respondendo à procura empresarial por colaboração segura de dados. O núcleo tecnológico evidencia mérito e inovação. No entanto, enfrenta desafios: desempenho anual muito negativo (-75,42%), capitalização reduzida e liquidez limitada. A adoção empresarial, essencial para a valorização, está numa fase inicial, o que aumenta o risco de execução. A ARPA representa, assim, uma aposta de elevado risco e potencial elevado retorno, adequada apenas a investidores com tolerância a risco e visão de longo prazo.
Recomendações de Investimento
✅ Iniciantes: Iniciar exposição mínima (0,5-1% do capital) na Gate.com, utilizando compras periódicas ao longo de 3-6 meses e evitando trading alavancado.
✅ Investidores experientes: Negociar com base em níveis técnicos (suporte: 0,0120 USD, resistência: 0,0135 USD), respeitar rigorosamente o dimensionamento (2% por trade), monitorizar anúncios de adoção empresarial e reequilibrar a cada trimestre.
✅ Institucionais: Realizar due diligence exaustiva, avaliar concorrentes e alternativas, garantir custódia via Gate.com e considerar alocação reduzida (2-5% da componente infraestrutura blockchain) alinhada com a tese de privacidade.
Como Participar na Negociação da ARPA
- Negociação spot na Gate.com: Compra e detenção direta dos tokens ARPA; recomendado para investidores de longo prazo que priorizem a segurança dos ativos.
- Integração de portefólio: Combinar ARPA com outros tokens de privacidade ou infraestrutura para exposição equilibrada ao Web3.
- Reequilíbrios periódicos: Rever trimestralmente o desempenho da ARPA face a benchmarks de privacidade e ajustar posições de acordo com métricas de adoção e evolução competitiva.
Investir em criptoativos implica risco extremo; este relatório não constitui aconselhamento de investimento. Cada investidor deve avaliar o risco face ao seu perfil e consultar profissionais financeiros. Nunca invista valores cuja perda total não possa suportar.
FAQ
Qual a previsão para a ARPA crypto?
A ARPA deverá atingir 0,014936 USD até 2030, com potenciais ganhos de 5% no curto prazo e possibilidade de alcançar 0,011704 USD já amanhã. As estimativas apontam para um cenário de crescimento sustentado face à análise de mercado e tendências de negociação.
Qual a previsão de preço para a ARPA em 2040?
Com base na análise de mercado atual, a ARPA Chain poderá situar-se entre 0,8991 USD e 2,38 USD em 2040. Esta previsão reflete o potencial de crescimento de longo prazo impulsionado por tendências de mercado e inovação tecnológica.
Qual é o total de oferta da ARPA?
A ARPA tem uma oferta total de 2 000 000 000 moedas, representando todas as tokens criadas, excetuando as eventualmente queimadas.
* As informações não se destinam a ser e não constituem aconselhamento financeiro ou qualquer outra recomendação de qualquer tipo oferecido ou endossado pela Gate.