The article provides an in-depth analysis of Energy Web Token (EWT), focusing on its price dynamics and market position as a key asset in blockchain-based energy infrastructure. It addresses investment strategies and risk management for various investor profiles, while offering detailed forecasts for EWT's price from 2025 to 2030. Readers will find insights into market sentiment, regulatory challenges, and technology risks. EWT is recognized for transforming decentralized energy markets, and this article equips investors with actionable strategies and comprehensive market data, with token trading available exclusively on Gate.
Introduction: Market Position and Investment Value of EWT
Energy Web Token (EWT) serves as the native utility token for Energy Web Chain, a verified public blockchain supported by a network of verifiers comprising major companies in the licensed energy sector. Since its launch, EWT has established itself as a critical infrastructure asset for securing the network and compensating validators through transaction fees and verification rewards. As of December 2025, EWT has achieved a market capitalization of approximately $60.1 million, with a circulating supply of around 83.6 million tokens trading at $0.7219 per unit.
This asset, recognized for its specialized focus on the energy sector's blockchain infrastructure, is playing an increasingly vital role in enabling decentralized energy markets and network security. Despite a challenging year-over-year performance decline of -57.82%, EWT has demonstrated resilience with a 7-day price gain of 7.77%, reflecting the market's continued interest in blockchain solutions for the energy industry.
This article will provide a comprehensive analysis of EWT's price dynamics from 2025 through 2030, incorporating historical price patterns, market supply-demand dynamics, ecosystem development, and macroeconomic factors to equip investors with professional price forecasts and actionable investment strategies. For those interested in trading EWT, the token is available on Gate.com and other major exchanges, offering multiple entry points for market participants.
I. EWT Price History Review and Current Market Status
EWT Current Market Position
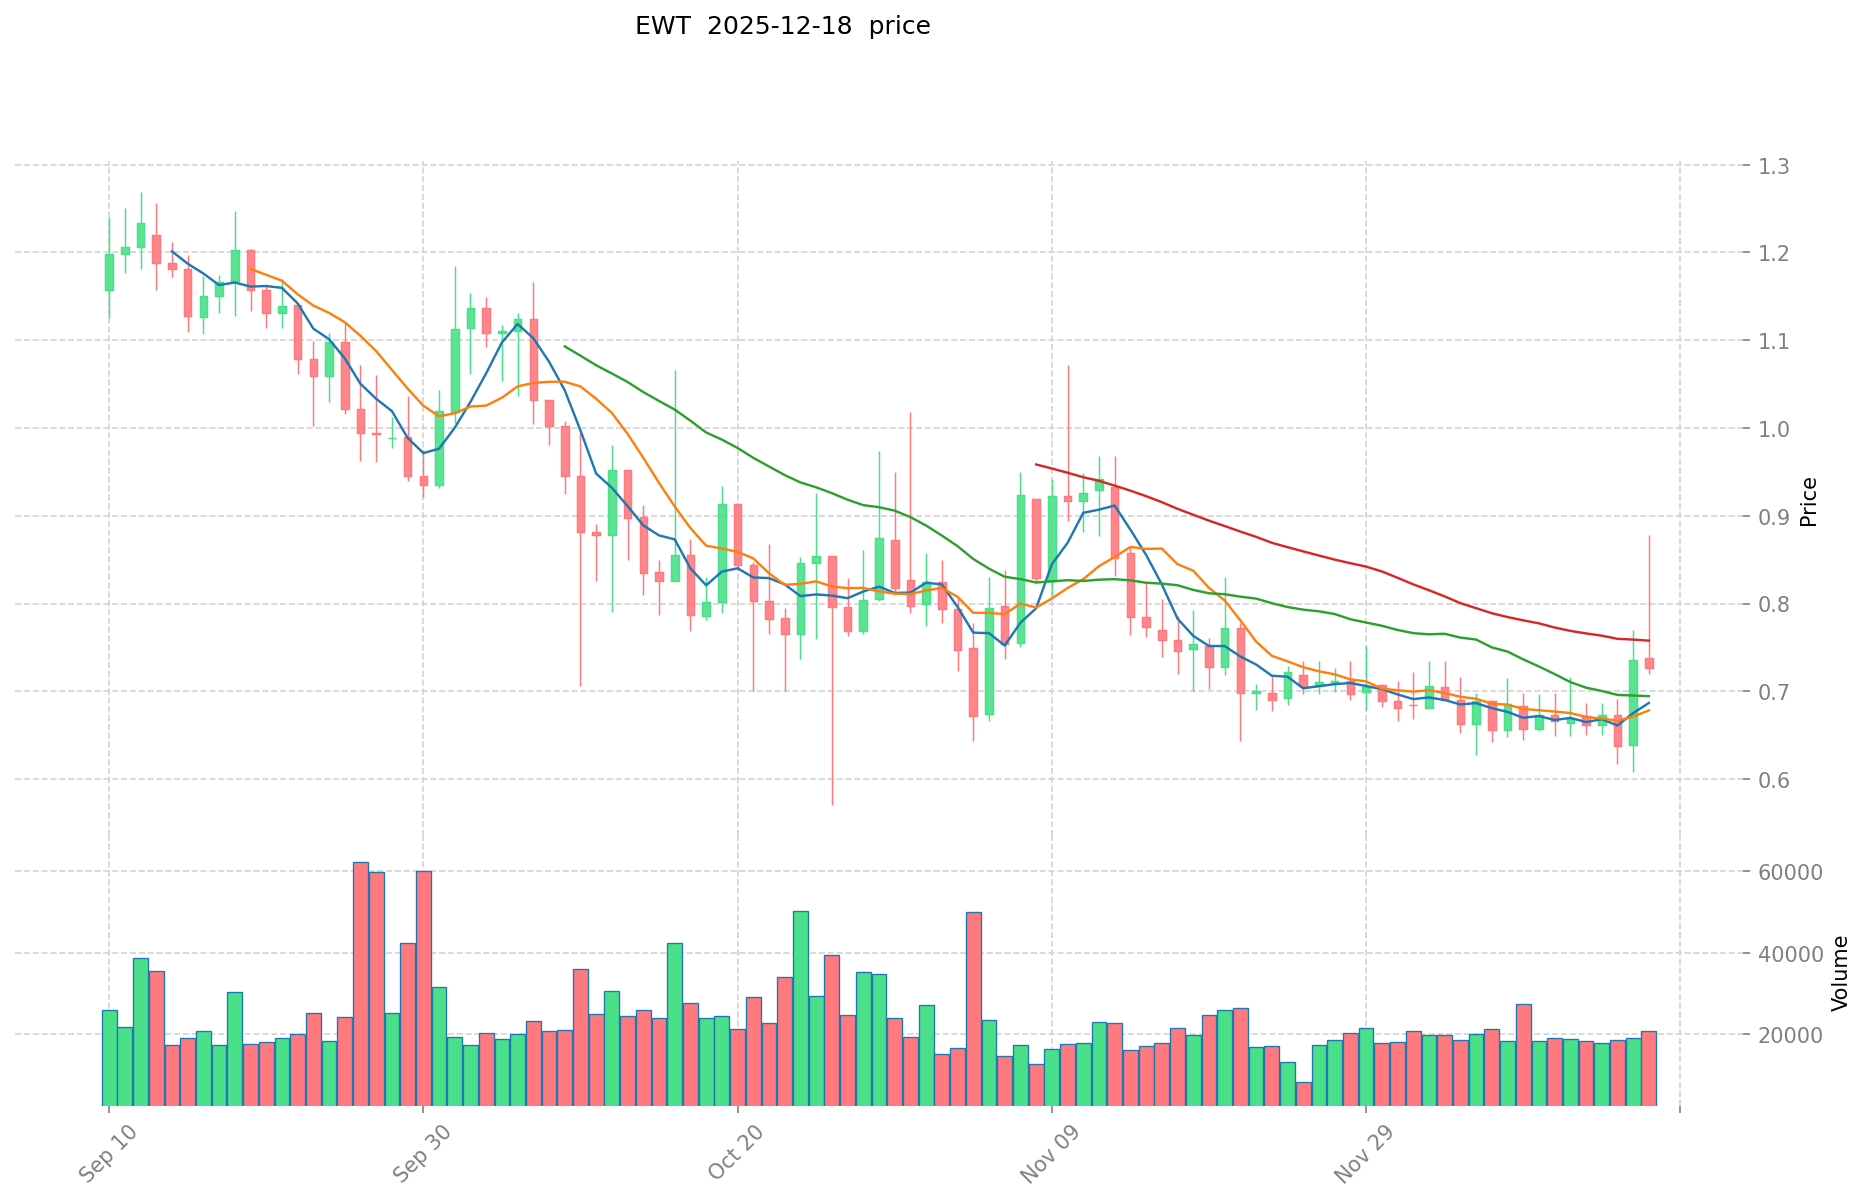
As of December 18, 2025, Energy Web Token (EWT) is trading at $0.7219, reflecting a -2.33% decline over the past 24 hours. The token has experienced modest volatility within a 24-hour range of $0.7159 to $0.878.
Key Market Metrics:
- Market Capitalization: $60.38 million (circulating supply basis)
- Fully Diluted Valuation: $60.11 million
- Circulating Supply: 83,645,644.69 EWT tokens
- Total Supply: 83,261,434.26 EWT tokens
- 24-Hour Trading Volume: $15,640.23
- Market Ranking: 451st by market cap
- Market Dominance: 0.0019%
Price Performance Across Timeframes:
- 1-Hour Change: -0.96%
- 7-Day Change: +7.77%
- 30-Day Change: -1.18%
- 1-Year Change: -57.82%
The token's performance over the past year indicates significant downward pressure, with EWT declining substantially from previous levels. However, the positive 7-day performance suggests recent recovery momentum within the intermediate timeframe.
The circulating supply ratio stands at 100.46%, indicating that circulating tokens slightly exceed the initially defined total supply, which may reflect tokenomic adjustments or additional issuances made by the protocol.
Click to view current EWT market price
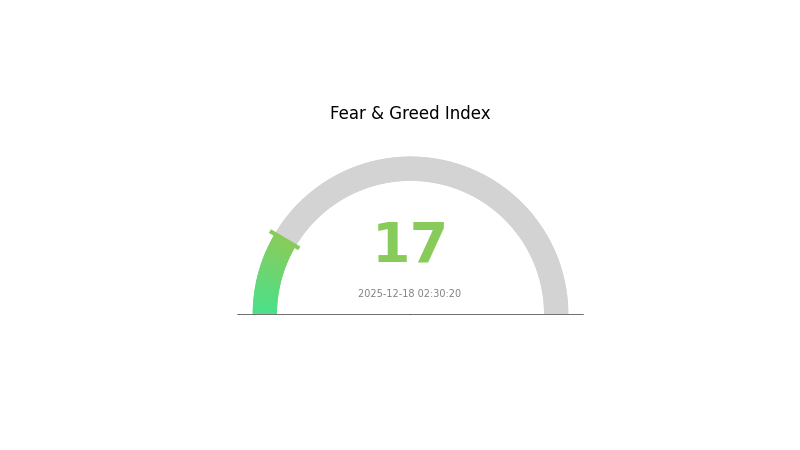
EWT Market Sentiment Indicator
2025-12-18 Fear and Greed Index: 17 (Extreme Fear)
Click to view the current Fear & Greed Index
The cryptocurrency market is currently experiencing extreme fear, with the Fear and Greed Index dropping to 17. This indicates investors are highly pessimistic about near-term market conditions. Extreme fear typically presents contrarian opportunities, as it often precedes market reversals. However, investors should exercise caution during this period, as further downside is possible. Consider dollar-cost averaging into positions rather than making lump-sum investments. Monitor key support levels and wait for confirming signals before increasing exposure. Stay informed through Gate.com's real-time market data to make well-timed trading decisions.
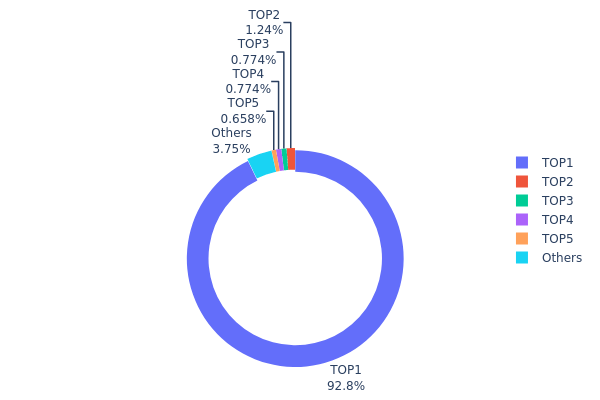
EWT Holdings Distribution
The address holdings distribution chart illustrates the concentration of EWT tokens across on-chain addresses, serving as a critical metric for assessing token decentralization and potential market manipulation risks. By tracking the percentage of total supply held by individual addresses, this analysis reveals the tokenomics structure and identifies whether wealth concentration poses systemic risks to the ecosystem.
EWT demonstrates severe concentration risk, with the top address commanding 92.81% of the total supply (77.81 million tokens). This extreme dominance by a single entity fundamentally compromises the token's decentralization narrative and raises significant governance concerns. The top five addresses collectively control 96.23% of the circulating supply, leaving only 3.77% distributed among remaining holders. Such pronounced concentration typically indicates either early-stage development stages dominated by founding entities, exchange custody holdings, or locked token allocations awaiting release.
This distribution structure presents considerable implications for market dynamics and price stability. The overwhelming concentration of holdings in a single address creates asymmetric information advantages and elevated systemic risk, as token liquidity and price discovery mechanisms remain heavily dependent on the actions of dominant holders. Market participants face heightened vulnerability to potential exit events, large-scale transfers, or coordinated selling pressure from concentrated positions. The minimal distribution among dispersed addresses suggests limited organic adoption and weak on-chain liquidity, potentially amplifying volatility during trading activity and restricting natural price discovery mechanisms within the broader market ecosystem.
For current EWT holdings distribution data, visit Gate.com
| Top |
Address |
Holding Qty |
Holding (%) |
| 1 |
0x5dde...f0259d |
77811.39K |
92.81% |
| 2 |
0x0d07...b492fe |
1036.01K |
1.23% |
| 3 |
0x69be...6ee5e0 |
648.67K |
0.77% |
| 4 |
0x2677...ccb975 |
648.67K |
0.77% |
| 5 |
0x9642...2f5d4e |
551.86K |
0.65% |
| - |
Others |
3141.35K |
3.77% |
II. Core Factors Impacting EWT's Future Price
Macroeconomic Environment
-
Monetary Policy Impact: Major central banks, particularly the Federal Reserve, have significant influence on EWT's price through interest rate decisions. When interest rates decline, capital may reallocate into alternative assets like cryptocurrencies. Conversely, rate hikes can redirect investment flows away from risk assets.
-
Inflation Hedge Properties: EWT's performance in inflationary environments depends on its adoption as a store of value relative to traditional assets. As monetary expansion concerns persist, assets with limited supply and utility applications may attract capital seeking inflation protection.
-
Geopolitical Factors: International tensions and trade policy shifts can impact energy markets and regulatory approaches to blockchain technology, thereby affecting EWT's valuation and market sentiment.
Three、2025-2030 EWT Price Forecast
2025 Outlook
- Conservative Forecast: $0.43-$0.72
- Neutral Forecast: $0.72-$1.02
- Optimistic Forecast: $0.72-$1.02 (requires sustained market recovery and increased institutional adoption)
2026-2028 Medium-term Outlook
- Market Stage Expectation: Gradual accumulation and consolidation phase with strengthening bullish momentum, characterized by stabilizing support levels and expanding trading volumes
- Price Range Forecast:
- 2026: $0.83-$1.03 (20% potential upside)
- 2027: $0.72-$1.17 (31% potential upside)
- 2028: $0.93-$1.13 (46% potential upside)
- Key Catalysts: Enhanced ecosystem development, growing mainstream adoption, favorable regulatory framework, and increasing institutional participation
2029-2030 Long-term Outlook
- Base Case: $0.62-$1.13 (51% potential upside by 2029, assuming steady market growth and ecosystem maturation)
- Optimistic Case: $0.80-$1.15 (54% potential upside by 2030, with accelerated adoption and technological breakthroughs)
- Transformative Case: $1.14+ (breakthrough adoption across major markets and emergence as significant digital asset infrastructure)
- 2030-12-18: EWT trading near $1.11 average (consolidation phase with strong foundational support)
| 年份 |
预测最高价 |
预测平均价格 |
预测最低价 |
涨跌幅 |
| 2025 |
1.02297 |
0.7204 |
0.43224 |
0 |
| 2026 |
1.02859 |
0.87168 |
0.8281 |
20 |
| 2027 |
1.16867 |
0.95014 |
0.7221 |
31 |
| 2028 |
1.13356 |
1.0594 |
0.93227 |
46 |
| 2029 |
1.12937 |
1.09648 |
0.62499 |
51 |
| 2030 |
1.14632 |
1.11293 |
0.80131 |
54 |
Energy Web Token (EWT) Professional Investment Report
IV. EWT Professional Investment Strategy and Risk Management
EWT Investment Methodology
(1) Long-term Holding Strategy
- Target Investor Profile: Institutional investors, energy sector participants, and sustainability-focused portfolio managers seeking exposure to decentralized energy infrastructure
- Operation Recommendations:
- Accumulate EWT during market downturns to build a diversified position in blockchain-based energy solutions
- Hold EWT to participate in network validator rewards and transaction fee distributions
- Maintain a minimum 12-month investment horizon to capture the long-term growth potential of Energy Web Chain adoption in the energy sector
(2) Active Trading Strategy
- Market Analysis Considerations:
- Price volatility patterns: EWT experienced a -2.33% decline in 24 hours but showed +7.77% growth over 7 days, indicating short-term volatility
- Trading volume analysis: Current 24-hour volume of $15,640 USD suggests moderate liquidity; monitor volume trends before entering positions
- Wave Trading Key Points:
- Identify support and resistance levels around the $0.72 price range (current trading level)
- Execute trades during periods of higher volume to ensure efficient entry and exit positions
- Set clear stop-loss orders at 5-10% below entry points to manage downside risk
EWT Risk Management Framework
(1) Asset Allocation Principles
- Conservative Investors: 1-3% of portfolio allocation to EWT, focusing on the token's utility in energy infrastructure
- Active Investors: 3-8% of portfolio allocation, with regular rebalancing based on market conditions
- Professional Investors: 5-15% of portfolio allocation, with sophisticated hedging strategies and derivative exposure
(2) Risk Mitigation Strategies
- Portfolio Diversification: Combine EWT holdings with other blockchain infrastructure tokens and traditional energy sector investments to reduce concentration risk
- Position Sizing: Limit individual EWT positions to manageable percentages of total portfolio value to prevent excessive exposure to single-token volatility
(3) Secure Storage Solutions
- Hot Wallet Solutions: Use Gate.com Web3 wallet for regular trading and transaction participation, ensuring convenient access to validator reward opportunities
- Cold Storage Method: Transfer larger EWT holdings to offline storage solutions for enhanced security of long-term positions
- Security Best Practices: Enable two-factor authentication on exchange accounts, use hardware-based authentication methods, and maintain separate wallets for trading and long-term storage
V. EWT Potential Risks and Challenges
EWT Market Risk
- Liquidity Risk: With a market capitalization of approximately $60.1 million USD and only 5 active exchange listings, EWT faces potential liquidity constraints during market stress events
- Price Volatility: Year-to-date performance shows a -57.82% decline, demonstrating significant price volatility that may challenge investor confidence
- Market Sentiment Risk: As a niche infrastructure token, EWT is highly sensitive to adoption trends in the renewable energy and blockchain sectors
EWT Regulatory Risk
- Energy Sector Regulation: Evolving regulatory frameworks for blockchain-based energy trading platforms may impact Energy Web Chain's operational scope and token utility
- Cryptocurrency Compliance: Changes in global cryptocurrency regulations may affect EWT's tradability and institutional adoption
- Environmental Compliance: Regulatory scrutiny regarding blockchain energy consumption may influence the token's market perception
EWT Technology Risk
- Network Security: Dependency on validator network integrity means that security breaches or validator misbehavior could undermine network reliability
- Scalability Challenges: Energy Web Chain must maintain competitive transaction throughput and costs as network demand increases
- Interoperability Risk: The token's value depends on successful integration with existing energy infrastructure and blockchain ecosystems
VI. Conclusion and Action Recommendations
EWT Investment Value Assessment
Energy Web Token represents a specialized investment thesis focused on blockchain-enabled energy infrastructure. The project's alignment with renewable energy adoption trends and decentralized grid management provides long-term value potential. However, the token's substantial year-over-year decline and limited market liquidity present near-term challenges. Investors should evaluate EWT within the context of broader energy sector transformation and blockchain infrastructure development, rather than as a speculative short-term trading vehicle.
EWT Investment Recommendations
✅ Beginners: Start with small positions (0.5-2% of portfolio) on Gate.com, focusing on understanding the Energy Web Chain ecosystem and validator economics before increasing allocation
✅ Experienced Investors: Develop a systematic accumulation strategy during market weakness, incorporating technical analysis to identify optimal entry points while maintaining disciplined risk management
✅ Institutional Investors: Conduct comprehensive due diligence on Energy Web Chain's validator network and partnership development, then establish positions aligned with multi-year energy infrastructure transition timelines
EWT Trading Participation Methods
- Exchange Trading: Purchase EWT directly on Gate.com using spot trading or limit orders to manage entry prices
- Validator Participation: Operate as a validator on Energy Web Chain to earn staking rewards and participate directly in network governance
- Portfolio Integration: Combine EWT holdings with complementary energy and infrastructure tokens to create diversified exposure to decentralized energy systems
Cryptocurrency investment carries extreme risk and is not suitable for all investors. This report does not constitute investment advice. Investors must conduct independent research and consult qualified financial advisors before making investment decisions. Never invest more capital than you can afford to lose. Cryptocurrency markets remain highly volatile and unpredictable.
FAQ
What is the price prediction for EWT crypto in 2030?
EWT price prediction for 2030 ranges from $0.2894 to $0.5376 based on current market trends and analysis. Actual prices may vary depending on market conditions and adoption.
What crypto will 1000x prediction?
Early-stage altcoins with strong fundamentals and adoption potential show the highest 1000x prospects. Bitcoin Hyper, emerging layer 2 solutions, and select meme coins demonstrate significant growth trajectories for 2025.
How high could etc go?
ETC could potentially reach $500 or higher based on market trends and historical patterns. Its price often correlates with Ethereum's movements, offering significant growth potential in future bull cycles.
Will TRX reach $1 in 2025?
Yes, TRX reached $1 in 2025, driven by significant technological advancements and increased market adoption. This ambitious target was ultimately achieved through strong ecosystem development and growing user engagement.
* The information is not intended to be and does not constitute financial advice or any other recommendation of any sort offered or endorsed by Gate.